INTRODUCTION
Niche theory and neutral theory are conflicting hypotheses to explain species coexistence, community structure and spatial patterns in tree communities in tropical forests (Chave Reference CHAVE2004, Gaston & Chown Reference GASTON and CHOWN2005, Hubbell Reference HUBBELL2005, Tilman Reference TILMAN1994, Yu et al. Reference YU, TERBORGH and POTTS1998). Niche theory predicts that interspecific differences in plant morphologies, physiologies and life history traits cause deterministic outcomes in intra- and interspecific interactions (Coomes & Grubb Reference COOMES and GRUBB2003, Peters Reference PETERS2003, Rees et al. Reference REES, CONDIT, CRAWLEY, PACALA and TILMAN2001, Uriarte et al. Reference URIARTE, CONDIT, CANHAN and HUBBELL2004) and habitat differentiation (Clark et al. Reference CLARK, CLARK and READ.1998, Davies et al. Reference DAVIES, PALMIOTTO, ASHTON, LEE and LAFRANKIE1998, Debski et al. Reference DEBSKI, BURSLEM, PALMIOTTO, LAFRANKIE, LEE and MANOKARAN2002, Harms et al. Reference HARMS, CONDIT, HUBBELL and FOSTER2001, Niiyama et al. Reference NIIYAMA, RAHMAN, IIDA, KIMURA, AZIZI and APPANAH1999, Russo et al. Reference RUSSO, DAVIES, KING and TAN2005, Svenning Reference SVENNING1999, Tuomisto & Ruokolainen Reference TUOMISTO and RUOKOLAINEN1993, Valencia et al. Reference VALENCIA, FOSTER, VILLA, CONDIT, SVENNING, HERNANDEZ, ROMOLEROUX, LOSOS, MAGARD and BALSLEV2004, Webb & Peart Reference WEBB and PEART2000). However, several studies argue that the deterministic mechanism accounts for only a portion of plant community structure (Debski et al. Reference DEBSKI, BURSLEM, PALMIOTTO, LAFRANKIE, LEE and MANOKARAN2002, Hubbell Reference HUBBELL2005, Valencia et al. Reference VALENCIA, FOSTER, VILLA, CONDIT, SVENNING, HERNANDEZ, ROMOLEROUX, LOSOS, MAGARD and BALSLEV2004).
In contrast, the neutral theory assumes that even when trait variations among species are ubiquitous, all individuals regardless of species are demographically equivalent in terms of rates of birth, death and reproduction (Hubbell Reference HUBBELL1979, Reference HUBBELL2005). Hubbell (Reference HUBBELL2005) stressed that interactions with heterogeneous biotic and abiotic micro-environments in a tropical forest would have no directed effect on individual performance. Thus, he anticipated that forest dynamics would involve a stochastic process operating on the individual scale. Uriarte et al. (Reference URIARTE, CONDIT, CANHAN and HUBBELL2004) illustrated this possibility by analysing 60 tree species on Barro Colorado Island, Panama, and found that the majority of species did not respond to neighbour identity. However, theoretical and empirical evidence have led to rejection of the assumption of demographic equivalence (reviewed in Chave Reference CHAVE2004). Because deterministic and stochastic mechanisms are not mutually exclusive, the relative importance of each in determining structures and dynamics of a plant community should be assessed (Ellwood et al. Reference ELLWOOD, MANICA and FOSTER2009, Harpole & Tilman Reference HARPOLE and TILMAN2006).
The pattern and scale of spatial associations between plant species reflect their interactions (Barot et al. Reference BAROT, GIGNOUX and MENAUT1999, Cole & Syms Reference COLE and SYMS1999, Dale Reference DALE1999, Dovčiak et al. Reference DOVČIAK, FRELICH and REICH2001, Pélissier Reference PÉLISSIER1998, Sterner et al. Reference STERNER, RIBIC and SCHATZ1986, Suzuki et al. Reference SUZUKI, KUDOH and KACHI2003, Reference SUZUKI, SUZUKI and KACHI2005). Debski et al. (Reference DEBSKI, BURSLEM, PALMIOTTO, LAFRANKIE, LEE and MANOKARAN2002) and Queenborough et al. (Reference QUEENBOROUGH, BURSLEM, GARWOOD and VALENCIA2007) demonstrated that pairwise species associations among species preferring the same habitat types were generally positive, but associations among species preferring different habitats showed negative patterns. Interspecific competition also leads to segregation patterns between two competing species (Seabloom et al. Reference SEABLOOM, BJORNSTAD, BOLKER and REICHMAN2005). Thus, spatial segregation patterns between species provide indirect evidence of interspecific competition and habitat differentiation. Based on these previous studies, we predicted that if spatial associations between two species shifted toward segregation patterns, then deterministic mechanisms, such as interspecific competition and habitat differentiation, would be expected to prevail among them. In contrast, if no directed change in spatial associations is observed between two species and, consequently, initial association patterns are retained through growth, then deterministic mechanisms would be expected to be less important; that is, the two species would be expected to experience weak interspecific competition and show no habitat preference. Non-directed associations may be caused by a stochastic mechanism, such as chance events (i.e. disturbance) and demographic equivalence.
To assess underlying mechanism(s) operating among species, we analysed spatial association patterns among 11 dipterocarp species at three growth stages in a 50-ha plot in Peninsular Malaysia. The 11 confamilial species show similar characteristics, such as being forest dominants, an emergent life form, evergreen leaves, dipterocarp fruit and leaf morphologies and limited seed dispersal. Our previous study (Suzuki et al. Reference SUZUKI, NUMATA, OKUDA, NUR SUPARDI and KACHI2009) revealed that these 11 dipterocarp species can be categorized into two classes. A fast-growing class (seven species) with high growth and mortality rates exhibited peaks in spatial aggregation at small distances (< 100 m) in the small tree stage, but this aggregation disappeared in the medium and large tree stages. These species showed spatial segregation between different growth stages and associations with various habitat types. In contrast, the slow-growing class (four species) with low growth and mortality rates aggregated at large distances (> 200 m) throughout the three growth stages in all except one species. They exhibited spatial independence between different growth stages and no habitat association except one species. These results suggested that fast-growing species are likely to suffer density-dependent mortality and habitat-dependent mortality whereas slow-growing species can establish in a wide range of habitat types and suffer few conspecific negative effects. Based on the results of our previous study, we predicted that the two growth-rate classes would exhibit different species association patterns: fast-growing species show shifts toward segregation patterns with species of the fast- and slow-growing classes due to severe interspecific competition and habitat differentiation, whereas slow-growing species exhibit no directed change in spatial associations with species of the same growth-rate class, because of weak competitive interactions and no habitat differentiation.
METHODS
Study site
We used data from a 50-ha plot established at Pasoh Forest Reserve (2°58′N, 102°18′E) in the state of Negeri Sembilan, Malaysia. The dominant vegetation type in the reserve is lowland dipterocarp forest, characterized by a high proportion of Dipterocarpaceae (Appanah & Weinland Reference APPANAH and WEINLAND1993).
The 50-ha permanent plot was censused by the Forest Research Institute Malaysia between 1985 and 1989 in the primary forest at Pasoh Forest Reserve. All woody plants of 1 cm dbh or larger within this plot were measured, identified, tagged with consecutive numbers, and mapped to the nearest 10 cm. The re-censuses of the vegetation have been carried out every 5 y since then. Methodologies used in plot establishment and the resulting database are described by Manokaran et al. (Reference MANOKARAN, LAFRANKIE, KOCHUMMEN, QUAH, KLAHN, ASHTON and HUBBELL1990). Total number of trees in the initial census was 335 240, consisting of 814 species, 290 genera and 78 families (Manokaran et al. Reference MANOKARAN, KASSIM, HASSAN, QUAH and CHONG1992). The area, where the study plot is located, is generally homogeneous, with no evidence of major disturbance, and it is likely to be representative of lowland forests on the south-central Malay Peninsula.
Study species
We used 11 dipterocarp species: Dipterocarpus cornutus Dyer, Neobalanocarpus heimii (King) P.S. Ashton, Shorea acuminata Dyer, Shorea bracteolata Dyer, Shorea leprosula Miq., Shorea lepidota (Korth.) Blume, Shorea macroptera Dyer, Shorea maxwelliana King, Shorea ovalis (Korth.) Blume, Shorea parvifolia Dyer. and Shorea pauciflora King. Except N. heimii, these species synchronize flowering and fruiting at intervals of several years (Ashton Reference ASHTON1988, Numata et al. Reference NUMATA, YASUDA, OKUDA, KACHI and NUR SUPARDI2003) and recruit their seedlings as a cohort (Ashton Reference ASHTON1988, Numata et al. Reference NUMATA, KACHI, OKUDA and MANOKARAN2004). Our previous study (Suzuki et al. Reference SUZUKI, NUMATA, OKUDA, NUR SUPARDI and KACHI2009) categorized the 11 species into two classes: Shorea leprosula, S. ovalis, S. lepidota, S. bracteolata, S. acuminata, S. parvifolia and S. pauciflora exhibited high growth and mortality rates, spatial aggregation on a small scale (< 100 m), and positive habitat associations (fast-growing class), while S. macroptera, N. heimii, S. maxwelliana and D. cornutus exhibited low growth and mortality rates, spatial aggregation on a large scale (> 200 m), and no habitat associations, with the exception of S. maxwelliana (slow-growing class).
Data analyses
Spatial associations between species. Spatial associations between dipterocarp species were analysed using Ripley's K 12(t) function. The K 12(t) function is a generalization of Ripley's K(t) function to a bivariate point process (Diggle Reference DIGGLE1983, Ripley Reference RIPLEY1977). K 12(t) is defined as the expected number of plants of species 1 within distance t from a randomly chosen plant of species 2. Under complete spatial independence K 12(t) = πt 2 (Diggle Reference DIGGLE1983, Haase Reference HAASE1995). When L 12(t) is defined as √(K 12(t)/π) – t, the expected value of L 12(t) is zero under complete spatial independence. L 12(t) was calculated at 5-m intervals up to 250 m. For each calculation, two functions can be computed with either species 1 or 2 as the first species. We therefore based our spatial association analyses on the empirical function K* computed as the mean of K 12 and K 21, weighted by the numbers of plants in the two species (Barot et al. Reference BAROT, GIGNOUX and MENAUT1999, Diggle Reference DIGGLE1983). The method tests whether the spatial relationship between the two species suggests spatial attraction, segregation or independence. The null hypothesis that spatial association between the two species is independent is tested by converting the plot to a torus, and then randomly translating one of the patterns in the x and y directions relative to the other (toroidal shift) (Diggle Reference DIGGLE1983).
The 95% confidence envelopes of L 12(t) function was estimated from 500 simulations by a random translation. When the observed L 12(t) values were larger or smaller than the envelopes of the expected L 12(t) under the null hypotheses, the spatial association (attraction/segregation) between the two species was statistically significant at the distance t, respectively.
The analysis of spatial associations of dipterocarp trees was based on the 1995 census. The growth stage of each species was distinguished on the basis of dbh, small trees (1 ≤ dbh < 10 cm), medium trees (10 ≤ dbh < 30 cm), and large trees (dbh ≥ 30 cm). The spatial associations of all possible combinations among identical stages (small trees vs. small trees, medium trees vs. medium trees, and large trees vs. large trees; 165 pairs) and among different stages (small trees vs. medium trees, small trees vs. large trees, and medium trees vs. large trees; 330 pairs) except between identical species were analysed.
Changes in associations with growth stage. We evaluated how spatial associations between a target species and a particular growth stage of another species change with the growth of the target species. There were three possible associations (attraction, segregation and independence) in each growth stage, and thus 27 combinations of spatial associations are possible through the three growth stages (three associations at the small-tree stage × three associations at the medium-tree stage × three associations at the large-tree stage). The 27 possible combinations can be classified into two disparate patterns: a constant association pattern in which the association (attraction, segregation or independence) between a target species and a particular growth stage of another species was conserved throughout the three growth stages of the target species (A as small tree × A as medium tree × A as large tree, i × i × i, and S × S × S combinations), or a transitional association pattern in which the association between a target species and a particular growth stage of another species changed with different growth stages of the target species. The transitional pattern can also be classified into three sub-patterns based on their directions: a change from attraction (A) or independence (i) at the small-tree and medium-tree stages to segregation (S) at the large-tree stage (A to S pattern, including A at small tree × A at medium tree × S at large tree, A × i × S, and i × i × S combinations); a change from segregation or independence at the small-tree and medium-tree stages to attraction at the large-tree stage (S to A pattern, including S × S × A, S × i × A and i × i × A combinations); and other multidirectional patterns. We compared proportions of these patterns between two growth-rate classes.
RESULTS
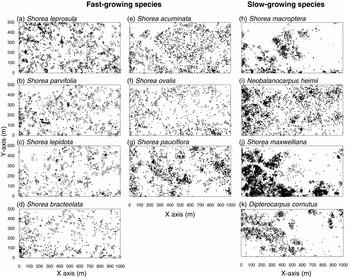
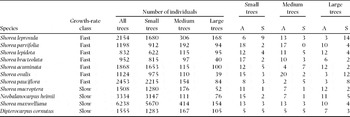
Spatial associations between species. Spatial distributions of the 11 species in the 50-ha plot are shown in Figure 1. The number of significant associations varied among the species. The number of attractions was highest for medium trees of S. ovalis and lowest for medium trees of S. pauciflora (Table 1). The number of segregations was highest for large trees of S. leprosula and lowest for medium trees of S. parvifolia (Table 1). Except for the large tree stage, the average number of attractions was higher for the fast-growing class (small trees, 13; medium trees, 11; large trees, 7) than the slow-growing class (small trees, 11; medium trees, 8; large trees, 10). The average number of segregations was also higher for the fast-growing class (small trees, 4; medium trees, 4; large trees, 7) than the slow-growing class (small trees, 3; medium trees, 3; large trees, 4), but there was no significant difference in number of attraction or segregation between the growth-rate classes. There was no significant correlation between number of individuals and significant associations at any of the three growth stages.
Spatial distributions of the 11 dipterocarp species in the 50-ha plot of Pasoh: Shorea leprosula (a), Shorea parvifolia (b), Shorea lepidota (c), Shorea bracteolata (d), Shorea acuminata (e), Shorea ovalis (f), Shorea pauciflora (g), Shorea macroptera (h), Neobalanocarpus heimii (i), Shorea maxwelliana (j) and Dipterocarpus cornutus (k). Size of symbols shows the difference of three growth stages that were distinguished on the basis of dbh, small trees (1 ≤ dbh < 10 cm), medium trees (10 ≤ dbh < 30 cm) and large trees (dbh ≥ 30 cm). The 11 species were classified into two growth-rate classes: the fast-growing class and slow-growing class. Distributions of fast-growing species (a–g); slow-growing species (h–k).

Growth-rate class, number of individuals and number of significant associations with other species for three growth stages. Species are arranged in descending order of mortality rates. Significant patterns were categorized as significant attraction (A) and significant segregation (S).

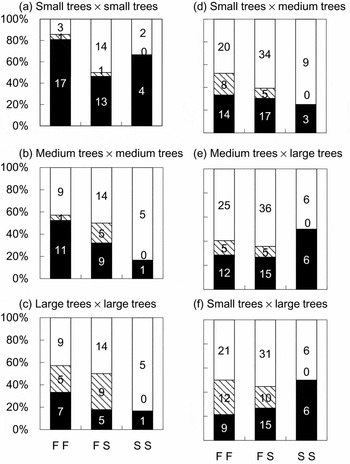
Spatial associations between different species varied with their growth stages. The proportion of significant attractions decreased with increasing growth stage (small trees × small trees, 61.8%; medium trees × medium trees, 38.2%; large trees × large trees, 23.6%). The proportion of significant segregations increased with increasing growth stage (small trees × small trees, 3.6%; medium trees × medium trees, 10.9%; large trees × large trees, 25.5%). Spatial associations between different growth stages of different species showed a larger number of attractions (small trees × medium trees, 30.9%; medium trees × large trees, 30.0%; large trees × small trees, 27.3%) rather than segregations (small trees × medium trees, 11.8%; medium trees × large trees, 9.1%; large trees × small trees, 20.0%).
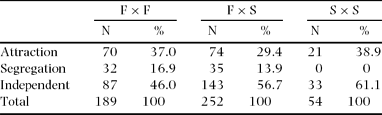
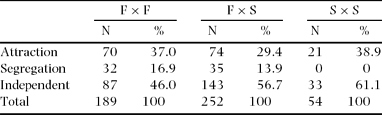
Significant attraction was commonly observed both between species classified into the same growth-rate class and between species of different growth-rate classes, although the proportion of attractions varied between growth-rate classes (Table 2). The proportion of attractions was lower between species of different growth-rate classes (F × S) than between species of the same growth-rate class (F × F or S × S, Table 2, Figure 2). Segregation was observed between species of the fast-growing class (F × F, 16.9%) and between different growth-rate classes (F × S, 13.9%) whereas no segregated association was observed between species of the slow-growing class (S × S, Table 2, Figure 2).
The number and proportions (%) of associations between species. The 11 dipterocarp species were classified into two growth-rate classes: the fast-growing class (F) and slow-growing class (S). The number and proportions of spatial associations between species belonging to the same classes (F × F or S × S) and between species belonging to the different classes (F × S) are shown. A statistically significant association indicates positive association (attraction) or negative association (segregation).
Spatial associations between two species: associations between small trees (a), medium trees (b), large trees (c) and associations between small and medium trees (d), between medium and large trees (e) and between small and large trees (f). The 11 dipterocarp species were classified into two growth-rate classes: the fast-growing class (F) and slow-growing class (S). Proportions of spatial association between species belonging to the same class (F F or S S) and of that between species belonging to the different classes (F S) are shown: significant attraction (black), significant segregation (slash line), and independent (white). Numerical values inside the graph display the number of actual pairs. The figures show each combination of three growth stages separately.

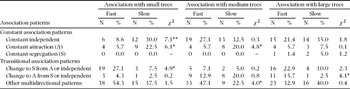
Changes in associations with growth stage. The slow-growing class had a larger proportion of constant association patterns across growth stages than the fast-growing class (the slow-growing class, 50.8%; the fast-growing class, 25.2% of all patterns). Some of those differences in the proportion of constant association patterns were statistically significant, such as constant attraction and constant independence patterns with small-tree and medium-tree stages of other species (chi-squared tests, Table 3). Transitional association patterns, however, were observed more for the fast-growing class (the slow-growing class, 49.2%; the fast-growing class, 74.8% of all patterns). In particular, the differences in the proportions of attraction to segregation patterns with small trees, segregation to association patterns with large trees, and other multidirectional patterns with medium trees of other species were statistically significant (chi-squared tests, Table 3).
The number (N) and proportions (%) of spatial association patterns through the three growth stages of 11 dipterocarp species with small trees, medium trees and large trees of other species. The difference in proportions of spatial association patterns between the two growth-rate classes was tested by the chi-square test (*: P < 0.05, **: P < 0.01). The 11 species were classified into two growth-rate classes: the fast-growing class (Fast) and slow-growing class (Slow). The spatial association patterns through growth stages were distinguished into two disparate patterns: a constant association pattern in which the association (attraction, segregation or random) between a target species and a particular growth stage of other species is conserved throughout the three growth stages of the target species, and a transitional association pattern in which the association between a target species and a particular growth stage of other species shifts with different growth stages of the target species.

DISCUSSION
This study revealed that segregations are observed between species of the fast-growing class and between different growth-rate classes, but not between species of the slow-growing class. We also demonstrated that through the progress of growth stages, association patterns with other species were mostly constant for the slow-growing class, but tended to change toward segregation for the fast-growing class. These results suggest that the differences in growth strategy among the 11 confamilial species were closely related to their spatial association patterns.
The spatial features of the fast-growing class shifted toward segregation from other species with tree growth. This spatial segregation suggests that deterministic mechanisms, such as interspecific competition and habitat differentiation, were dominant for fast-growing species. Plant competition occurs among neighbouring individuals (Mack & Harper Reference MACK and HARPER1977, Waller Reference WALLER1981, Watkinson et al. Reference WATKINSON, LONSDALE and FIRBANK1983, Weiner Reference WEINER1984). Neighbourhood competition generally causes regular spacing of individuals within a single species (Stoll & Bergius Reference STOLL and BERGIUS2005) and spatial segregation between competing species (Schurr et al. Reference SCHURR, BOSSDORF, MILTON and SCHUMACHER2004, Seabloom et al. Reference SEABLOOM, BJORNSTAD, BOLKER and REICHMAN2005). Spatial segregation is also observed between species preferring different habitats (Debski et al. Reference DEBSKI, BURSLEM, PALMIOTTO, LAFRANKIE, LEE and MANOKARAN2002, Queenborough et al. Reference QUEENBOROUGH, BURSLEM, GARWOOD and VALENCIA2007), because these species distribute in different habitat types each other. Faster-growing tree species often have lower wood density, fewer defensive materials (King et al. Reference KING, DAVIES and NUR SUPARDI2006) and greater resource (e.g. light, water, nutrients) requirements. Additionally, our previous study revealed that fast-growing species reduced spatial aggregation during their life cycle, perhaps because of density-dependent mortality as a result of high predation pressure and severe intraspecific competition (Suzuki et al. Reference SUZUKI, NUMATA, OKUDA, NUR SUPARDI and KACHI2009). Based on the characteristics of fast-growing species and the results of this study, we think that fast-growing species likely suffer severe interspecific competition because rapid growth inevitably leads to competition with intra- and interspecific neighbours, which, in turn, leads to spatial segregation between competing species.
In contrast, slow-growing species were largely attracted to each other, and showed no segregation. There was a larger number of constant spatial association patterns than translational association patterns for slow-growing species. Moreover, our previous study revealed that most slow-growing species showed no habitat preference (Suzuki et al. Reference SUZUKI, NUMATA, OKUDA, NUR SUPARDI and KACHI2009). The patterns shown by the slow-growing class, such as no habitat preference, no segregation, and constant association patterns, suggest a lack of directed effects on spatial distributions of slow-growing species. Our results do not indicate that no interspecific competition occurred among slow-growing species, but that slow-growing species would be relatively more influenced by stochastic random events, generating demographical equivalence, rather than deterministic interactions with local biotic and abiotic environments. Hubbell (Reference HUBBELL2005) also argued that species with slow growth and low mortality rates are likely to be functionally equivalent.
What mechanisms account for spatial associations between the fast- and slow-growing classes? Our results showed that the proportion of segregation between species of different classes was lower than that between fast-growing species (Table 2). The low proportion of segregation suggests that deterministic mechanisms may have operated weakly between species of different growth-rate classes relative to between species within the fast-growing class. Our results also demonstrated that segregations between medium trees and between large trees (Figure 2b, c) were more often observed between species of different growth-rate classes than between fast-growing species. These results suggest that the outcomes of competitive interaction and habitat differentiation between species of different growth-rate classes emerged in the later growth stages. Thus, our results suggest that interspecific competition and habitat differentiation are likely to operate between the fast- and slow-growing classes, especially in the later growth stages.
It is unclear what mechanism(s) is (are) accounting for changes in association patterns from segregation to attraction or independence and for multidirectional association patterns. Effects of species-specific herbivore pressure may cause a shift toward an attractive association through tree growth because individuals near individuals of a different species may experience less specific herbivory than those near conspecific individuals (Connell Reference CONNELL, den Boer and Gradwell1971, Harms et al. Reference HARMS, WRIGHT, CALDERON, HERNANDEZ and HERRE2000, Janzen Reference JANZEN1970). These effects were observed for dipterocarp species seedlings (Blundell & Peart Reference BLUNDELL and PEART2004). Similarity in habitat preference may also result in a shift toward an attractive association between species. Indeed, 14% (10 pairs) of attractions between species of the fast-growing class were observed for species pairs showing identical habitat associations (data not shown). The effects of habitat heterogeneity and interspecific interactions often vary with growth stage and interact with each other, which might contribute to multidirectional change in spatial association. Thus, it is necessary to develop statistical methods for detecting these effects separately (Schurr et al. Reference SCHURR, BOSSDORF, MILTON and SCHUMACHER2004, Suzuki et al. Reference SUZUKI, KUDOH and KACHI2003, Reference SUZUKI, SUZUKI and KACHI2005, Reference SUZUKI, NUMATA, OKUDA, NUR SUPARDI and KACHI2009).
The spatial association processes observed in this study may also explain coexistence between tree species in a forest. The spatial segregation between species is not only a consequence of interspecific competition and habitat differentiation, but also an important mechanism in preventing competitive exclusion (Chesson & Neuhauser Reference CHESSON and NEUHAUSER2002, Murrell et al. Reference MURRELL, PURVES and LAW200l, Rejmánek Reference REJMÁNEK2002, Stoll & Prati Reference STOLL and PRATI2001). Spatial competition theory predicts that strong neighbourhood competition and dispersal limitation result in sharing spatially subdivided habitats among species (i.e. interspecific segregation), and thus generate the stable coexistence of a potentially unlimited number of species on a single resource (Tilman Reference TILMAN1994). This suggests that interspecific segregation due to severe competition and habitat differentiation at earlier growth stages may reduce competitive interactions at later stages and contribute to their coexistence. On the other hand, the spatial characteristics of the slow-growing class, such as lack of spatial segregation and constant association patterns, suggest that neutral processes, by demographical equivalence, may maintain their coexistence (Hubbell Reference HUBBELL2005). Thus, our results suggest that the relative importance of deterministic and neutral processes to explain the coexistence of functionally similar species may change with their growth strategies.
In conclusion, this study demonstrated that the relative importance of deterministic and stochastic mechanisms to explain spatial association patterns of confamilial species depends on life-history strategies. Spatial structures and species coexistence in a plant community can be explained by interactions of deterministic mechanisms, such as habitat differentiation and interspecific competition, and neutral mechanisms, such as non-directed random effects of the biotic and abiotic micro-environments and stochastic disturbance.
ACKNOWLEDGEMENTS
The present study was part of a joint research project between the Forest Research Institute Malaysia and the Japanese National Institute for Environmental Studies (Grant No. E-4, Fiscal Year from 2002–2006, from the Global Environment Research Program, Environment Agency of Japan). The 50-ha forest plot in the Pasoh Forest Reserve is an ongoing project of the Malaysian Government, and was initiated by the Forest Research Institute Malaysia through its former Director-General, Dato’ Dr Salleh Mohd. Nor, and implemented under the leadership of N. Manokaran, Peter S. Ashton and Stephen P. Hubbell. Supplementary funding was provided by the National Science Foundation (USA); the Conservation, Food, and Health Foundation, Inc. (USA); the United Nations, through its Man and the Biosphere (MAB) programme; UNESCO-MAB grants; UNESCO-ROSTSEA; and the continuing support of the Smithsonian Tropical Research Institute (Barro Colorado Island, Panama), Harvard University and the Center for Global Environmental Research (CGER) at the National Institute for Environmental Studies (NIES), Japan. We thank the Ministry of Environment for permission to study plants in Malaysia. We thank a reviewer and the associate editor, Dr Ian Turner whose helpful comments significantly improved our manuscript.