1 Introduction
Our article is a retrospective review of the U.S. regulatory response to a major environmental catastrophe after an earthquake and tsunami struck the Daiichi I nuclear power facility in Fukushima Prefecture, Japan (henceforth, Fukushima) in 2011. Following Aldy and Viscusi (Reference Aldy and Viscusi2013) and Balleisen et al. (Reference Balleisen, Bennear, Krawiec and Jonathan2017) who argue for comprehensive assessments of the benefits and costs of the policy responses to major catastrophes, our primary goal was to assess the U.S. response related to food imports, a response different from those in much of the rest of the world and one not yet examined in the economic literature. We focused on U.S. import policy and Japanese fish and seafood, because at the time of the incident, fish and seafood constituted a high share of the economic value of Japanese exported food commodities and has been banned more often worldwide than other food commodities (ERS, 2018; Johnson, Reference Johnson2011).
A collection of relevant essays reviewing policy responses to catastrophes by Aldy and Viscusi (Reference Aldy and Viscusi2013) and Balleisen et al. (Reference Balleisen, Bennear, Krawiec and Jonathan2017) suggest that retrospective benefit-cost analyses should be at the heart of retrospective policy reviews. This literature suggests that retrospective reviews are useful in developing policy strategies for two closely related goals: (i) learning to prepare for crises and (ii) preparing to learn from crises. Bennear (Reference Bennear, Belleisen, Bennear, Krawiec and Wiener2017) coined the term "policy regret" to define the phenomenon where a chosen policy response was insufficient for the crisis. This is evident from the catastrophic events such as Hurricane Katrina, the Deepwater Horizon oil spill, and the Financial Crisis of 2008. With a comprehensive retrospective benefit-cost review, we assessed whether valuable lessons could be learned from the U.S. import policy response to Fukushima and showed benefit-cost analysis to be a useful framework for assessing policy responses to catastrophes more generally. We addressed the question of whether the U.S. response was adequate or whether a systemic problem identified by evaluating the net social costs might have been reduced with another policy response. Our second goal was to demonstrate the practical application of a partial equilibrium trade model, the modified Global Simulation Model (GSIM), to evaluate a real-world policy response to a catastrophe.
The impact of food safety regulations on trade, especially temporary catastrophe-related regulations, is not often examined in the economic literature. Policymakers more often rely on theoretical literature because the empirical literature often fails to provide estimates of the potential magnitudes of benefits and costs of various policy options. Our contribution to the economic literature is in examining the impact of the Fukushima incident on U.S.-Japanese trade in fish and seafood; in evaluating retrospectively the effectiveness of the U.S. regulatory response, and in discussing general lessons learned. We measured such effectiveness by the change in consumer and producer surplus from possible price changes caused by a foregone hypothetical ban, discussed food safety risks, and used the adapted partial equilibrium log-linear GSIM developed by Francois and Hall (Francois & Hall, Reference Francois, Hall, Francois and Reinerts1997, Reference Francois and Hall2003; Francois, Reference Francois2009) to model this alternative response scenario.
The U.S. Food and Drug Administration (FDA), along with other federal regulatory agencies, is responsible for protecting the health of U.S. consumers by assuring the safety of foods entering the country. All incoming shipments of FDA-regulated products that are sold to U.S. consumers must comply with the same standards as those for domestic products. FDA under the authority of the Food, Drug, and Cosmetic Act determines whether products are admissible into U.S. commerce. FDA can refuse entry to, or ban, any products that violate or appear to violate provisions of the Act, as well as those that may be contaminated.
Ensuring the safety of foods imported from Japan following the nuclear meltdown and the resulting widespread waterborne radiological contamination presented the world with a unique challenge. The Fukushima accident caused significant amounts of radioactive isotopes of iodine and cesium to be released into the land, atmosphere, and ocean (WHO, 2012), with the resulting exposure to the environmental contamination having the potential to be a significant human health hazard. Internal exposure by foods contaminated with radioactive iodine and/or cesium was the most likely route of human exposure to ionizing radiation.
According to the U.S. Agency for Toxic Substances and Disease Registry (ATSDR, 2004, 2005) the ionizing radiation emitted from cesium and iodine are thought to have carcinogenic effects. The thyroid gland receives the highest radiation dose of any organ or tissue following an internal exposure to radioiodine, and chronic exposure can cause nodules or cancer, making cancer of the thyroid gland a major health concern associated with radioiodine exposures. Low radiation doses can also reduce thyroid activity, lowering hormone production in the gland. This lower-dose exposure is of particular concern in children, whose smaller thyroid glands and other developmental factors make them highly vulnerable to radioiodine toxicity (ATSDR, 2004, 2005; Hamada & Ogino, Reference Hamada and Ogino2012).
The Fukushima incident triggered global concerns about the safety of Japanese seafood and impacted trade. Before Fukushima, fish and seafood exports accounted for approximately 28 % of all Japanese agricultural exports, playing the largest role in Japanese agricultural trade (Johnson, Reference Johnson2011, p. 2). According to United Nations Comtrade (UN Comtrade) trade data, in 2010 Japan received approximately $1.7 billion a year from its fish and seafood exports; in 2013, those exports fell almost 40 % (UN, 2014). Following Fukushima, most of Japan’s largest trade partnersFootnote 1 – China, Russia, India, Taiwan, South Korea, Singapore, and Australia – adopted a complete, although temporary, ban on food commodities derived from the six prefectures surrounding Fukushima Prefecture, along with a complete, although temporary, ban on Japanese fish and seafood imports (Blair, Reference Blair2011; Jacobs, Reference Jacobs2011; Gaylican, Reference Gaylican2011). Consistent with its risk-based approach, the U.S. response was – and remains – active monitoring and testing of imported food commodities from Japan for radionuclides. The USA also issued an import alert involving 14 prefectures that allowed the detention without warning of certain suspect food commodities (FDA, 2011, 2014a).
Our article is organized as follows. In the next section, we provide the background and a short overview of the nuclear disaster at Fukushima and its impact on foods produced in the affected area, including fish and other seafood. In Section 2, we describe in more detail the U.S. response to the Fukushima incident. In Section 3, we describe our trade impact model, our data sources, and limitations. In Section 4, we discuss the net change in consumer welfare consequent to the U.S. response by assessing the economic impact of an alternative counterfactual policy response, namely, a ban on imported fish and seafood commodities from Japan. The article concludes with a discussion of the effectiveness of the U.S. response and general lessons learned from the Fukushima catastrophe.
2 The Fukushima incident and its impact on Japanese food commodities
Japan was struck on March 11, 2011, by the largest known earthquake in its history and the world’s fourth largest in the last 100 years, with a recorded magnitude of 9.0. The underwater earthquake caused the largest tsunami in recorded Japanese history, with waves reaching run-up heights (how far the wave surges inland above sea level) of 133 feet that traveled over six miles inland; with waves of up to 70 feet high hitting the shore (The Asahi Shimbun, 2012). The hypocenter was at an underwater depth of approximately 15 miles, and the epicenter was approximately 80 miles from Oshika Peninsular (Hamada & Ogino, Reference Hamada and Ogino2012). Tsunami breakwater walls at Fukushima nuclear reactors located in the towns of Okuma and Futaba were designed to withstand tsunamis of less than 20 feet (Tokyo Electric Power Company, 2012). The enormity of the tsunami, which produced waves of 43 feet at the nuclear site, disabled multiple cooling systems, caused the meltdown of three of the six nuclear reactors, and severely damaged a fourth, which in turn produced overheating and hydrogen explosions (Tokyo Electric Power Company, 2012).
Environmental contamination from the Fukushima incident was catastrophic. Radioactive substances were released into the land, atmosphere, and ocean. The Nuclear Safety Commission of Japan estimated that the radiological contamination emitted into the atmosphere within the first month was 160 petabecquerelsFootnote 2 (PBq) of I-131, 18 PBq of Cs-134, and 15 PBq of Cs-137 (Hamada & Ogino, Reference Hamada and Ogino2012). Airborne radionuclide contamination spread across the entire northern hemisphere; radionuclide contamination was also released into the Pacific Ocean. According to Buesseler (Reference Buesseler2012), as much as 80% of the total radionuclide contamination may have entered the ocean, from the water that was used to cool the site’s reactors, from river runoff, or from atmospheric emissions precipitating over the ocean. Although difficult to estimate because of the accidental nature of the release, the total amount of the radionuclide contamination was the known single largest emission into the oceans caused by humans (du Bois, et al., Reference Bois, Laguionie, Boust, Korsakissok, Didier and Fiévet2012; Tabuchi, Reference Tabuchi2012). The Tokyo Electric Power Company estimated a release of 520 m3 of water containing harmful radionuclides in just the first month (Tokyo Electric Power Company, 2011).
Immediate devastation by the earthquake and the tsunami led to the confirmed loss of 15,892 lives and another 2574 persons who were still missing months later, injuries to 6152 people, and unprecedented devastation of the surrounding towns and villages (National Police Agency of Japan, 2015). The surrounding population within a 12.4-mile radius of the power plant was evacuated, and the population within 18.6 miles was kept in temporary shelter for months after the incident, with additional relocation areas added later (WHO, 2012). Approximately 470,000 people had to be evacuated within days after the accident (Yamauchi, Reference Yamauchi2012). Japan’s Prime Minister declared a nuclear emergency shortly after the earthquake was recorded and became the head of Nuclear Emergency Response Headquarters (Berends & Kobayashi, Reference Berends and Kobayashi2012).
Reports detecting Cs-134 and Cs-137 in waters up to 370 miles offshore indicated significant contamination of the surrounding ocean (Buesseler et al., Reference Buesseler, Jayne, Fisher, Rypina, Baumann, Baumann and Breier2012). Monitored marine organisms in the waters off Japan were found to have elevated cesium isotopes that were 10-1000 times over baseline levels prior to the accident. Though the radiation risks due to these radionuclides were below those generally considered harmful to marine animals and humans, their capture in distant waters demonstrated widespread contamination (Buesseler et al., Reference Buesseler, Jayne, Fisher, Rypina, Baumann, Baumann and Breier2012). Approximately, 1 year after the meltdown, some marine life, including cherry salmon, rockfish, flounder, sea urchin, and sea bass, were found to be contaminated (Berends & Kobayashi, Reference Berends and Kobayashi2012).
Other locally produced food was significantly contaminated by the dispersed radionuclides. Within days of the incident, food products grown in the Fukushima vicinity were detected with higher than permissible levels of radiation (MHLW, 2011; Berends & Kobayashi, Reference Berends and Kobayashi2012). The first contamination was discovered in raw milk samples, probably from contaminated grass used as feed for dairy cows. The first distribution and consumption restrictions were placed on leafy greens, such as spinach, komatsuna, and cabbage, and on flower-head brassicas such as broccoli and cauliflower (Department of Food Safety of Japan, 2011). Over the next year, 85 different foods were discovered to be contaminated, including bamboo shoots, cabbage, parsley, seaweed, kiwi fruit, wasabi, raw milk, beef, boar, deer, bear and copper pheasant meat, and tea (Berends & Kobayashi, Reference Berends and Kobayashi2012). The impact on Japanese domestic food production, especially in the prefectures surrounding Fukushima Prefecture, was believed to be potentially catastrophic.
Immediately following the disaster, the Japanese government and the prefectural governments started emergency monitoring for radioactivity to assess the environmental damage (Hirose, Reference Hirose2011). The Japanese government also established regulatory provisions for limits on radioactivity levels in food products; for seafood, the regulations included distribution restrictions and guidelines for conducting extensive monitoring of food and feed products (Berends & Kobayashi, Reference Berends and Kobayashi2012; Hamada & Ogino, Reference Hamada and Ogino2012; MHLW, 2014a). These limits and evaluation standards were revised in April of 2012, and some remain in place (MHLW, 2011, 2012a, 2012b, 2012c). Different limits were set for different food categories. The limit for fish and seafood was set at 100 Bq/kg. Extensive testing conducted in 2011, the first year after the disaster, revealed an elevated level of radionuclide contamination in multiple food products (Tabuchi, Reference Tabuchi2011). According to Japan’s Ministry of Health, Labor and Welfare, during the first 3 years after the disaster 676,686 food samples were collected and tested for radionuclide contamination, with an annual violation rate of less than 1 % during that time (MHLW, 2014a). Specific types of fish and seafood products from areas impacted by the Fukushima incident remained under distribution and consumption restrictions (MHLW, 2014b, 2014a) and continued to be tested (Tokyo Electric Power Company, 2013).
A study examining Japanese demand for specific domestic seafood products after Fukushima found that the level of radioactive contamination indeed reduced demand for both cod and pollock, but world price changes for those seafood products were negligible (Wakamatsu & Miyata, Reference Wakamatsu and Miyata2015). Wakamatsu and Miyata (Reference Wakamatsu and Miyata2015) note that the Fisheries Agency of Japan provided risk information and encouraged Japanese consumers to avoid a domestic boycott of Japanese seafood from the north Pacific Ocean, lessening the impact of public anxiety about the hazards associated with domestic seafood, and keeping demand from falling further.
3 U.S. response to the threat of imports contaminated with radionuclides following the Fukushima incident
The USA responded to the threat of radionuclide-contaminated foods in three ways. The first response was FDA’s monitoring of information and data from Japan, other foreign governments, and international organizations and engagement in consultations with government-wide and private-sector public health experts. From those consultations and monitoring, the USA judged that Japanese seafood would not present a significant hazard to public health due to several factors: little or no fishing took place in the area around the devastated reactors, and water acted as a safeguard against airborne contaminants that might settle on the ocean surface, mitigating the impact of the contamination. Contaminants released directly into the water near Fukushima or from river runoff would be diluted and dispersed at very slight levels (FDA, 2014a).
As the second response, the USAFootnote 3 screened and tested domestic and imported foods for the radionuclides cesium and iodine, along with Strontium-90, Ruthenium-103 (Ru-103), and Ruthenium-106 (Ru-106). This screening for radiological contamination was conducted by or with guidance from the FDA’s Food Emergency Response Network, its radiological laboratory, and several state laboratories. Footnote 4 The USA, in consultation with government and international food safety and radiological health experts, determined that the radionuclides of most concern were radioactive iodine I-131, with a half-life of 8.02 days; cesium Cs-134, with a half-life of 2.06 years; and cesium Cs-137, with a half-life of 30.17 years. The U.S. concern was twofold: (i) imported foods potentially contaminated with these radionuclides comprised a sufficient percentage of a person’s diet and (ii) infants and children would be among the at-risk populations if exposed to those contaminants (FDA, 2014a, 2005).
The USA screened and tested imported food samples labeled as having originated in Japan or having passed through Japan in transit. FDA has tested 1345 imported food samples, of which 225 samples were seafood or seafood products, during the first 3 years after the incident. FDA reported that two of those samples were found to contain detectable levels of cesium, but the levels were well below the levels of concern. The weighted average cost of physically inspecting or sampling food that was imported or offered for import into the USA in response to the Fukushima disaster was approximately $240 per field exam and $2800 per analyzed sample. We estimated the total costFootnote 5 of conducting seafood sampling from Japan during the years of concern to be approximately $700,000 (FDA, 2013). Through its annual Total Diet Study (Market Basket survey), the FDA also screened and tested domestic foods that might have become contaminated, perhaps because they might have food ingredients of Japanese origin (FDA, 2014c). FDA tested approximately 1500 samples of a variety of food products, including six seafood or seafood products, and did not detect any contamination (FDA, 2014a, 2014b).
As the third response, the USA, through the FDA, introduced an import alert on March 23, 2011, allowing FDA to detain without physical examination certain foods from the affected prefectures (FDA, 2011). Updates and revisions to the import alert added foods that were restricted from distribution and/or consumption by the Japanese government. Various seafoods from several prefectures were included in the list of restricted foods.Footnote 6 Of the 113,993 fish shipments entered from Japan in 2013, FDA detained 45 shipments, or less than 0.04 %. As of 2019, the USA continues to restrict the entry of products restricted by the Japanese government and enforces the prohibition through FDA Import Alert 99-33.
4 Trade impact model and data sources
4.1 The model
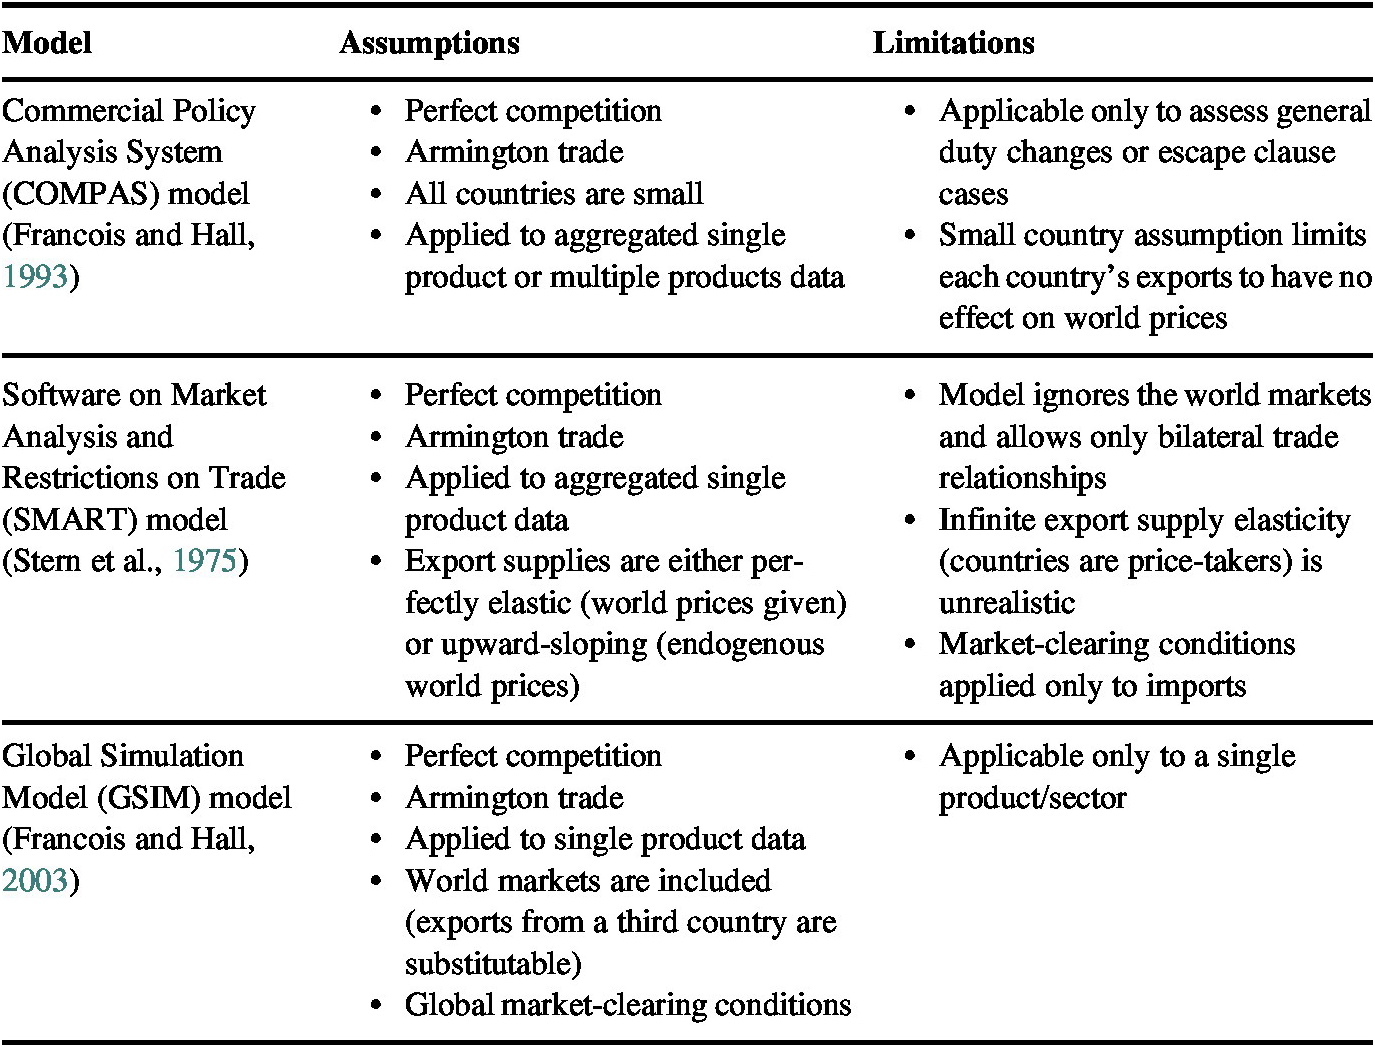
Because the U.S. policy response was to assess the imports for radiologic contaminants and to allow seafood imports from Japan when an alternative policy choice could have been a ban, it is important to assess the impact of the U.S. policy on trade. There are several well-established trade models that practitioners can adapt to assess trade impacts in the time of crisis or after the crisis. A comparison of key features of such partial equilibrium comparative-static trade models is provided in Table 1. After an extensive review of the literature on applied international trade modeling, our trade impact model was derived directly from the partial equilibrium log-linear GSIM (Francois & Hall, Reference Francois and Hall2003; Francois, Reference Francois2009).
Key features of partial equilibrium trade models.

In comparison to the Software on Market Analysis and Restrictions on Trade (SMART) (Stern et al., Reference Stern, Francis and Schumacher1975) and Commercial Policy Analysis System (COMPAS) models (Francois and Hall, Reference Francois and Hall1993), the GSIM offers many advantages (Table 1). The GSIM allows for multicountry modeling, utilizes bilateral trade and tariff data, and captures welfare effects of policies implemented at the national and global levels. In the GSIM, analysis can be focused only on the countries of interest, and all other countries with no expected policy relevance can be aggregated. The GSIM can simultaneously analyze impacts of policy changes on trade in domestic and foreign markets. In comparison to competing models, the GSIM is more flexible in allowing for disaggregated sector-specific analysis within a global framework. It also helps in predicting self-sufficiency, a critical policy issue in food markets.
The GSIM more closely deals with the intraindustry trade in goods like, in our case, seafood. It also allows for disaggregated sector-specific analysis while maintaining a global scope, incorporates third-country effects, and does not require making a “small country” assumption or the use of firm-level data that are typically protected trade secrets. We extended the GSIMFootnote 7 to examine the impact of a complete ban on imported seafood from Japan. Our analysis required three types of elasticities: the aggregate import demand elasticity, the aggregate export supply elasticity, and the elasticities of substitutions. For our estimates of these elasticities, we relied on published literature and data sources as described in Section 3.2.
An additional critical assumption of our analysis was that imported varieties of seafood are imperfect substitutes for other foreign and domestically grown seafood varieties. This assumption is derived from the Armington assumption of imperfect substitution (Armington, Reference Armington1969), which assumes that consumers view imported varieties of a product as imperfect substitutes for the domestic variety of that product. The Armington assumption helps explain intraindustry trade in seafood between Japan and the USA. Although seafood is differentiated by country of origin, we assume the similarity of seafood from different countries can be measured by a constant elasticity of substitution (CES)Footnote 8. When domestic and imported goods are imperfect substitutes, the domestic absorption consists of demand for an aggregate of the domestic and imported varieties; the mix is determined by the degree of substitutability between them. If this degree of substitutability, called Armington elasticity, is high, then purchasers treat domestic and imported varieties as virtually identical. A low Armington elasticity indicates weak substitutability between the imported and domestic varieties. Thus, by using the GSIM with the embedded Armington assumption, we generated smaller and more realistic trade responses to price changes than we would have with models of homogeneous products.
The following are the eight core equations of the model that include price linkages (Equations (1) and (2)), domestic supply and demand for domestically produced product varieties (Equations (3) and (4)), import supply and demand for different product varieties (Equations (5) and (6)), and the initial market-clearing conditions (Equations (7) and (8)). The log-linear functional form of the model reduces the computational complexity because it rules out corner solutions. The price that each exporter faces on its exports to a destination country v consists of a world price for exporter’s country variety and a tariff t that a destination country v imposes on imports from that exporting country (Equation (1)). In our model, countries do not subsidize prices for domestic varieties. Hence, the price for a domestically produced variety of a product equals the world price for that country’s variety (Equation (2)).
 $$ {P}_{vr}={P}_r^{\ast}\left(1+{t}_{vr}\right),\forall v,r\ and\ v\ne r $$
 $$ {P}_{vv}={P}_v^{\ast },\forall v $$
where the second subscript (typically r) refers to the origin country and the first subscript (typically v) refers to the destination country. Export (FOB, or world) prices are denoted with the asterisk, for example,  $ {P}_r^{\ast } $
is the world price of product variety from country r;
 $ {P}_{vr} $
is the price of a product in country v imported from country r;
 $ {P}_{vv} $
is the price for a domestically-produced variety of product in country v;
 $ {t}_{vr} $
is the tariff or ban imposed by country v on a variety of products from country r.
The domestic supply for domestic consumption is a function of the world price for domestic variety (Equation (3)). It represents the supply for domestic absorption, which is the difference between the total domestic production of product and its export. In each country, the demand for domestic variety of a product is a stylized function of prices for domestic and all imported varietiesFootnote 9 (Equation (4)).
 $$ \ln {Q}_v^S={K}_v^S+{\varepsilon}_v^S\ln {P}_v^{\ast}\kern0.5em ,\forall v $$
 $$ \ln {Q}_{vv}^D={K}_v^D+{\varepsilon}_{(v) vv}^D\ln {P}_{vv}+\sum_{r\ne v}{\varepsilon}_{(v) vr}^D\ln {P}_{vr},\forall v $$
where the superscripts D and S refer to demand and supply, respectively; P denotes price; Q denotes quantity; K is a constant;  $ {\varepsilon}_v^S $
is the elasticity of domestic supply of product in country v;
 $ {\varepsilon}_{(v) vv}^D $
denotes own-price elasticities of demand for domestic variety of product; and
 $ {\varepsilon}_{(v) vr}^D $
are the total uncompensated cross-price elasticities of demand between domestic variety v and varieties from all other countries.
The import-export market is modeled using Equations (5) and (6). In our model, any country can be both an origin and a destination country. Each country, therefore, produces some quantity of product for export. The exported amount is a function of the world price for that country’s variety of product (Equation (5)). At the same time, each country also demands imported varieties of product from all other countries. The demand of each variety imported by country v, for example, depends on the price that a given imported variety faces in country v, and on prices that all other varieties of this product face in country v (Equation (6)).
 $$ \ln {Q}_r^S={K}_r^S+{\varepsilon}_r^S\ln {P}_r^{\ast },\forall r $$
 $$ \ln {Q}_{vr}^D={K}_r^D+{\varepsilon}_{(v) rr}^D\ln {P}_{vr}+\sum_{s\ne r}{\varepsilon}_{(v) rs}^D\ln {P}_{vs},\forall v,r\ and\ v\ne r $$
where  $ {\varepsilon}_r^S $
is the elasticity of export supply for country r;
 $ {\varepsilon}_{(v) rr}^D $
are the own-price elasticities of demand; and
 $ {\varepsilon}_{(v) rs}^D $
are the total uncompensated cross-price elasticities of demand among all other varieties on the market in country v. Footnote 10
In the original equilibrium state, the demand for a domestic variety in each country is met by its domestic supply for domestic market (Equation (7)). At the same time, for each product variety, its import demand is met by import supply – the total amount that a country of that variety exports (Equation (8)).
 $$ {Q}_v^S={Q}_{vv}^D,\forall v $$
 $$ {Q}_r^S=\sum_v{Q}_{vr}^D,\forall v,r\ and\ v\ne r $$
After the ban is introduced, the global market-clearing condition would imply that for any given variety r of the product, the change in demand, including import and domestic demand, must be met by the change in supply by this origin country r (Equation (9)).
 $$ {\hat{Q}}_r^S={\hat{Q}}_r^D=\sum_v{\hat{Q}}_{vr}^D,\forall r $$
Differentiating Equations (3)–(6) and incorporating them into Equation (9) gives Equation (10), a global market-clearing condition. For a given product variety, the global market-clearing condition, therefore, is that the change in the sum of all import demands and domestic demand equals the change in supply by that country. In the case of Japanese seafood, the global market-clearing condition occurs when the net change in each country’s demand for Japanese seafood, including Japan’s own demand, has been met by a change in the supply of Japanese seafood (Equations (9) and (10)).
 $$ {\varepsilon}_r^S{\hat{P}}_r^{\ast }=\sum_v{\varepsilon}_{(v) rr}^D\left({\hat{P}}_r^{\ast }+{\hat{T}}_{vr}\right)+\sum_v\sum_{s\ne r}{\varepsilon}_{(v) rs}^D\left({\hat{P}}_s^{\ast }+{\hat{T}}_{vs}\right),\forall r $$
where  $ {T}_{vr}=\left(1+{t}_{vr}\right) $
denotes a price markupFootnote 11 that is achieved by imposing a ban
 $ {t}_{vr} $
by country v on a variety from country r and caret
 $ \hat{\square} $
represents proportional (percentage) change, so that
 $ \hat{x}=\frac{dx}{x} $
.
Following Francois and Hall (Reference Francois and Hall2003), the change in producer surplus (dPS) is calculated using the following formula:
 $$ dPS={R}_r^0{\hat{P}}_r^{\ast}\left(1+\frac{\varepsilon_r^S{\hat{P}}_r^{\ast }}{2}\right) $$
where  $ {R}_r^0 $
are the benchmark export revenues of country r valued at export prices and
 $ {\hat{P}}_r^{\ast } $
is the proportional change in the export (FOB, or world) price of the good from country r. The formula for calculating the change in consumer surplus (dCS) also comes from Francois and Hall (Reference Francois and Hall2003) (Equation (12)):
 $$ dCS=\left({\sum}_r{R}_{vr}^0{T}_{vr}^0\right)\left(\frac{1}{2}{E}_{M(v)}{\hat{P}}_{(v)}^2\left(\mathit{\operatorname{sign}}{\hat{P}}_{(v)}\right)-{\hat{P}}_{(v)}\right) $$
where $ \left({R}_{vr}^0{T}_{vr}^0\right) $
is the initial expenditure by country v at initial prices on product from country r;
 $ {E}_{M(v)} $
is the aggregate (composite) import demand elasticity for this product in country v with respect to the industry price;
 $ {\hat{P}}_{(v)} $
is the proportional change in the aggregated price for composite imports of this product in country v, which can be positive or negative;
 $ \mathit{\operatorname{sign}}{\hat{P}}_{(v)} $
reflects the direction of a proportional change in the aggregated price for composite imports of product in country v.
For each country, the changes in producer and consumer surplusesFootnote 12 for each variety of product are estimated as changes in the areas under the import supply and import demand curves, respectively. The total change in consumer surplus in country v, for example, is a weighted sum of all changes in the areas under demand curves for each variety of product consumed in country v. For each importing country v, these changes are estimated using the aggregate composite price in country v; the weights in Equation (12) represent initial expenditure shares by country v on each variety of product consumed in this country. The total change in producer surplus in each country is estimated as the change in export revenues caused by the change in the export price of that country’s variety of this product on the world market.
The aggregate price for composite imports  ${P}_{(v)} $
is a weighted average of prices for different imported varieties of this product in destination country v. We use the composite demand curve instead of the individual varietal demand curves because individual demand curves will shift as a reaction to changes in the price of another variety (price of a substitute) or total expenditure on this product. This makes it difficult to compute consumer surplus using the individual varietal demand curves. Because we hold all other prices and expenditure constant, the composite demand curve will not shift, enabling us to compute the consumer surplus. The proportional change in price for composite imports from Equation (12) is estimated using Equation (13):
 $$ {\hat{P}}_{(v)}=\sum_r{\theta}_{vr}\left({\hat{P}}_r^{\ast }+{\hat{T}}_{vr}\right),\forall v $$
where  $ {\theta}_{vr} $
are the demand expenditure shares at internal prices for product variety from country r by country v (Equation (14)):
 $$ {\theta}_{vr}=\frac{Q_{vr}^D{T}_{vr}}{\sum_s\left({Q}_{vs}^D{T}_{vs}\right)},\forall v $$
To estimate the total trade impact, the model first calibrates demand expenditure shares (Equation (14)) and estimates own- and cross-price elasticities of demand using the aggregate elasticity measures and the elasticity of substitution borrowed from the economics literature. Next, for all countries at the same time, it solves for the proportional (percentage) change in export and domestic prices after a ban (Equation (10)), so that the global market clears. Once the percentage change in prices is obtained, the model solves backward for export and import quantities (Equations (5) and (6)), the change in composite prices (Equation (13)) and the changes in consumer and producer surplus (Equations (11) and (12)).
4.2 Data sources
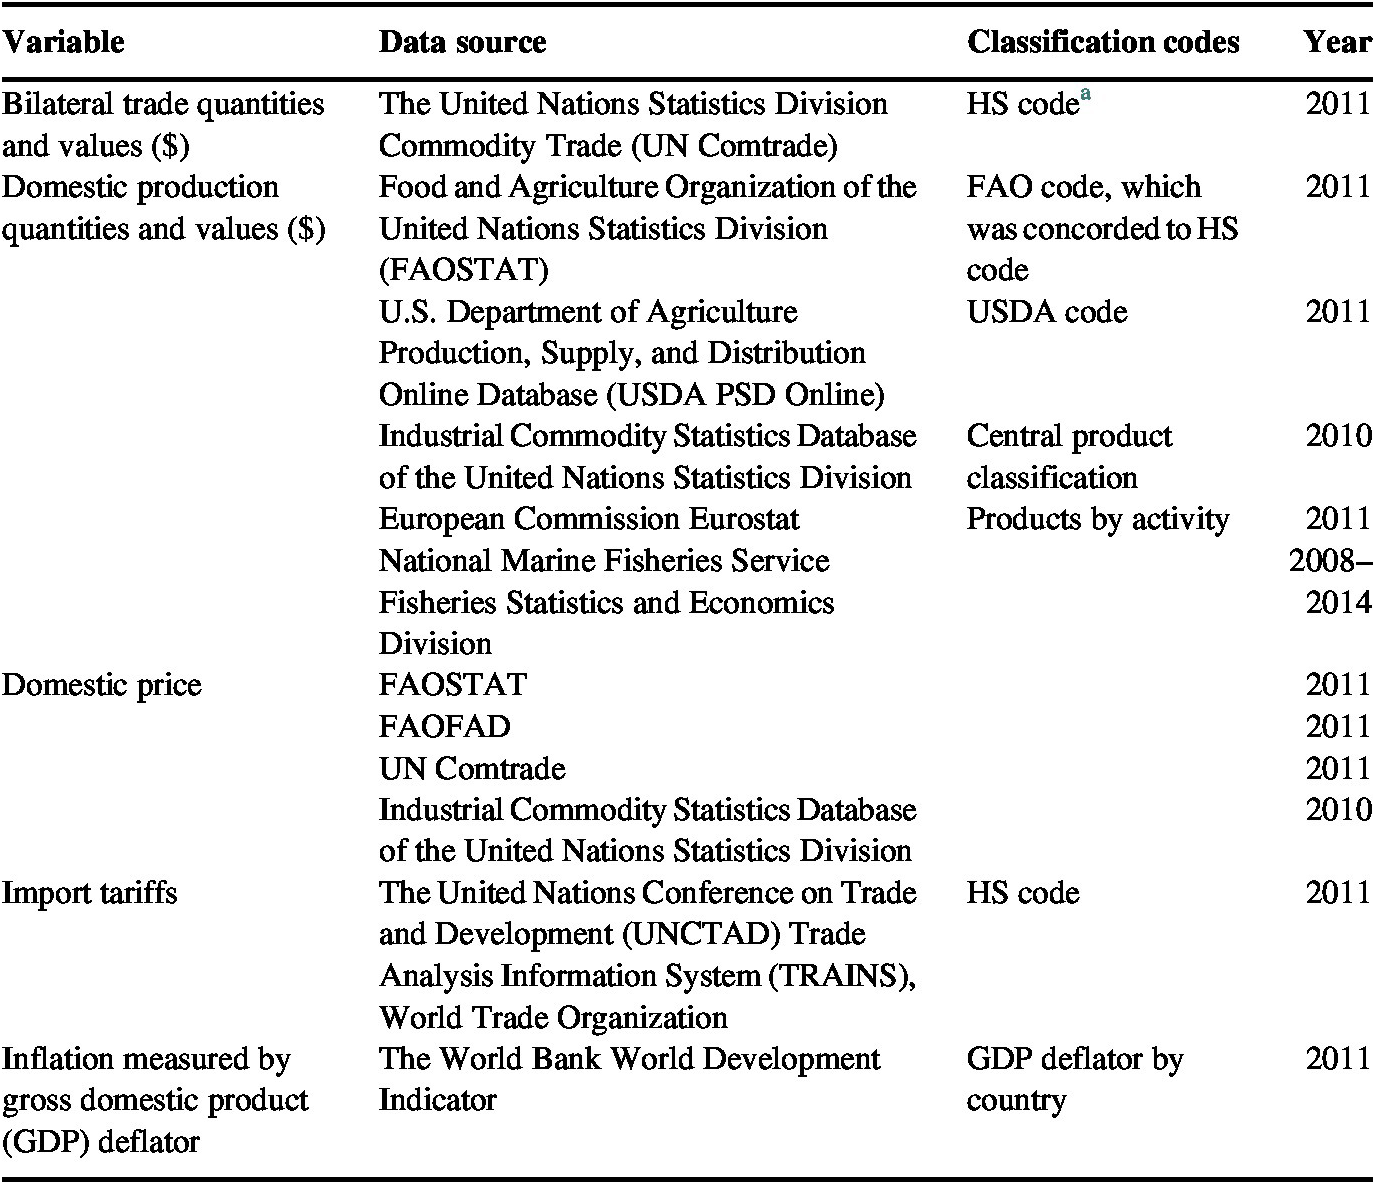
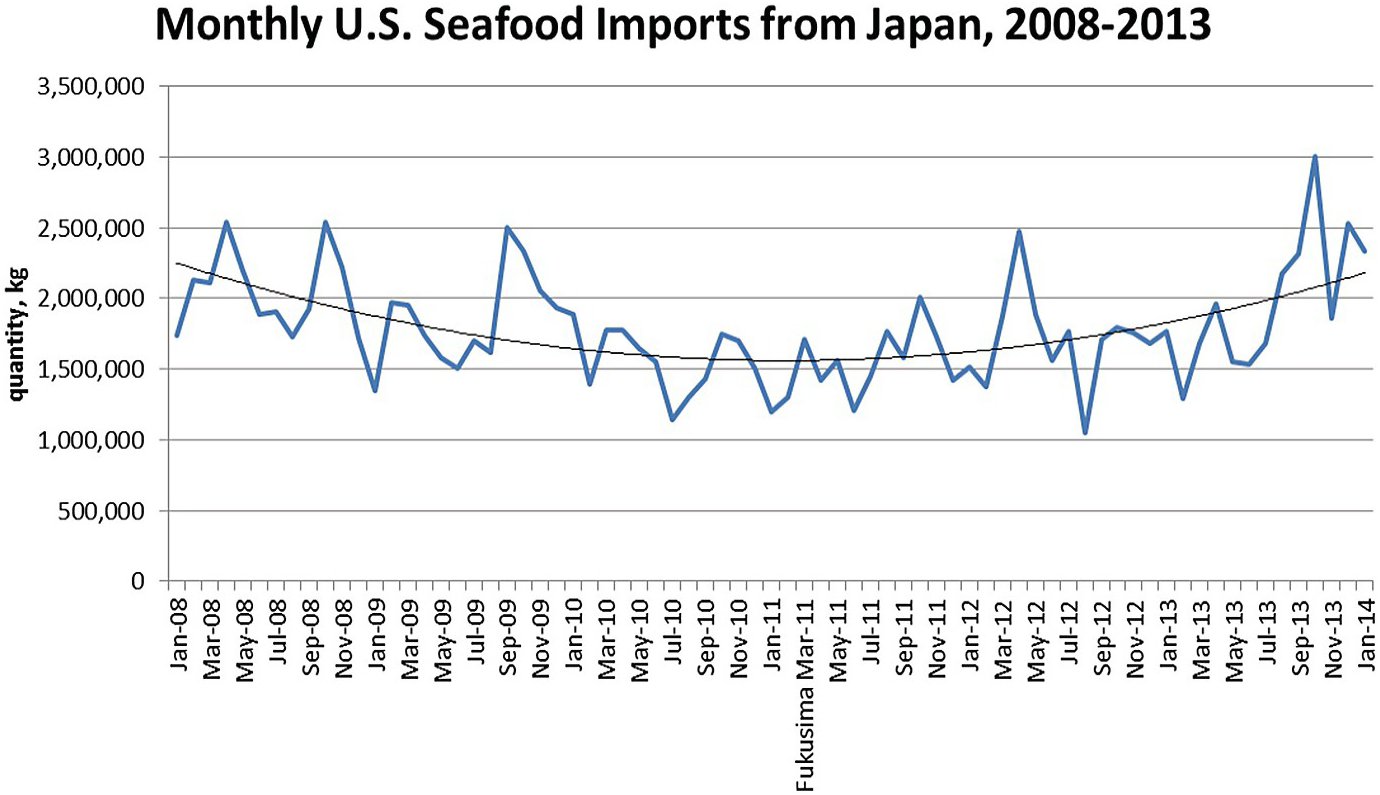
As shown in Table 2, we used several data sources to evaluate the impact of the Fukushima incident on changes in bilateral trade values and prices for the fish and seafood commodities under evaluation. To assess changes in the volume of Japanese fish and seafood products imported before and after the incident, we examined data from the National Marine Fisheries Service’s Fisheries Statistics and Economics Division from January 2008 to January 2014 (NMFS, 2014). For several variables of our model, we used multiple sources and harmonized them by HS and NAICS codes.Footnote 13 Our first set of data sources was for bilateral trade flows obtained from the UN Comtrade database for 2011 (UN, 2014). The aggregate HS code 03 (“Fish and crustaceans, mollusks and other aquatic invertebrates”) was used for our analysis. The second set of data is for domestic prices and for each country’s domestic absorption value or home production quantities for estimating domestic demand. These data come from the Food and Agriculture Organization (FAO) of the U.N. Statistics Division (FAOSTAT); FAO Fisheries and Aquaculture Department (FAOFAD); U.S. Department of Agriculture (USDA) Production, Supply, and Distribution Online Database; Industrial Commodity Statistics Database of the U.N. Statistics Division; and the European Commission’s Eurostat database. Data on import tariff rates are obtained from the U.N. Conference on Trade and Development (UNCTAD) and the Trade Analysis Information System (TRAINS), from the World Trade Organization.
Data sources.

a Harmonized Commodity Description and Coding System (HS Code).
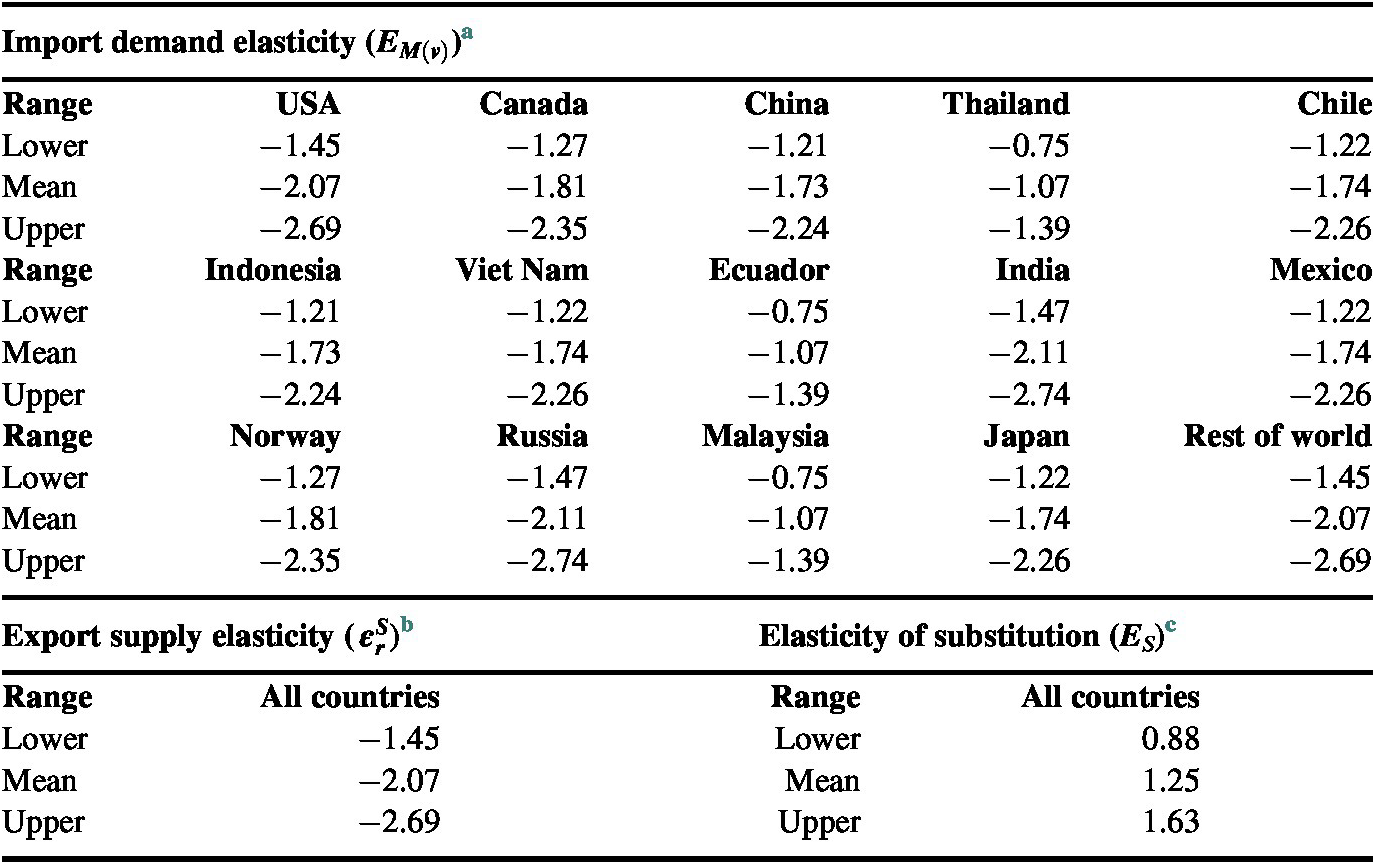
Our trade impact model also requires three types of elasticities: the aggregate import demand elasticity, the aggregate export supply elasticity, and the elasticities of substitutions. The aggregate import demand elasticities ( $ {E}_{M(v)} $
) are borrowed from Kee et al. (Reference Kee, Nicita and Olarreaga2008); these elasticities are by country. Kee et al. (Reference Kee, Nicita and Olarreaga2008) also provide the standard errors for the import demand elasticities at the disaggregated level of food products. We use these standard errors to estimate the upper and lower bounds in order to perform sensitivity analysis with respect to these elasticities. The export supply elasticities (
 $ {\varepsilon}_r^S $
) are borrowed from the Food and Agricultural Policy Research Institute (FAPRI, 2011) database. Because of the assumed constant CES of the subutility function that is embedded in our model, the elasticity of substitution (
 $ {E}_s $
) is constant across domestic and imported seafood products and across countries. The elasticities and their upper and lower ranges used in this study are provided in Table 3. Our literature sources for the values of elasticity of substitution (
 $ {E}_s $
) are Gallaway et al. (Reference Gallaway, McDaniel and Rivera2003), Reinert and Roland-Holst (Reference Reinert and Roland-Holst1992), and the Global Trade Analysis Project database (Narayanan & Walmsley, Reference Narayanan and Walmsley2008). The elasticities from these studies are estimated at a greater disaggregated products level based on a rigorous econometric approach. In our trade model, the own- and cross-price elasticities of demand were calibrated by using the estimated import demand elasticities and elasticities of substitution, and the import shares from the benchmark data. The model is numerically solved for the quantities by setting the price equal to 1.
Elasticities used in the trade model.

a Source: Kee et al. (Reference Kee, Nicita and Olarreaga2008).
b Source: FAPRI (2011).
c Source: Gallaway et al. (Reference Gallaway, McDaniel and Rivera2003); Narayanan and Walmsley (Reference Narayanan and Walmsley2008); and Reinert and Roland-Holst (Reference Reinert and Roland-Holst1992).
Given the nature of the hazard, the publicity around the disaster, and consumers’ fear of radiological hazards, an event as significant as the Fukushima disaster might have affected demand for Japanese seafood or for seafood in general, but we believe that using the existing demand elasticities from the literature may still be appropriate for several reasons.Footnote 14 First, although the literature on food outbreaks and product recalls generally suggests that food recalls can affect consumer demand at least initially, some studies show that adverse events do not necessarily result in long-lasting declines in affected product demand. For example, Piggott and Marsh (Reference Piggott and Marsh2004) concluded that the demand response of meat to food safety concerns was small after controlling for seasonal factors, time trends, and contemporaneous own- and cross-commodity food safety concerns. Mo (Reference Mo2013) examined the impact of poultry product recalls on consumer demand in the USA for four categories: broilers, eggs, turkey, and other chicken, and found no decrease in demand after recalls.
Second, FDA concluded that there was no immediate or long-term risk of consumer exposure to harmful levels of radionuclides. Onyango et al. (Reference Onyango, Miljkovic, Hallman, Nganje, Condry and Cuite2008) conducted a nationwide survey of U.S. consumers after a major recall and concluded that food safety perception critically depends on trust in regulatory agencies and institutions through which food passes before reaching consumers. If most seafood consumers share this belief and trust the regulatory measures, it would not be rational for a long-lasting decline in consumer demand to occur.
Third, most seafood from restaurants and seafood sold unpackaged in retail outlets is not always labeled by country of origin, so consumers are often unlikely to know or ask whether the seafood they plan to consume was imported from Japan. Nevertheless, to address concerns related to our choice of elasticities, we used a range of elasticities for our lower and upper bounds estimates and report these alternative sets of results in Appendix Tables A1 and A2.
5 Results and concluding discussion
The U.S. Department of Agriculture’s Economic Research Service estimated that in 2017, the USA imported from Japan approximately $0.30 billion in fish and seafood imports (ERS, 2018). Japan imports approximately 30 % of its agricultural imports from the USA each year. In 2017, for example, the USA exported almost $12 billion worth of agricultural products to Japan, including $0.8 billion in fish and seafood (ERS, 2018). While these numbers demonstrate that U.S.-Japan trade in food and agricultural products is significant for both countries, ensuring that these products are safe is an essential part of continuing this partnership.
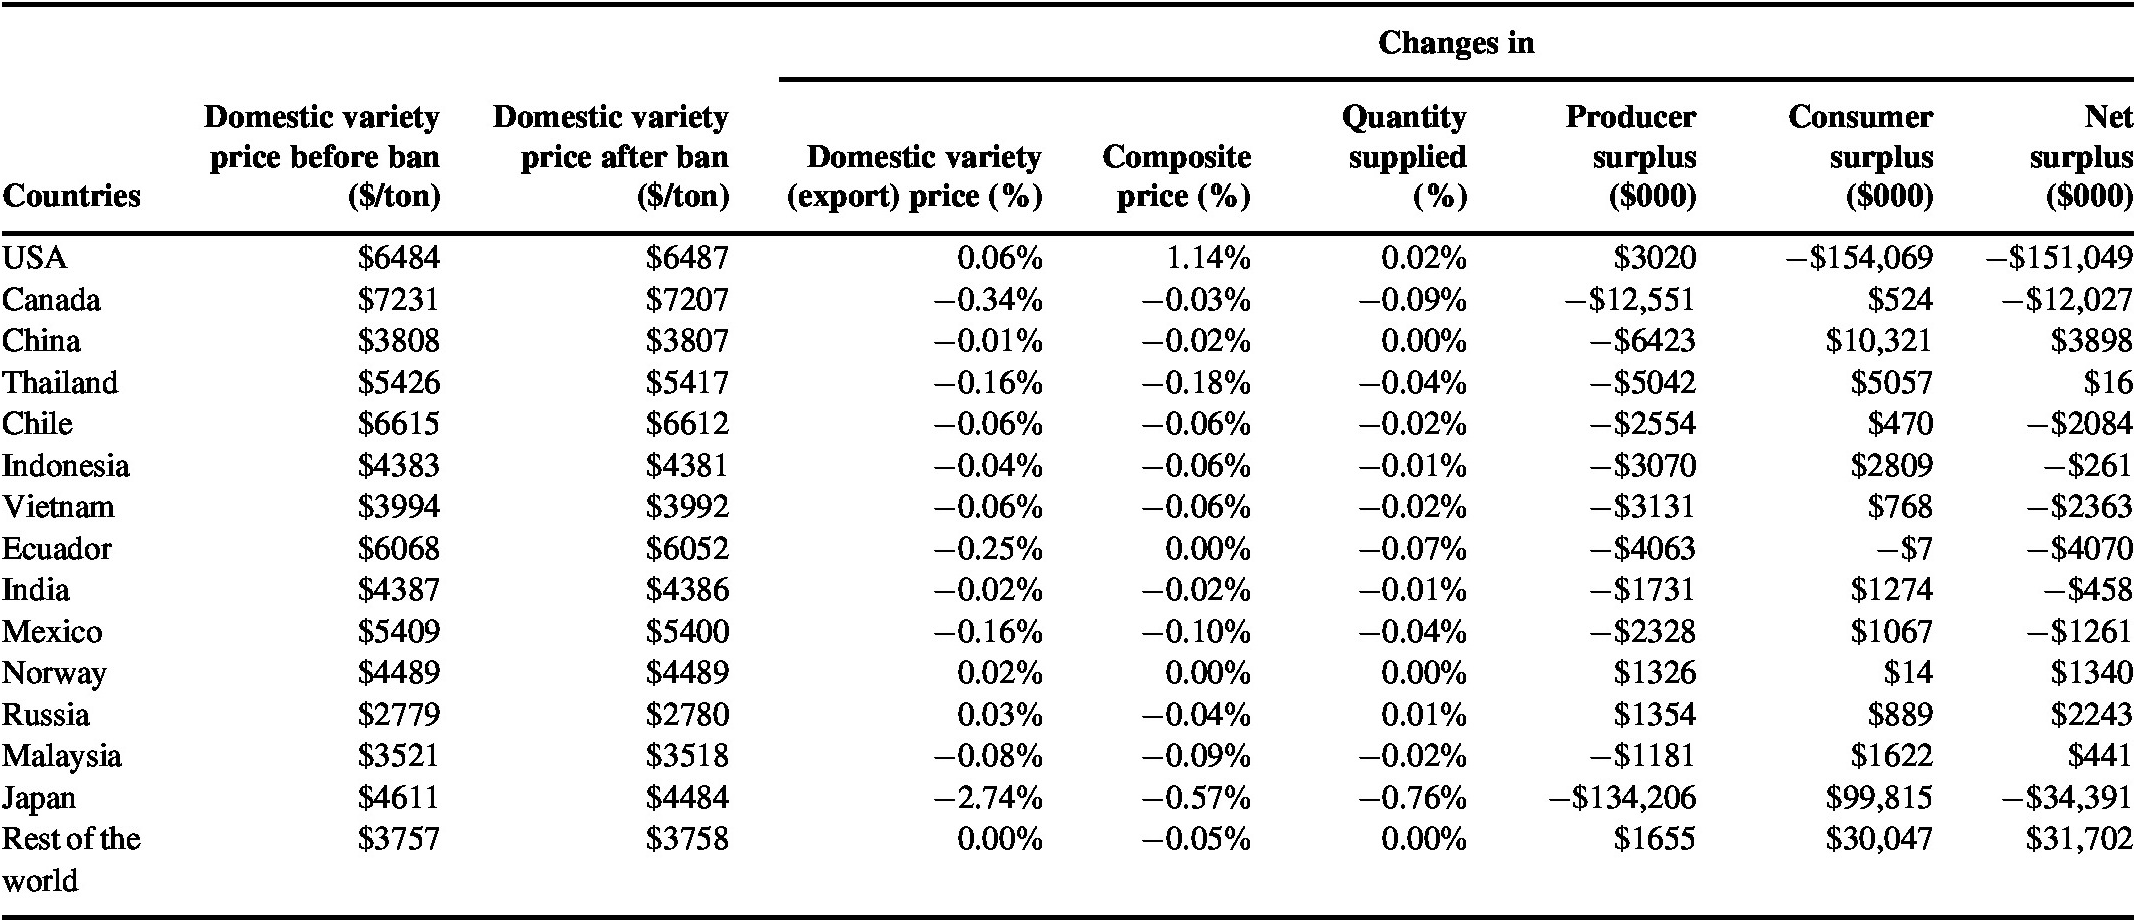
Following the Fukushima incident, the world became concerned about the safety of Japanese imports, particularly of imported food commodities, including fish and seafood. Commentary in the press and some consumer advocacy groups (e.g., Food & Water Watch, n.d.) demanded that the USA follow other major importers of Japanese fish and seafood and adopt a complete ban. The U.S. decision-makers chose a risk-based policy based on monitoring and testing. A trade ban was not implemented and U.S. imports in certain fish and seafood from Japan continued unabated, while imports of other varieties were restricted under the FDA Import Alert 99-33 (FDA, 2011). Our results from Tables 4, A1, and A2 show that the U.S. policy preserved a net surplus without introducing any meaningful exposure to nuclear contaminants.
The impact of a hypothetical U.S. ban on all fish, seafood, and seafood products from Japan due to Fukushima incident (in dollars 2011).

Figure 1 shows that the trend line for the import of Japanese fish and seafood did not decrease after March 2011 (NOOA, 2014). We attribute this nonevent to federal and state government investment in food import controls that enabled monitoring of restricted and potentially contaminated foods, in public laboratories capable of testing for radionuclides, and in public risk communications about the hazards and the measures the USA was taking to address them. At a cost of approximately $0.7 million for fish and seafood sampling, the USA did not detect harmful levels of radionuclides in over 99.5 % of Japanese fish and seafood imports and, as a result, did not impose a ban nor advise consumers to alter their consumption of these foods imported from Japan. Furthermore, the measures adopted by the USA kept the potential risk of a food scare, however small, from spreading to the rest of the domestic and imported industry. Most fish and seafood imports continued apace for the years following the disaster. Figure 1 shows an upward trend in monthly Japanese seafood imports to the USA in the post-Fukushima period. One possible explanation is that the U.S. demand responded to decreased world price for Japanese seafood as other countries adopted and maintained their bans.
Monthly U.S. fish and seafood imports from Japan, 2008–2013 (in kg).

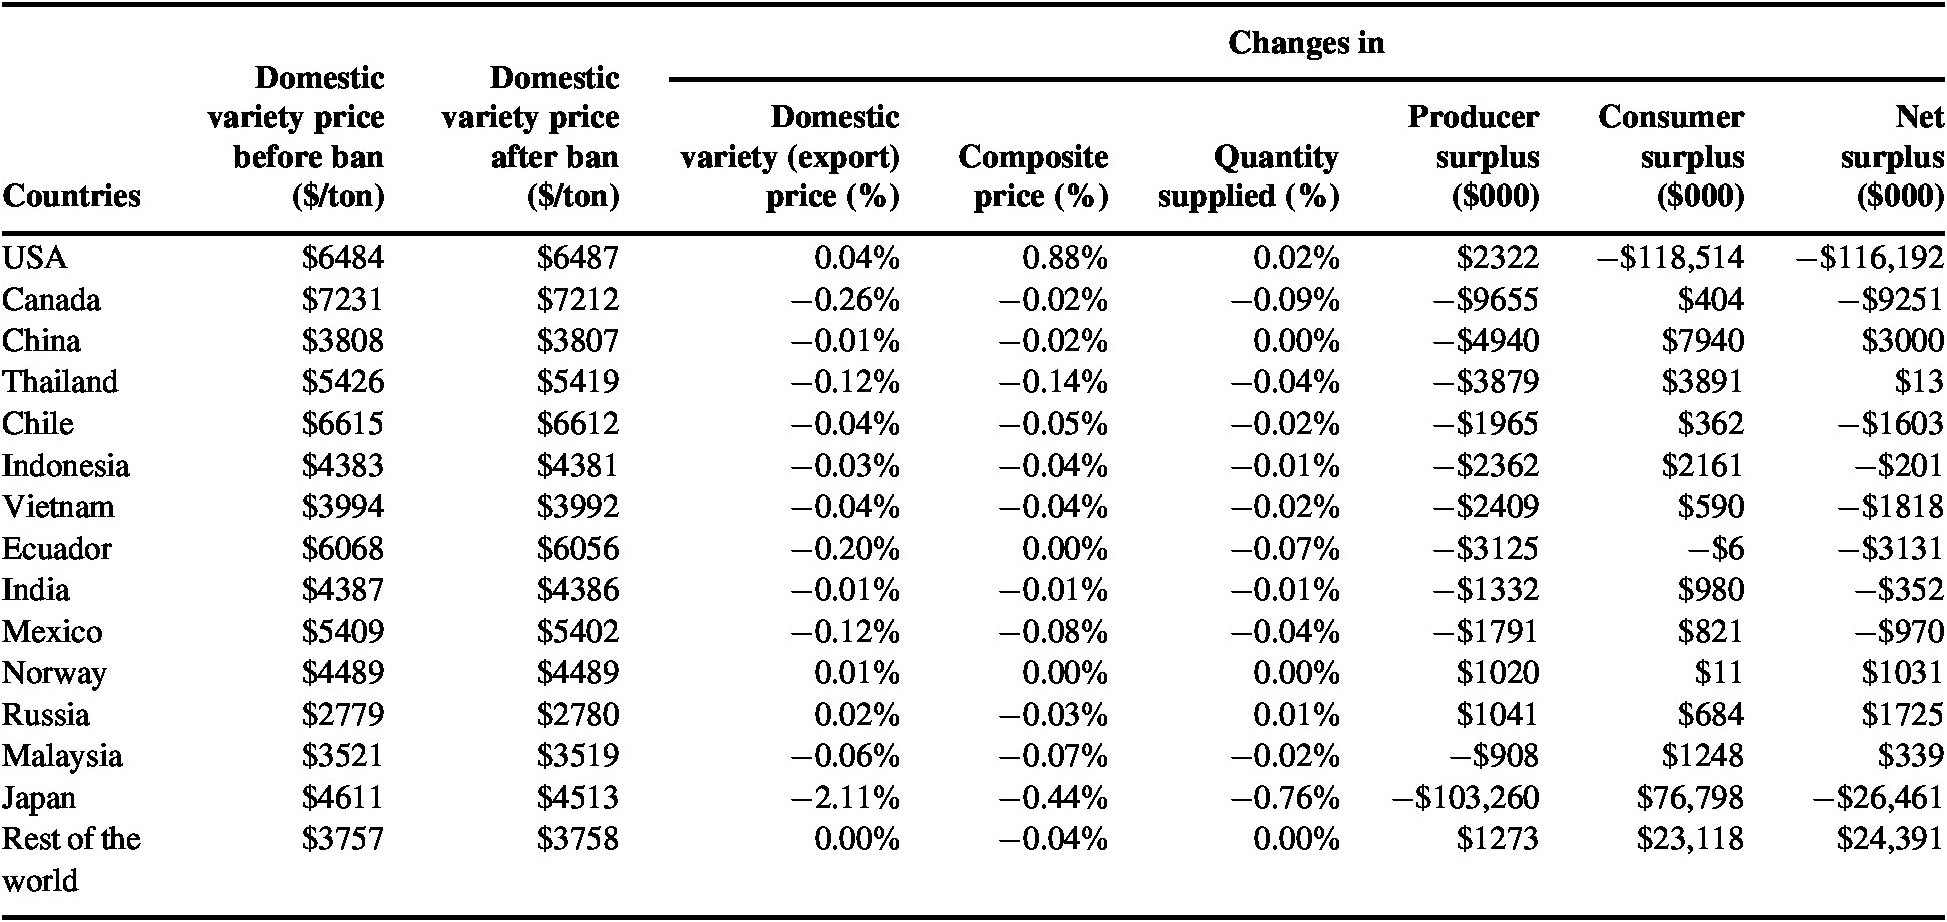
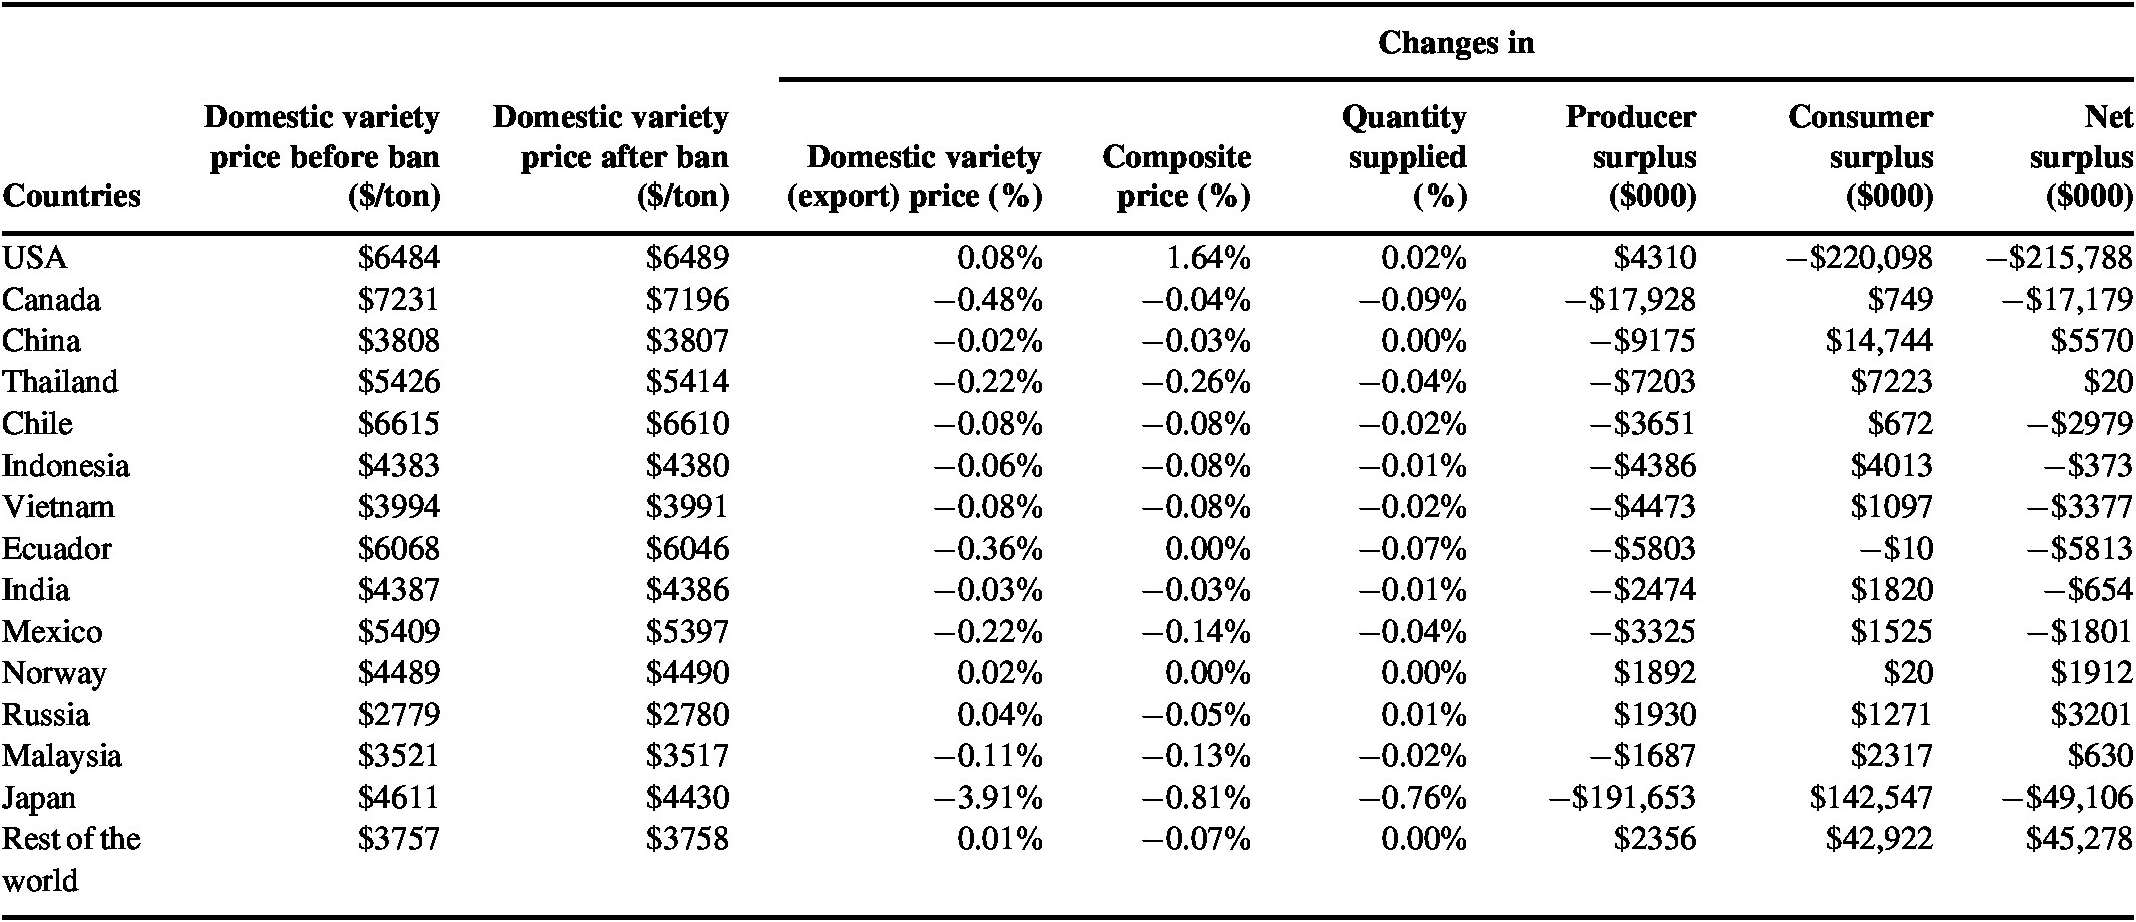
As an alternative policy, the USA might have imposed a trade ban regardless of whether contamination above the limits was detected. The USA could have prohibited fish and seafood imports, perhaps in response to the public’s heightened but exaggerated perceived risk, but our results show that U.S. consumers would have been at a disadvantage. We estimate that U.S. policy preserved between $119 and $220 million (Tables 4, A1, and A2) in annual consumer surplus from the continued import of Japanese fish and seafood, with our best estimate of $154 million (Table 4), while finding no additional public exposure to harmful radionuclides.
Our primary set of results from Table 4 suggest that under a ban, the composite price for these products in the USA would have risen by approximately 1 %. While the percentage increase is relatively small, our findings show that it would have caused total surplus to decline by approximately $150 million per year, with no offsetting benefit to public health. The entire loss would have been attributed to the loss of consumer surplus due to a price increase. Japanese producers would have been worse off; we estimate their loss of producer surplus at approximately $134 million (Table 4). By contrast, Japanese consumer surplus would have risen by approximately $100 million due to a slight domestic composite price decrease by 0.6 % (Table 4). We found that the impact on all other major U.S. fish and seafood trading partners would have been negligible; the biggest loss among them would have been for Canadian producers, who would have lost approximately $12 million in producer surplus (Table 4).
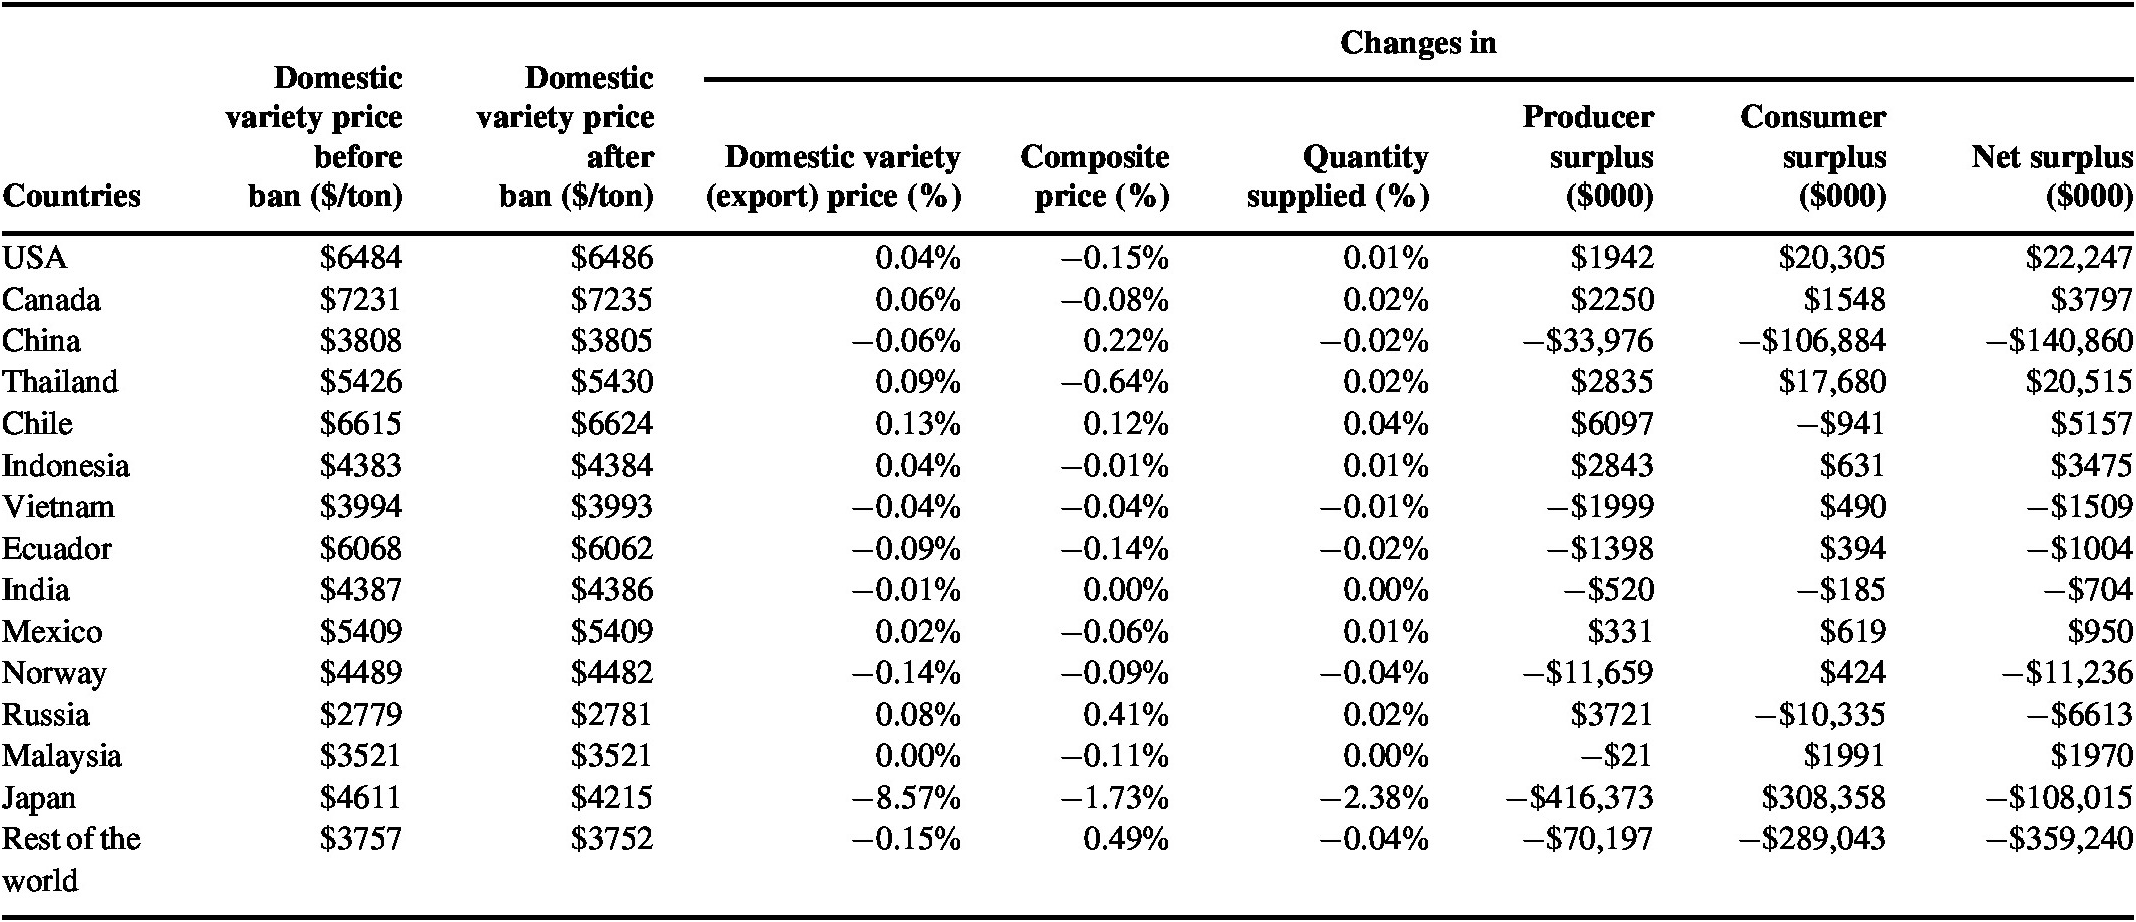
Table 5 shows the estimates of the impact on world trade in fish and seafood of the approximated realized bans by China, India, Russia, South Korea, Taiwan, Singapore, Australia, the Philippines, and several other countries, but not by the USA. To estimate the order of magnitude of these impacts, we ran the model for a conservative scenario with a 100 % reduction in Japanese fish and seafood imports by China, India, and Russia, and an approximation that bans by other countries cumulatively reduced the rest of Japanese pre-Fukushima exports of these products by half. Our results suggest that under this scenario, the USA experienced a $22 million increase in net surplus, including $20 million in consumer surplus because the domestic composite price dropped slightly.Footnote 15 China’s lost net surplus of approximately $140 million was the result of a slight increase in a composite domestic price and a slight decrease in domestic producer prices; the impact on India and Russia was negligible (Table 5). Under this scenario, Japanese fish and seafood producers and consumers in the rest-of-world category would experience losses of approximately $0.4 billion each.
The impact of an import ban by several countries (China, India, Russia, etc.) on all fish, seafood and seafood products from Japan due to Fukushima incident (in dollars 2011).

As estimated above, FDA’s sampling and inspection program cost approximately $0.7 million. The net surplus gain (or avoided loss from a ban) was approximately $150 million, and spillover effects from fish and seafood bans by other countries may have resulted in an additional $22 million. Based on these findings, we conclude that the U.S. policy of conducting an initial evaluation of the potential health risks, sample product monitoring, and an import alert was effective, while preventing the economic losses from a more aggressive food safety policy, such as a ban. There seem to be no grounds for “policy regret.”
Furthermore, our results are consistent with the following hypothetical counterfactual scenarios of policy responses to catastrophes: (i) detected contamination, resulting in an immediate complete ban; (ii) a ban, even if detected contamination is below the limits; and (iii) a ban without testing for contamination. Our study did not consider the potential costs that may have arisen under another hypothetical counterfactual scenario (iv) of undetected contamination, a scenario that also could be considered in retrospective benefit-cost analyses of policy responses to catastrophes. If, in this unlikely hypothetical scenario some significant initially undetected contamination had occurred, the result would have been significant costs related to negatively impacted consumer health and crisis management. In that scenario, the policy could then be quickly reversed, and an import ban or other protective policy adopted. If an import ban had been adopted, the additional cost to society would be the lost consumer surplus. The benefits would be the avoided additional injuries to consumers and cost savings from avoided additional expenses related to crisis management.
To conclude, we summarize the following general lessons learned that enabled the U.S. policy response to succeed. First, having applied the well-established and clear science related to the human health risks posed by radionuclides was critical in responding to this potential food safety catastrophe. Second, having an advanced regulatory infrastructure in place with a network of laboratories for import sample testing was critical to making seafood safety risk determinations. Third, monitoring all relevant information and collaborating with Japan, a willing partner that also had an advanced regulatory infrastructure, enabled the use of import alerts. Fourth, the size of consumer surplus may matter. A country with a smaller consumer surplus without the laboratory infrastructure or scientific knowledge of the health risks might have selected another policy. The generalizable lesson is that investment in regulatory infrastructure and food safety science, a knowledge of the health risks, and the ability to assess the net changes in consumer surplus has tangible economic benefits. Finally, having existing studies regarding demand elasticity estimates by country and/or by product is relevant to studies like ours, because policy analysts typically turn to the existing literature for those estimates in a time of crisis or when they proactively adapt trade impact models for later crises.
In sum, we showed that retrospective benefit-cost analysis, coupled with a comprehensive trade impact analysis, can be a useful framework for evaluating responses to global food safety catastrophes. Our trade modeling approach showed that with a relatively small number of inputs, analysts can quickly provide policy decision-makers with the approximate magnitude of the trade impact of alternative policy options, especially in the time of crisis, when there is a time constraint. Our article, therefore, would be of interest to policymakers and other stakeholders that are looking for a suitable framework for evaluating policy responses to catastrophes, or for an “all purpose” trade model that is based on standard, widely accepted trade theory. Its results would also be of interest to a more general audience, as it is the first study estimating the impact of the Fukushima incident on trade.
Appendix
The impact of a hypothetical U.S. ban on all fish, seafood and seafood products from Japan due to Fukushima incident (in dollars 2011); estimates using upper range elasticities.

The impact of a hypothetical U.S. ban on all fish, seafood and seafood products from Japan due to Fukushima incident (in dollars 2011); estimates using lower range elasticities