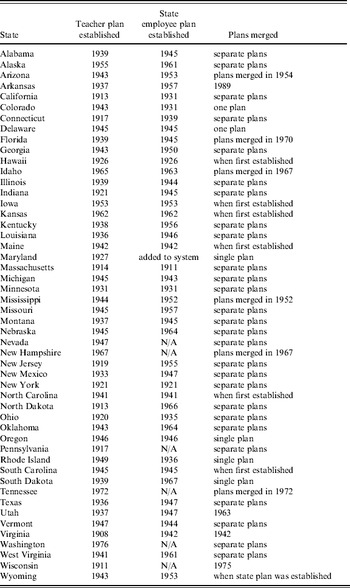
The first retirement plans for public school teachers were established more than 100 years ago. Initially, these pension plans covered only teachers in single school districts and were most often found in larger municipalities (Clark et al., Reference Clark, Craig and Wilson2003). During the twentieth century, many of these local retirement plans were merged to form a state teachers' retirement plan, often covering all of the school districts in a state. In most states, retirement plans for teachers predate the establishment of plans for other state employees. Indeed, some states did not establish plans for civil servants until after 1960 (see Table 1).Footnote 1 During the second half of the twentieth century, many states merged their plans for teachers with those covering other state employees, thus creating a single state retirement plan that covered both civil servants and teachers (and, in some cases, local government employees as well). As of 2008, 23 states had a single retirement plan, covering state employees and teachers; while the remaining states retain separate pension plans for at least some public school teachers.Footnote 2
Year state retirement plans established and merged

Source: Histories provided by state retirement systems and retirement plan websites. It is difficult to determine the date the first plans were established in some states as the plan histories provided by the state retirement plans often refer to the date that the most recent plan was formed, e.g. if a teacher plan merged with a preexisting plan covering state employees, the date of the plan is given as the year of the merger not the year that either of the original plans were established.
This paper examines the development of retirement plans for teachers during the twentieth century. Specifically, it reviews changes in the generosity of teacher plans in the last decades of the century, and it analyzes differences in retirement benefits between plans that cover teachers only and plans that cover teachers and other state (and sometime local) employees. We begin with a history of teacher retirement plans. This history is necessarily linked to the growth in retirement plans for other state employees. Next, we present data on the benefit formulas and contribution requirements for teacher plans in all 50 states over the past quarter century or so. In general, the generosity of teacher plans has increased over time, and, in particular, income replacement rates for teachers have increased by about 10% over the past quarter century or so. We then estimate the determinants of plan generosity and explain the variation in pension benefits across states. Finally, we present some conclusions about the current state of teacher retirement plans.
1 Evolution of teacher pension plans in the United States
Teachers, along with municipal police officers and firefighters, were the first state or local public employees to be covered by employer-provided pension plans.Footnote 3 (Military personnel were the first public-sector employees to be covered by pension plans in the United States, see Clark et al., Reference Clark, Craig and Wilson2003.) Initially, these plans were developed at the local level, typically by large municipalities. The development of teacher pension plans in the twentieth century included the establishment of pension plans for teachers in every state along with, in some states, the merger of teacher plans with those for other state employees. The extension of Social Security to public employees on a voluntary basis beginning in 1951 resulted in a wave of states deciding to allow their employees to be covered by Social Security. By the mid-1970s, these structural changes in the retirement systems of the various states had, for the most part, run their course. However, over the subsequent three decades, important plan characteristics continued to evolve. In particular, governments increased the generosity parameters in teacher pension plans, which resulted in higher replacement rates for the same years of service, and they also frequently lowered the age and service requirements for early and normal retirement.
Establishing teacher retirement plans
Many of the larger cities in the United States began establishing retirement plans for their public school teachers near the end of the nineteenth century. Generally, the state legislatures had to pass enabling bills before local school boards could establish and fund pension plans. These early plans were generally financed by local property taxes; however, the actions of the municipalities were often overseen by the state governments. In most states, retirement plans for teachers ante-dated similar plans for other state employees by several decades.
A review of the experience of some of these plans provides insights into the early development of teacher retirement plans by local school districts and how they evolved into statewide plans in most states. In 1894 and 1895, the New York state legislature passed acts that permitted New York City and Brooklyn to offer teacher pension plans. In the ensuing decade, further legislation was enacted allowing other cities to offer plans. The first teacher retirement plan in the state of Michigan was the Detroit Teachers' Retirement Fund established in 1895. This plan was limited to teachers and excluded other school personnel. In 1917, the Michigan Teachers' Retirement Fund was organized to pay benefits to retired teachers with 30 years of experience. Initially, this plan was funded only by employee contributions, but a 1937 act provided for state contributions. Around 1940, non-teaching employees were allowed to join both the Michigan system and the Detroit system. In 1907, the Indiana legislature created a plan for teachers in Indianapolis, and the Illinois legislature created a plan for Chicago in the same year. Other states quickly followed suit and allowed local governments to establish teacher retirement plans in major cities, including as Denver, Omaha, and New Haven.
Teacher retirement plans originated at the local level; however, many state legislatures moved toward statewide plans during the twentieth century. For example, with the exception of New York City, all of the early municipal plans in New York were incorporated into the state pension plan for teachers in 1921. The Michigan and Detroit systems were merged into one statewide system in 1980, and other states had similar experiences. Table 1 provides dates for the establishment of some state teacher retirement plans and when or if they merged with plans for other civil servants.
The histories of these plans vary state by state; however, some common features can be observed. First, in most states, the first retirement plans were established in the largest cities in the states after enabling legislation was passed by the state legislature. Second, as states established statewide pension plans for teachers, the legislation often permitted the preexisting plans of the major cities to remain outside the state plan, though, in many states, these large city plans were eventually incorporated into the state plan. Third, the state plans for teachers typically were established prior to the development of similar plans for other state employees. Fourth, during the course of the twentieth century, a number of states merged their teacher plans with the plan for state employees.
The evolution of teacher retirement plan over the past 100 years raises several economic questions that are relevant to the generosity and characteristics of pension plans for teachers in the twenty-first century.
• If the labor market for teachers is different than that for other state employees, should public employers develop different plans with different retention and retirement incentives? For example, should we observe differences in early and normal retirement ages and vesting requirements?
• Will retirement plans for teachers be more generous if coverage is limited to teachers? Does broad coverage of plans increase or decrease the ability of teachers to achieve more generous retirement plans?
If teacher turnover is especially costly, then the pension contract could be used to tie teachers to the state school system by stretching out vesting times and otherwise back-loading the accumulation of pension wealth. However, if teachers have longer tenure than other state employees, ceteris paribus, then plans covering civil servants may be more likely to have penalties for mid-career turnover. If teachers command a premium over other state employees in the labor market, ceteris paribus, then that might be reflected in the relative generosity of their pension contracts, through for example shorter vesting times and front-loading pension compensation. As for the impact of being in a pension plan with other state workers, public choice theory suggests bargaining over pension wealth could be enhanced by being in a stand-alone plan.
Social Security and public school teachers
In 1935, Congress established the Social Security system covering most private employees but excluding state and local workers from the system. In the 1950s, federal legislation permitted state and municipal governments to have their employees, including teachers, join the Social Security system. By that time, most states and many municipal governments had already developed retirement systems for their teachers and other employees. Thus, the non-federal governmental units were allowed to decide whether their employees would enter the Social Security system, or whether they would continue to maintain their own retirement plans without Social Security coverage. If a public employer decided to enter the Social Security system, then they had to decide whether they would reduce the generosity and cost of their own plans.
While most governmental units decided to join Social Security, some state and local employers chose to remain outside of the Social Security system. Currently, approximately 28% of all state and local public employees remain outside the system (Streckewald, Reference Streckewald2005). The majority of public employees who do not participate in Social Security are teachers, police officers, and firefighters. As noted, the members of these groups were typically among the first non-military public workers to receive pensions in the United States; thus, employees in these occupations typically were already covered by a retirement plan when Social Security was established (Clark et al., Reference Clark, Craig and Wilson2003).
Periodically, there are proposals in Congress to require that all newly hired public employees be included in the Social Security system. In general, teachers and other employees outside Social Security and their national representatives oppose being required to be covered by Social Security. There currently are seven states whose state employees, including teachers, are outside the Social Security system: Alaska, Colorado, Louisiana, Maine, Massachusetts, Nevada, and Ohio.Footnote 4 In addition, teachers and local public employees in California, Connecticut, Illinois, Kentucky, Missouri, and Texas do not participate in Social Security (Munnell, Reference Munnell2005). We would anticipate that the retirement plans for teachers not covered by Social Security would be more generous than the plans covering teachers who were also participating in Social Security.
2 Recent trends in teacher retirement plans
Despite the 30-year trend among private sector employers away from defined benefit plans and toward a greater emphasis on defined contribution plans, defined benefit plans remain the dominant type of retirement plan for teachers and other employees in the public sector. In 2007, the US General Accounting Office reported that with the exception of Alaska and Michigan,Footnote 5 all states offered defined benefit plans as their primary retirement plan for newly hired general state employees.Footnote 6 In addition, two states, Indiana and Oregon – had adopted plans for teachers and other state employees that included components of both defined benefit and defined contribution plans (Washington also did so for its teachers only), and Nebraska had established a cash balance plan for its general state employees. In addition to their primary retirement plan, every state offered its employees the opportunity to participate in voluntary defined contribution plans such as 403(b) or 457(b) plans. In contrast to the private sector, public employers often do not match employee contributions. Only 12 states match employee contributions to defined contribution plans up to a specified limit (US GAO, 2007).Footnote 7
Pension benefit formulas in defined benefit plans are often rather complex, with the benefit varying by age, years of service, earnings, and coverage by Social Security. The benefit formulas in pension plans for teachers have been changed fairly regularly over the past 25 years. To examine the changes in pension benefits over time, we constructed replacement rates for teacher pension plans in the various states using the benefit formulas reported in the Wisconsin Legislative Council, Comparative Study of Major Public Employee Retirement Plans for 1982 and 2006. The replacement rate is the most useful indicator of the value of a pension to teachers nearing retirement. It indicates the percent decline (or increase if the rate exceeds 100%) in income from the final working years to the initial retirement years. It is also a measure used by employers as they consider the cost and generosity of their pension plans. We employed the same methodology to examine the replacement rates for general state employees. In some cases, the data in the report were insufficient to calculate replacement rates. For these plans, we went to their websites and found more detailed current information. We assumed that the resulting parameters applied for 2006. Unfortunately, we are unable to reconstruct the more detailed information for 1982. Thus, the 1982 estimates are based solely on the information provided in the Wisconsin report and this required us to make some additional assumptions about the benefit formulas in some states.
To compare the generosity of these state pension plans for teachers, we derived 30 year replacement rates for workers hired at age 30 and retiring (on their birthday) at age 60. We assume that the worker had an annual salary of $50,000 at age 55 and that their salary increased by 3% per year until retirement. This produced annual salaries of $50,000 at age 55, $51,500 at age 56, $53,045 at age 57, $54,636 at age 58, and $56,275 at age 59. The same salary structure is used for both 1982 and 2006. This assumption will tend to overestimate the dollar benefits that retirees received in 1982; however, its impact on the replacement rates should be relatively modest. To determine the retirement benefits, we examined the normal and early retirement ages for each plan and found that a 30-year employee at age 60 would have achieved at least one of the requirements for normal retirement in all plans. Thus, for each state plan, we apply the benefit formula for normal retirement and do not impose any reductions for early retirement.
We also checked each plan for Social Security integration. Social Security integration differs from ‘being in Social Security’. Integration means that the plan takes into account expected Social Security benefits in determining an employee's pension benefit. Among the teacher plans in 2006, only the plan for Connecticut was reported to be integrated with Social Security. Fortunately, the Wisconsin report gives the integration formula for Connecticut, so we are able to adjust the first year retirement benefit and the replacement rate. In 1982, a few states had formulas that were integrated with Social Security. Unfortunately, the Wisconsin report for 1982 does not provide sufficient information about the integration formula for us to calculate the pension benefit net of the integration factor. Thus, for the plans that were integrated with Social Security in 1982, we ignore the integration and use the generosity parameter for earnings in excess of the Social Security earnings level. This process means that, for these integrated plans, the replacement rate in 1982 is overestimated, and thus the gain in pension generosity between 1982 and 2006 will be underestimated.
Each of the plans in our data set bases the initial retirement benefit on a measure of average salary over the final working years. We calculated the final average salary (FAS) for employees in each state based on the years included in the FAS shown in the Wisconsin report and the assumed salary history described above. The number of years in the FAS ranges from 1 to 5. It follows that, holding salary history and the generosity parameter constant, states using fewer years in the FAS will provide larger retirement benefits.
The annual first-year retirement benefit for an employee in each plan is the product of three factors: the stated generosity parameter, 30 years of service, and the FAS. In many of the plans, generosity parameters vary by years of service and in some cases by age and salary. These differences are taken into account in our calculations of the annual benefit. If the 2006 Wisconsin report provided insufficient information on the benefit formula, we went to the plan's website and used the 2009 information to supplement the information on the benefit formula so that we could calculate the first year retirement benefit and the replacement information. We were unable to do this for the 1982 benefits. For four plans, the 1982 Wisconsin report provide benefit formulas only for persons retiring at age 65. For these plans, we applied the age 65 benefit formula to our age 60 retirees. As with Social Security integration, this will tend to slightly overestimate the age 60 benefit – though it is important to note that in each case, the age 60 retiree had met the standard for normal retirement.
The replacement rate is calculated by dividing the first year retirement benefit by the age 59 salary ($56,275). Note that this is not the same as the FAS used to calculate the benefit. For example, a worker in a plan with a 2.0% generosity parameter and FAS calculated over five years would have a benefit of $31,855 (0.02×30×$53,091; where $53,091 is the salary average over the final five years of employment). The replacement rate used in this analysis is not 60% ($31,855/$53,091) but instead is 56.6% ($31,855/56,275). This method of calculating the replacement rate provides a more uniform assessment of the generosity of plans than using the replacement rate based on comparing the benefit to the FAS.
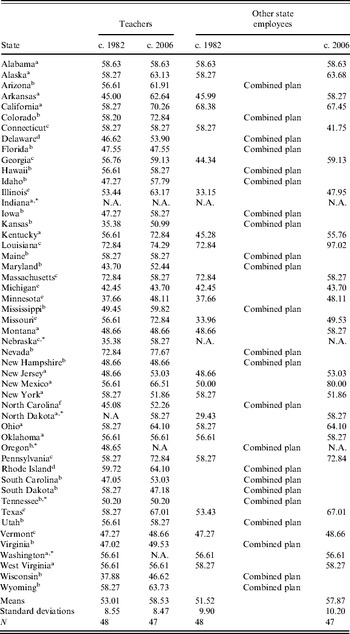
The first two columns of Table 2 show the replacement rates for retirement plans covering teachers in 1982 and 2006. In 1982, the mean replacement rate for teachers was 53.0%. By 2006, the replacement rate had risen by more than five percentage points (10%) to 58.5%. The replacement rates in 2006 range from a low of 43.7% in Michigan and Tennessee to a high of 77.7% in Nevada. The replacement rates increased in 34 of the states, remained the same in nine states, and declined in only three states.Footnote 8
Retirement benefit replacement rate with 30 years of service, for state teacher pension plans and other public employees, by state, 1982 and 2006

Notes: a Other state employees' plan includes local workers and state employees.
b Teacher plan includes teachers and other state and local workers.
c Other state employees' plan includes only state workers.
d Teachers and other state employees are in one plan, and the state does not maintain a separate plan for local workers.
e State maintains separate plans for other state employees and local workers.
f Teachers and other state employees are in one plan, while local workers are in another.
* The structure of the following plans do not permit comparisons with the other plans in the sample: Indiana teachers and other state employees, 1982 and 2006; Nebraska, other state workers, 1982 and 2006; Oregon teachers, other state, and local employees, 2006; Nebraska, other state workers, 1982 and 2006; North Dakota teachers, 1982; and Washington teachers, 2006. Thus for the 1982 regressions in Table 5 below, Indiana and North Dakota are omitted; whereas for the 2006 regressions, Indiana, Oregon, and Washington are omitted.
In 23 states, other state employees participate with teachers in a combined plan; however, the other 27 states maintain separate plans for teachers. Table 2 also reports the replacement rates for retirement plans for state retirement plans that do not include teachers (columns 3 and 4). For states that maintained two retirement plans, one for teachers and one for other state employees, the mean replacement rates in the plans for other state employees were slightly below those for teachers in both years, 51.5% in 1982 and 57.9% in 2006. In the 27 states where teachers and state employees were in different retirement plans, 12 states had the same replacement rates for teachers and other state employees; six had smaller benefits for teachers; and six had larger benefits for teachers.Footnote 9
The public choice literature (see, for example, Buchanan and Tullock, Reference Buchanan and Tullock1962; Olson, Reference Olson1965; and Libecap, Reference Libecap1989), suggests that, controlling for other social and economic factors, teachers should receive higher replacement rates when they are in plans that do not include other state employees. This hypothesis follows from the observations that well-defined, or more homogeneous, groups tend to be more successful than heterogeneous groups in governmental bargaining situations groups, ceteris paribus, of course. This hypothesis is tested in the regression analysis presented below.
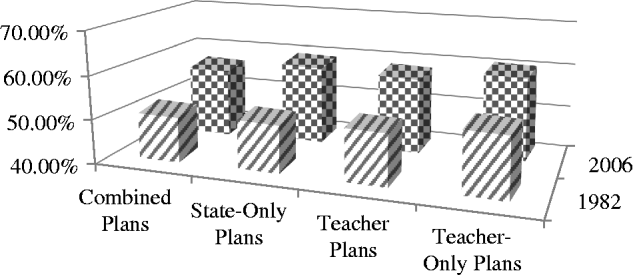
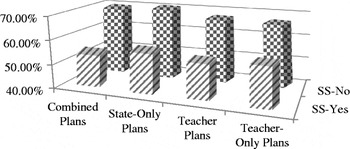
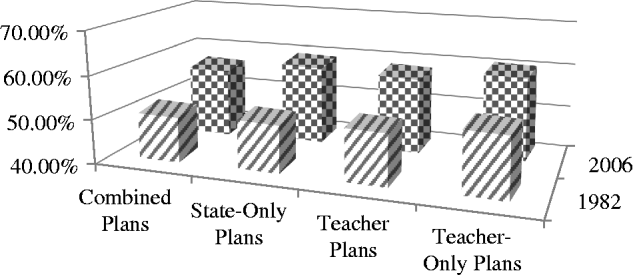
Thus, we can divide the teacher, state, and combined plans into four categories: plans containing teachers and other state employees (we call these ‘combined’ plans); plans containing only other state employees (‘state-only’ plans); all plans containing teachers (‘teacher’ plans); and plans containing only teachers (‘teacher-only’ plans). Figure 1 presents the mean replacement rate for these four categories. Although on average the generosity of all of the plans increased between 1982 and 2006, teacher-only plans had more generous increases than combined plans.
Mean income replacement rates, teacher and other state pension plans, 30 years of service, 1982 and 2006 Note: Figures are the mean annual replacement rates of teacher and state employee pensions for workers retiring in 1982 or 2006, with 30 years of service. Sources: Wisconsin Legislative Council (1982 and 2006); and author's calculations from websites of state retirement plans.
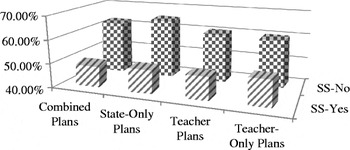
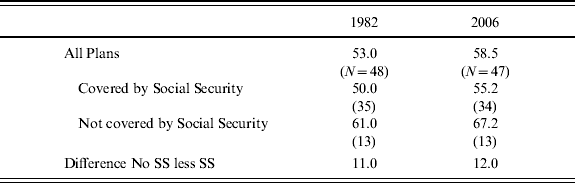
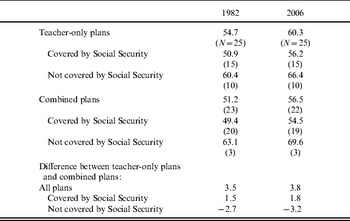
Another useful comparison is to contrast the replacement rates for teachers in plans where employees are covered by Social Security to employer provided plans in which participants are not part of the Social Security system. Teachers in 13 states remain outside of Social Security. In 1982, the mean replacement rate for teachers with 30 years of service in these plans was 61.0% (see Figure 2). By 2006, changes in the plan formulas had increased the mean replacement rate to 67.2% (Figure 3). In contrast, the 30-year mean replacement rate for teachers in state plans that participated in Social Security was 50.0% in 1982 and 55.2% in 2006. Thus, employer-provided teacher retirement plans in states where teachers are not included in Social Security provided, on average, a replacement benefit for teachers with 30 years of service that was 11.0 to 12.0 percentage points higher than the benefit in states where teachers were participants in Social Security (Table 3). In addition, the differences between the mean replacement rates of the teacher-only plans and the combined plans can be decomposed along the lines of Social Security coverage. Table 4 illustrates the replacement rates for teacher-only plans in and out of Social Security, and combined plans in and out of Social Security. Interestingly, the difference between the two types of plans is driven by workers covered by Social Security. Teacher-only plans have higher mean replacement rates than combined plans when both groups are covered by Social Security, but when neither group is covered the combined plans yield higher replacement rates.Footnote 10
Mean income replacement rates, teacher and other state pension plans, by Social Security coverage, 1982 Note: Figures are the mean annual replacement rates of teacher and state employee pensions for workers (with and without Social Security coverage) retiring in 1982, with 30 years of service. Sources: Wisconsin Legislative Council (1982 and 2006); and author's calculations from websites of state retirement plans.

Mean income replacement rates, teacher and other state pension plans, by Social Security coverage, 2006 Note: Figures are the mean annual replacement rates of teacher and state employee pensions for workers (with and without Social Security coverage) retiring in 2006, with 30 years of service. Sources: Wisconsin Legislative Council (1982 and 2006); and author's calculations from websites of state retirement plans.

Average replacement rate by Social Security coverage
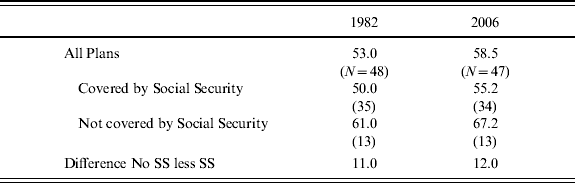
Note: Number of plans in parentheses.
Average replacement rate by employee group

Note: Number of plans in parentheses.
The replacement rates are a function of the benefit formulas, and changes in the replacement rates occur only when the benefit formulas are changed. To better understand the increases in the replacement rates between 1982 and 2006, we need to observe the changes in the actual benefit formulas. To assess the importance of these changes, we examined the benefit formulas and contribution rates of teacher retirement plans in all 50 states in 1982 and 2006. Key plan parameters included in the analysis were the normal retirement age specified in the plan, the number of years used to determine the final salary average, and the retirement multipliers in the benefit formula. Comparing the 1982 and 2006 parameters illustrates how teacher retirement plans have evolved over the past 25 years. In general, these plans have become more generous over the years. The normal retirement ages (NRA) in the plans have been lowered in 32 states, allowing teachers to retire at earlier ages with fewer years of service; while only six states have raised the NRA. Fifteen states reduced the number of years in the averaging period, thus raising final pension benefits, and no state increased the number of years in the salary average.
In addition, 31 states increased the generosity parameters in the benefit formula and/or eliminated Social Security offsets, and only three states reduced the multipliers used to calculate retirement benefits. As a result of these changes, holding other factors constant, the typical teacher will retire with a higher replacement ratio in 2006 than in 1982. Finally, 19 states reduced the number of years of service required for 100% vesting. Overall, then the data reported here suggest a general upward trend in the generosity of teacher retirement plans over the past quarter century.Footnote 11 An interesting extension of this analysis would be to examine the timing of benefit increases by the various states to determine whether benefit enhancements occurred when trust funds appeared to be over funded, state revenues were unexpectedly high, etc.
3 Determinants of the generosity of teacher pension plans
In this section, we attempt to explain differences in the replacement rates that teachers will achieve, depending on their state of employment, and how these differences have evolved over time. Statistical analysis was limited by the relatively small number of teacher plans in our sample.Footnote 12 We estimate a simple model of the determinants of the generosity of teacher retirement plans. Research on employee compensation suggests that any such model should include a measure of the state's growth, proxied here by population growth; an indicator of the collective bargaining strength of public employees; the plan's connection or lack of connection to Social Security; and whether the plan covers only teachers or also includes other state employees (see, Clark et al., Reference Clark, Craig and Wilson2003; Craig, Reference Craig1995; Fishback and Kantor, Reference Fishback and Kantor1995, Reference Fishback and Kantor2000; Gruber and Krueger, Reference Gruber, Krueger and David1991; Moore and Viscusi, Reference Moore and Viscusi1990; Munnell, Reference Munnell2005). Given the data limitations, the model we estimate is

where Replacement Rate it is the income replacement rate for a representative worker in the ith state pension plan in year t; PopulationGrowth it is the average annual compounded rate of population growth during the most recent ten-year period in the ith state; Union it is the share of public sector employees covered by a collective bargaining agreement in the ith state in year t; Plan it is a dummy variable, which takes on the value one for plans that cover teachers and other state employees in year t and zero for plans that include only teachers; and SocialSecurity it is a dummy variable that takes on the value one if the teachers in the ith state plan are covered by Social Security, zero otherwise.
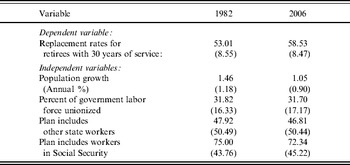
We anticipate that the population growth and union variables will have positive coefficients. Population growth serves as a proxy for the overall economic climate of the state in question and thus the demand for public school teachers. We hypothesize that a more rapidly growing state will have a greater need for public school teachers and that this increased demand would lead to more generous retirement benefits.Footnote 13 The union variable reflects the collective bargaining strength of the state's public sector workers. Unfortunately, we do not have access to the proportion of teachers in each state that are covered by collective bargaining contracts. It seems likely that teachers have a higher incidence of unionization than other state employees, and this could influence the results of the regression since we are attempting to estimate the impact of teacher retirement plans with and without other state employees. Following the logic of the public choice literature, which suggests the more homogeneous the group the more successful in public bargaining situations it will be, we expect the sign on the plan dummy variable to be negative. Finally, the impact of Social Security, coverage as captured by the dichotomous coverage variable, should be negative. Economic theory suggests that workers excluded from Social Security will tend to receive a compensating differential in the form of a higher replacement rate from their employer-provided pension. Table 5 contains the means and standard deviations of the dependent and independent variables.Footnote 14
Descriptive statistics: means and standard deviations in percent

Source: Clark et al. (Reference Clark, Craig, Ahmed, Gary and Olivia2009) .
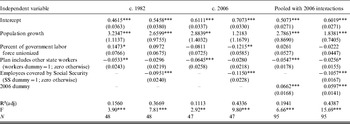
The results from estimating three versions of equation (1) are shown in Table 6. Columns 1 and 2 contain the estimated coefficients for 1982; while columns 3 and 4 contain the results for 2006. Columns 5 and 6 report the findings from a pooled regression that includes observations from both years and a dummy variable for 2006, which captures the increase in replacement rates over time. The estimated coefficients in the 1982 regressions are consistent with our expectations.
Multivariate models of replacement rates for teachers' plans, with 30 years of service, 1982 and 2006

Notes: For the omitted states, see the explanation in the notes to Table 2. Standard errors are in parentheses.
*** The probability of obtaining the resulting test statistic this large when the null hypothesis of β=0 is true, is less than 0.01; ** less than 0.05; and * 0.10.
Turning first to the results shown in column 1, an expanding state economy, as measured by population growth, puts upward pressure on the replacement rate. The estimated coefficient indicates that a one percentage point (per year) increase in the population growth rate is associated with a 3.2 percentage point increase in the replacement rate. While this might seem like a large impact, the reader should note that the mean annual population growth rate among the states is only 1.4% per year, and an increase of one percentage point represents roughly one standard deviation from the mean growth rate.
Greater unionization of the state government labor force is expected to produce a greater demand for teachers and more generous retirement benefits. The estimated union effect has the expected positive sign in 1982, indicating that a ten percentage point increase in the unionization of the public sector (roughly two-thirds of one standard deviation from the mean union coverage figure) is associated with a 1.4 percentage point increase in the replacement rate.Footnote 15
Teachers in plans that also cover other state workers have a 5.3 percentage point lower replacement rate compared to plans that only cover teachers. More generous benefits for teacher-only plans could arise for several reasons, including the differential political power associated with smaller, well-defined bargaining groups, or other factors correlated with teacher-only plans, including differences in overall compensation resulting from differences in the demand for teachers relative to other state employees.
Another factor is coverage by Social Security. Teacher-only plans are more likely to be outside the Social Security system than plans that cover teachers and state employees. Participation in Social Security is expected to be associated with less generous employer-provided retirement plans – though as shown in Table 4, the combined plans not in Social Security offer higher replacement rates than teacher-only plans not in Social Security. Still, when the Social Security variable is added to the equation, the estimated coefficient is negative and implies that, holding other factors constant, participation in Social Security reduces the replacement rate from the pension by roughly ten percentage points, a magnitude similar to the differences in the mean replacement rates reported earlier. (This finding is consistent with that in Clark et al., Reference Clark, Craig, Ahmed, Gary and Olivia2009.) Adding the Social Security variable to the specification reduces the magnitude of the coefficients of all of the other variables, and the unionization and plan coverage variables become statistically insignificant.
With one notable exception, the results for the 2006 regressions are qualitatively similar to those for 1982. The exception is the union variable. The coefficient on that variable changes sign in 2006, though the absolute value of the coefficient is roughly unchanged. In 1982, the states with the highest unionization rates also had the highest replacement rates. The ten most unionized states had a mean replacement rate of 53.1%; whereas the mean for the ten least unionized states was 49.9%. However, in 2006 the low-union states actually had higher mean replacement rates than the high-union states (56.7% versus 55.2%).
In addition, in the 2006 model, the magnitude of the plan coverage variable increases by roughly one percentage point. Now, the inclusion of other state employees in the same pension plan with teachers lowers the replacement rate for teachers by 6.4 percentage points. Column 4 shows that including the Social Security variable in the 2006 regression reduces the importance of including other state employees in the plan. The Social Security variable indicates that teachers who do not participate in Social Security are in retirement plans that provide an 11.5 percentage point higher replacement rate.
The results shown in the first four columns of Table 4 suggest some quantitative difference between the factors that explain the replacement rates in 1982 and 2006. To further test the possibility that the influence of these variables changed over time, we pooled the observations from 1982 and 2006 and created a dummy variable that takes the value one for 2006, zero otherwise. The 2006 dummy suggests that replacement rates increased by roughly six percentage points during the period.
4 Conclusion
We have provided a brief history of the development of teacher retirement plans since the first plans were established in the second half of the nineteenth century. This history helps us understand the evolution of these plans, including their subsequent changes, among which their merger with plans for other state employees in many states and their interface with Social Security are the most salient. The main story of the past quarter century has been the increased generosity of teacher retirement plans. Normal retirement ages have been reduced, generosity parameters increased, and the number of years in the salary averaging period have been reduced. As a result, replacement rates for an employee with 30 years of service rose by 5.5 percentage points (10%), between 1982 and 2006. The history we provide may raise concerns for the sustainability of the current generosity of teacher retirement plans, especially in light of the emergence of very large unfunded liabilities associated with retiree health benefit plans that are provided by most states (Clark, Reference Clark, Craig, Ahmed, Gary and Olivia2009).
We have explained the variation in benefits across teacher retirement plans and how these differences have changed during the last 25 years. Several important findings dominate the analysis. First, population growth, perhaps a proxy for economic development more broadly defined, has led states to be more generous with their teacher pension plans. States that have seen their populations grow dramatically have tended to increase teacher replacement ratios. We suspect that this is due to a combination of greater demand for teachers and growing state economies.
Second, the impact of public sector unionization on the generosity of the states' public sector pension plans has changed over time. In the early 1980s, unionization had a positive impact on pension replacement rates, presumably reflecting the greater bargaining power associated with a greater incidence of unionism in the public sector. Swings in unionization of only a few percentage points had relatively large implications for the differences in plan generosity. However, by 2006, the union effect had changed its sign. Today, the extent of unionization among public sector workers has a negative impact on the state's replacement rate.
Finally, we find that participation in Social Security reduced the typical worker's replacement rate from their state retirement plan by around ten percentage points. In a statistical sense, this impact was strong, as when the Social Security variable was included, it dominated all other effects. However, in an economic sense, whether the results indicate a large or small cost for participation in Social Security depends on any reduction in employee contributions to the state plan for those workers covered by Social Security and the overall benefits associated with Social Security coverage relative to the size of the payroll tax, a subject which the authors are currently investigating.