Introduction
The first wave of the baby-boom generation, i.e. the large post-Second World War cohorts, is reaching retirement age. The baby boomers will soon comprise a considerable proportion of tomorrow's older population, and with their distinguished generational characteristics (e.g. Edmunds and Turner Reference Edmunds and Turner2002), it is expected that they will socially and culturally shape the whole senior segment. In Denmark, the highest peak in birth rate was observed in 1943–1948, and these cohorts make up 31 per cent of the Danish population aged 65 and above today (Statistics Denmark 2013).
Previous scholarship has suggested that the ageing baby boomers are also likely to have a major impact on future transportation demand (Coughlin Reference Coughlin2009), although what this impact may be remains unclear. On the one hand, traditional transportation research scholarship assumes, based on previous cross-sectional findings, a general decrease in travel and car use as a consequence of population ageing (e.g. Metz Reference Metz2012; Páez et al. Reference Páez, Scott, Potoglou, Kanaroglou and Newbold2007; Rosenbloom 2011). This decrease has been largely attributed to old-age retirement from employment and the consequent decrease in commuting travel, along with an implicit assumption about age-related decline in out-of-home activities. On the other hand, previous studies have demonstrated higher travel activity, driver licensing rates, car access and car use amongst baby boomers than amongst older cohorts (e.g. Hjorthol, Levin and Siren Reference Hjorthol, Levin and Siren2010; INFAS and DLR 2010; Miranda-Moreno and Lee-Gosselin Reference Miranda-Moreno and Lee-Gosselin2008; Newbold et al. Reference Ottman2005; Ottman Reference Ottman2010). However, whether the boomers' high travel activity and reliance on cars will continue as they reach old age has remained unclear. This study reveals the baby boomers' mobility activity as they age and pass the ‘old age milestone’ of retirement. To distinguish the effects retirement has on their mobility patterns over time, we investigate the mobility patterns of three groups of Danish baby boomers that differ in their employment status.
The emergence of theoretical concepts such as the third age has challenged the previously common view of a slow but inevitable process of disengagement in old age. Third age, the years after retirement, are increasingly framed by consumption possibilities, second chances and new beginnings (Karisto Reference Karisto2007). The concept of third age has particularly been attached to baby boomers' ageing because, compared to previous cohorts, the baby boomers are healthier, lead more active lifestyles with different consumption patterns, attend various leisure activities, travel more often and over longer distances, and have more economic resources (e.g. Moschis and McArthur Reference Moschis and McArthur2007). In terms of transportation and mobility behaviour, that the baby boomers will differ from their parents or grandparents when growing old is likely (Siren and Haustein Reference Siren and Haustein2013). Their lifecourse has been shaped very differently, and they are the first generation to be born into and live their entire lives in a society with modern mobility, characterised by automobility and long-distance leisure travel (Coughlin Reference Coughlin2009).
Whilst several previous studies have forecast that baby boomers' high reliance on cars is likely to continue after retirement (e.g. Goulias et al. Reference Goulias, Blain, Kilgren, Michalowski and Murakami2007; Newbold et al. Reference Newbold, Scott, Spinney, Kanaroglou and Páez2005; Rees and Lyth Reference Rees and Lyth2004), some recent studies also point towards an increased use of alternative modes of transportation, possibly due to economic factors (McGuckin and Lynott Reference McGuckin and Lynott2012; Samus Reference Samus2013). In addition, the boomers are a heterogeneous group with varying mobility preferences and resources, as reflected in their mobility choices (Siren and Haustein Reference Siren and Haustein2013). Moreover, the impact of ageing boomer women is especially not well understood. In previous cohorts, women have been prone to cease driving earlier than men, even whilst still fit to drive, but whether such behaviour is likely to continue remains unknown (e.g. Rosenbloom Reference Rosenbloom2006; Siren Reference Siren2005). Women's level of education and involvement in working life is also greater in the younger cohorts than in the previous ones, a difference that may have an impact on their transportation needs and preferences (Coughlin Reference Coughlin2009).
Because the first wave of baby boomers is only now reaching retirement age, the anticipated effects of their retirement have so far been based on cross-sectional comparisons of transportation mobility in different cohorts. This paper is the first to investigate the impact of retirement on baby boomers' mobility patterns in a longitudinal setting. We examine how retirement impacts transportation mobility by following three groups of Danish baby boomers over a two-year period around retirement age, with a focus on their transport mobility and car use. By comparing baby boomers who continued to work throughout this period (‘still working’), boomers who were already retired at the baseline (‘early retirees’) and boomers who retired during the period (‘recent retirees’), we were able to distinguish between effects related to age and retirement.
Method
Sample and procedure
Data for this study were collected by interviewing a sample of Danish individuals born in 1946 and 1947 at baseline in 2009 (N = 1,772) and at follow-up in 2012 (N = 864). For the purposes of this paper, only the participants that took part in both the baseline and follow-up survey (N = 864) are included.
For the first survey, a random sample of citizens born in 1946 and 1947, i.e. in the peak years of the baby boom, was drawn from the Danish Civil Registration system, a nationwide centralised register of personal information of all individuals residing in Denmark. At the follow-up, a random sample of the participants in the first sample was contacted. The baseline interviews were conducted in November and December 2009, with the follow-up interviews in January and February 2012. The data were collected by means of standardised computer-assisted telephone interviews carried out by Ipsos Marketing (at the time Synovate Denmark A/S).
We chose the 1946 and 1947 cohorts not only because they represent the very peak years of the baby boom in Denmark and thus constitute the most typical boomer cohorts but also because we expected, given national statistics, that choosing people aged 62 at the baseline would allow us to form groups of respondents that would either be retired, retire during the period or continue working. Whilst the old-age pension age for these cohorts is 65 years, the national census data reveal the following retirement statistics at the end of 2011: about 50 per cent of the population aged 62 years, 59 per cent of the population aged 63 years, 64 per cent of the population aged 64 years and 75 per cent of the population aged 65 (Statistics Denmark 2013).
In all, 1,772 interviews were conducted in 2009 and 864 in 2012. The total sample drawn from the register in 2009 was 3,530 persons. For 3,129 of these (88.6%), a telephone number could be identified, and they received a letter announcing the survey. Moreover, 135 of the 3,129 telephone numbers (4.3%) turned out to be incorrect or invalid. When the intended number of interviews had been reached, another 452 persons (14.4%) were not called. Thus, a total of 2,542 persons were contacted for an interview in 2009. Of these, 277 persons (10.9%) could not be reached, 354 persons (13.9%) declined and 139 persons (5.5%) could not be interviewed due to language problems, cognitive impairment or intoxication. The overall response rate in 2009 was therefore 69.7 per cent.
In 2012, a random sample of respondents from 2009 was drawn (N = 1,255). For 1,159 persons, a telephone number could be identified, and they received a letter announcing a follow-up interview. Twenty-five of the 1,159 telephone numbers were incorrect or invalid, and one person was not called because the intended number of interviews had been reached. A total of 1,133 persons were contacted in 2012 for an interview. The overall response rate in 2012 was 76.2 per cent (4.6% not reached, 16.6% declined, 2.6% not able to carry out an interview).
The survey was conducted in Danish, thereby excluding any individuals who did not speak the language. However, we estimate that in the target population only a small share does not speak Danish. According to Statistics Denmark, only 4.7 per cent of the population belonging to the studied cohort were born abroad, and a majority of these have obtained Danish citizenship, indicating mastery of the Danish language.
Measures
The standardised interviews were based on an ad hoc questionnaire. The interviews took an average of 25 minutes to complete. In this section, we describe in detail the parts of the questionnaire that are relevant to the analyses in this paper.
Background information
Background information included gender, education, employment status, family status (married or living with a spouse, single, widowed), personal income and health status. As an objective measure of health status, the participants were presented with a list of 20 symptoms and illnesses and asked to indicate whether they suffered from these as confirmed by a physician. This list was derived from previous studies with a similar setting and subjects (e.g. Siren, Hakamies-Blomqvist and Lindeman Reference Siren, Hakamies-Blomqvist and Lindeman2004). In addition, the participants were asked to rate their overall health on a four-point rating scale (1 = excellent; 4 = poor).
Licensing and car use
Individuals were asked whether they had a driving licence. If so, they were asked their annual mileage at the time of the interview, their driving frequency and their access to a car (as a driver). Driving frequency was assessed with a six-point rating scale (ranging from 1 = every day to 6 = never). Participants were also asked who chauffeured them most frequently and whom they chauffeured most frequently. The alternatives presented included their spouse, children or grandchildren, other family members, friends and people whom they did not know personally.
Modal choices and travel purposes
Modal choices and travel purposes were assessed by participants' specifications about nine everyday activities (see Figure 2 for the list of activities). Individuals were asked about the activity frequency [six-point scale from 1 = (almost) never to 6 = (almost) every day] and the most common mode of transportation for each activity. For information about unmet travel needs, they were further asked if they wished to perform the activities more often (1 = a lot more often; 2 = somewhat more often; 3 = not more often).
Analysis
To test for significant differences amongst the three groups of different employment status, we used Pearson's χ2 test, the Kruskal–Wallis H-test and analysis of variance (including Scheffé's post hoc test) depending on the scales of measurement (nominal, ordinal, interval). To test for changes from 2009 to 2012 within each group, we used tests for related samples, namely McNemar's test (nominal scale), Wilcoxon test (ordinal scale) and t-test (interval scale).
Respondents
For the purposes of this paper, only the participants that took part in both the baseline and follow-up survey are included. These respondents consisted of 446 women and 418 men. Most had a spouse (80.7% were married or co-habitating), whilst 13.5 per cent were single and 5.8 per cent were widowed. Compared to census data on cohorts aged 62–63 in 2009 (Statistics Denmark 2013), the sample was representative in terms of gender, income and family status, whereas the educational level was somewhat above average. More specifically, 51.6 per cent of the respondents were female (of target population, 50.1%); 5.8 per cent were widowed (of target population, 6.6%); 19 per cent had basic school education only (of target population, 31.6%); 33.2 per cent had obtained higher education (of target population, 20%); and the samples average income was €37,000 (target population, €40,100). Whilst the education level of the respondents was higher than the average in the target population, the average income was slightly lower. This discrepancy may be because some respondents have confused gross income with net income, leading to a lower average income.
The respondents, according to their self-assessment, were generally healthy and well functioning. They described their health on average as somewhere between good and excellent (mean = 1.55 and 1.52 on a four-point scale in 2009 and 2012, respectively). People who took part in both surveys (N = 864) did not differ significantly from people who took part only in the first survey (N = 908) with regard to all background variables (gender: χ2-test, p > 0.10; family status: χ2-test, p > 0.10; income: F-test, p > 0.10; education: χ2-test, p > 0.10).
The three employment groups
To make the groups of different employment status as distinctive as possible, we used a combination of the variables on self-reported employment status in 2009 and 2012 and the reported weekly working hours to define the groups as follows. Still working means that respondents described their employment status as ‘employed’ or ‘self-employed’ and worked at least 20 hours a week, both in 2009 and 2012. A maximum of five hours difference was allowed in the weekly working hours between the two observation points. Early retirees means that respondents described their employment status as ‘retired’ both in 2009 and 2012, and did not work more than ten hours a week at either observation point. Recent retirees means that respondents described their employment status as ‘employed’ or ‘self-employed’ and worked at least 20 hours a week in 2009 but in 2012 described their employment status as ‘retired’ and were not working more than ten hours a week.
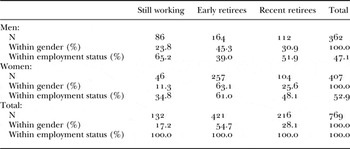
Table 1 shows the size of the groups broken down by gender. Whilst most men were still working, most women had retired earlier. In the group that changed work status (recent retirees), gender was fairly equally distributed. Analyses are thus done separately for both genders where relevant. Defining the groups so that both conditions were fulfilled – i.e. regarding employment status and working hours – meant that respondents with inconsistencies between the employment status and working hours (e.g. employed but working less than ten hours a week) were excluded from the analysis. In addition, any individuals that could not be assigned to one of the three groups, e.g. persons that did not retire but significantly reduced their working hours or persons that had retired but had started working again, were excluded. A total of 67 individuals were excluded from the analyses.
Absolute and relative frequencies of employment status groups by gender

Note: Gender is not equally distributed amongst working status groups: χ2, p < 0.001.
Whilst the respondents were in good health overall, the three groups differed significantly in their health status at the baseline, both in their subjective evaluation (H-test, p < 0.001) and for the mean number of symptoms as confirmed by a physician (F-test, p < 0.001). Of the early retirees, 53.4 per cent described their health as ‘excellent’, as did 58.3 per cent of recent retirees and 69.7 per cent of those still working. With 1.6 symptoms on average, the early retirees had a significantly higher number of symptoms than recent retirees (1.1 symptoms) and people still working (1.0 symptoms) (Scheffés post hoc test, p < 0.001).
Also at the follow-up, the early retirees had the highest number of symptoms (1.8 symptoms) compared to recent retirees (1.3 symptoms) and those still working (1.0 symptoms) (Scheffés post hoc test, p < 0.001). At the follow-up, 10.9 per cent of the early retirees described their health as poor, whilst no one in the other two groups did so. Although the number of symptoms did not change between the baseline and the follow-up for the ‘still working’ group, both early and recent retirees showed a small but significant increase in average number of symptoms between the baseline and the follow-up (t-test, both p < 0.05). This increase, however, was not reflected in their subjective health assessment, which remained unchanged in all groups (Wilcoxon test, all p > 0.10).
Results
Licensing and car driving
More than 90 per cent of the respondents were licensed drivers, albeit with a small but statistically significant difference in work status: a larger share of early retirees never had a licence (6.7% versus 2.3% in the other groups, both 2009 and 2012, χ2-test, p < 0.05). Although licensing differences amongst employment status groups were in general greater for women than for men, the group sizes did not allow for testing for statistical significance of these differences.
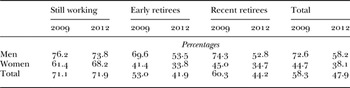
As Table 2 shows, the differences amongst the three groups were much more pronounced in terms of the frequency of car use, both at the baseline (H-test, p < 0.001) and especially at the follow-up (H-test, p < 0.001). Comparing the situation at the baseline and at the follow-up, we find those still working showing no reduction in their driving frequency, whereas the share of those driving daily significantly declined amongst both recent retirees and early retirees (Wilcoxon test, p < 0.001). Patterns amongst and within employment status groups were similar for men and women, with two exceptions. First, compared to men, women had a lower overall frequency of car use. Second, the group of women still working in 2012 had higher car use at the baseline than the other groups.
Driving a car daily by employment status and gender

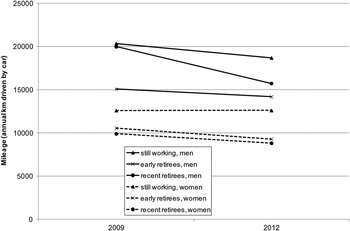
Kilometres (km) driven also varied according to employment status at the baseline, with those still working driving most (annual mileage 2009: 17,742 km; 2012: 16,665 km), followed by recent retirees (15,277 km; 12,547 km) and earlier retirees (12,449 km; 11,336 km). The differences amongst the three groups were significant in 2009 (F-test, p < 0.001) and in 2012 (F-test, p < 0.001). Early and recent retirees showed a significant reduction in mileage between 2009 and 2012: for early retirees the annual mileage decreased by 1,114 km (t-test, p < 0.001) and for recent retirees it decreased by 2,729 km (t-test, p < 0.001). Breaking down this finding by gender reveals that employment status is much more relevant for men's than for women's mileage (see Figure 1). Whilst for women, the reduction in mileage is similar for the recently and earlier retired, for men the reduction is much more pronounced amongst the recent retirees. This finding indicates that the car has higher relevance for work trips for men than women. Interestingly, amongst the ‘still working’ group, women demonstrate a slight increase in car use between the two observation periods whilst men show a decrease. These changes, however, are not statistically significant.
Kilometres (km) driven by working status and gender.

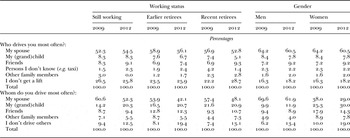
The groups did not differ significantly by whom they drove most often or by whom they were driven most often (see Table 3). This finding applies to both the baseline and the follow-up (p > 0.10). In all groups, there was a reduction in driving others over time. This reduction, however, was greatest amongst early retirees, where the share of those not driving others more than doubled within the two-year period, and only in this group was the change statistically significant (p < 0.01).
Being driven by others and driving others by working status and by gender

As to driving others and being chauffeured, significant gender differences appeared both at the baseline and at the follow-up (see Table 3; all p < 0.001). Whilst for most men, their spouse was the person they drove around most often, women tended to drive various people. More women than men reported not driving others. A look at the frequencies of driving others (only assessed at the second survey time), shows significant gender differences in driving the spouse, an activity more typical for men, 45 per cent of whom chauffeured their spouse at least two to three times per week, whilst only 15 per cent of women did so (U-test, p < 0.001). Women reported being driven around by their spouse more frequently than men (U-test, p < 0.001), and a significantly larger share of men (30.3% at the baseline; 33.5% at the follow-up) than women (16.3% at the baseline; 18.2% at the follow-up) reported not being driven around at all by other people. Women, however, were slightly more often involved in driving grandchildren and other family members: whilst 28 per cent of women drove their grandchildren at least weekly, only 21 per cent of men did; for driving other family members the shares were was 5 and 3 per cent, respectively. Neither of the differences, however, were statistically significant (p > 0.10).
Travel purposes
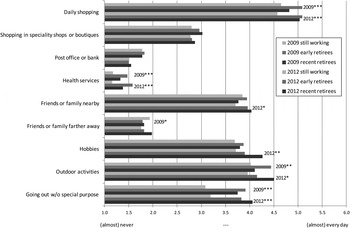
The groups differed somewhat in terms of frequency of conducting various everyday activities (see Figure 2, also for level of significance). At the baseline, early retirees conducted leisure activities more often than the two other groups that were still working at that time. However, at the follow-up, the recent retirees were most active in leisure activities. Early and recent retirees also travelled more often for health services, probably reflecting the association between health status and reasons for retiring. Going out without a particular purpose appears to become more relevant after retirement, as suggested by the large difference between those still working and those retired either recently or earlier. Curiously, recent retirees were already more active in this respect pre-retirement. This finding cannot be explained by the different gender distribution of the groups, as differences between the employment status groups are similar for men and women.
Mean frequency of different activities in 2009 and 2012.

Within the groups we find a significant increase in different leisure-time activities for the group that retired between the baseline and the follow-up (hobbies: p < 0.001; outdoor activities and going out without a special purpose: p < 0.05), whilst the early retirees reduced their outdoor activities (p < 0.05) and the group that was still working showed no significant changes.
Modal choices
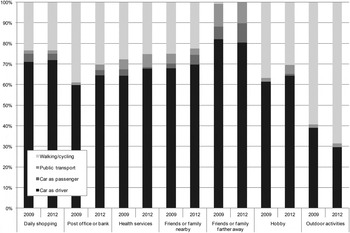
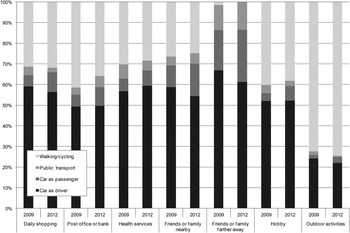
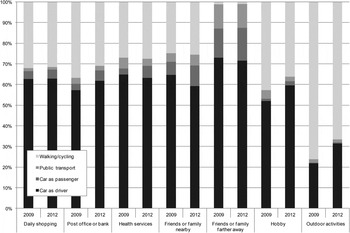
The groups differed in their main mode of transportation in connection with trips for different purposes (see Figures 3–5). The early retirees used the car somewhat less as a driver and more as a passenger than those still working. The recent retirees fall between the two other groups. Although no significant changes appeared amongst those still working, the early retirees reduced their level of car driving in favour of travelling in a car as a passenger. The change is significant (p < 0.05) for daily shopping and visiting friends farther away. In contrast, the recent retirees showed a significant (p < 0.05) increase in car driving for private errands and outdoor activities at the expense of the use of non-motorised modes. Differences amongst the groups were similar for women and men. Nevertheless, women's overall car use was lower than that of men's and those women still working in 2012 were already more reliant on cars at the baseline than the (future) retirees.
Main transport modes used in 2009 and 2012 for the group still working.

Main transport modes used in 2009 and 2012 for early retirees.

Main transport modes used in 2009 and 2012 for recent retirees.

Discussion
This study is the first to investigate, at the individual level, the changes in transportation mobility amongst retiring baby boomers over time. To examine how retirement may affect their mobility patterns, it used longitudinal survey data to compare three distinctive groups of Danish baby boomers that differed in their employment status.
The baby boomers in this study were in general healthy, independent and highly (auto)mobile, with good access to personal transportation and private cars. Nevertheless, they showed a clear tendency to reduce car use and mileage over time and, apparently, as a consequence of retirement. Using a car daily was much more common amongst those who were still working, whereas for those retired, the mileage decreased significantly between the observation periods. As retirement, however, also means increased leisure time, the findings indicated that with retirement, the baby boomers travelled more often for leisure purposes, increasing their car use for these trips. In other words, even if the overall level of car use decreased after retirement, car use for certain leisure purposes increased after retirement.
We found that retirement had a bigger impact on men's car use than on women's, likely reflecting the fact that many women use other modes of transportation for commuting to work. Interestingly, those women who were still working at age 65 had a high car reliance that did not show decline over time, as opposed to their male counterparts, whose mileage slightly decreased over time. It is likely that those women who had not retired had high-income jobs that both motivated their prolonging their career and economically enabled their active car use.
Finally, although we observed a general decrease in chauffeuring others, that decrease was significant only for early retirees. For all groups, the spouse was most often the person that people both chauffeured and were chauffeured by. Women in general reported being chauffeured around more frequently than men, especially by their spouse, whereas men predominantly reported that they were not driven by others but often chauffeured their spouse. This finding is consistent with those of previous studies showing that older women are more likely than older men to ask for and receive transportation support from others (Choi, Adams and Kahana Reference Choi, Adams and Kahana2013; Collia, Sharp and Giesbrecht Reference Collia, Sharp and Giesbrecht2003; Kostyniuk and Shope Reference Kostyniuk and Shope2003).
The baby boomers, especially women, are often referred to as ‘the sandwich generation’ (Rosenbloom and Fielding Reference Rosenbloom and Fielding1998: 91), taking care of both their parents and (grand)children (Fingerman et al. Reference Fingerman, Pillemer, Silverstein and Suitor2012). Not surprisingly, our results indicated some level of informal care-giving through transportation. Although driving older parents played only a minor role in baby boomers' transportation, about every fourth baby boomer drove his or her grandchildren at least weekly. This finding is in line with previous results on baby boomers' intergenerational relations and care-giving, showing that the boomers are often more involved with their children than with their ageing parents (Fingerman et al. Reference Fingerman, Pillemer, Silverstein and Suitor2012). We also observed some gender-related differences: whilst men reported chauffeuring others (primarily their spouse) more frequently, women tended to chauffeur a wider variety of passengers: friends, grandchildren and others. Nevertheless, we found no statistically significant evidence for women having greater transportation-related social responsibilities for their grandchildren or parents.
The previous transportation literature has established an association between increasing age and decreasing travel activities (see Metz Reference Metz2012; Páez et al. Reference Páez, Scott, Potoglou, Kanaroglou and Newbold2007; Rosenbloom 2011), and attributed this association largely to old-age retirement and the consequent cessation of commuting. This study suggests that for baby boomers, as for the previous cohorts, retirement is also a transition point associated with decreasing car use – in terms of both frequency and mileage. In that sense, the ageing of the population is likely to have a decreasing effect on transportation demand and car travel. However, given the trend towards prolonged careers (Coughlin Reference Coughlin2009; Samus Reference Samus2013), this age-related effect is likely to appear later in the lifecourse for the coming cohorts of older people. The findings from this study, and especially the trend observed amongst still-working women towards not reducing car travel with increasing age, suggest that the decrease in driving is related not only to increasing chronological age but also to the transition from work to retirement. The emergence of atypical working-life patterns amongst seniors, including part-time retirement or work, informal work and volunteering, is also likely to make the effect less straightforward or predictable (Coughlin Reference Coughlin2009).
Another factor influencing the travel demand related to population ageing is the increase that retirement allows in leisure activities (Arentze et al. Reference Arentze, Timmermanns, Jorritsma, Kalter and Schoemakers2008). The findings of this study reflect the importance of this factor. Some have argued that consumption in particular defines not only the group of baby boomers but also the entire concept of third age (Gilleard and Higgs Reference Gilleard and Higgs2007). In this sense, the baby boomers might have more active and varied leisure-time consumption patterns for transportation than previous generations. The present study indicates that the baby boomers are reliant on cars in their leisure travel and that leisure travel, especially by car, increases post-retirement. Leisure travel is less thoroughly understood than commuting and is more strongly affected by individual lifestyles and consumption patterns (Scheiner 2010). Consequently, the transportation system today predominantly serves the needs of commuters, and efforts to create a more sustainable transportation system are targeted mainly at commuting. However, given that up to 25 percent of the population will not commute but rather actively pursue leisure activities, a better understanding of the choices related to leisure travel is needed. Studies more explicitly focusing on lifestyles may be helpful in this regard (see also Götz and Ohnmacht Reference Götz, Ohnmacht, Grieco and Urry2012; Lanzendorf 2002).
This study has the advantage of a longitudinal design and a large and representative sample, allowing us to distinguish between effects related to retirement and age-related effects on mobility behaviour. Nevertheless, the follow-up period was not very long, and we could capture only the short-term effects of retirement. In addition, factors such as health and economic resources are likely to influence both retirement and travel decisions, and create confounding effects. That confounding effects were not directly controlled for may limit the generalisability of the findings. Constructing a model predicting travel activity out of a number of determinants was not within the scope of the present paper. Thus, to more precisely forecast travel consequences followed by retirement or other similar transitions and to establish causality, future research should study the confounding effects and the possible correlations between various factors related to retirement and travel decisions.
This study investigated Danish baby boomers, as Denmark is comparable to other European countries in demographic structure, the emergence of the post-war baby boom, the socio-cultural characteristics of the large post-war cohorts and retirement ages. Nevertheless, Denmark is a small, densely built, high-income country with an extensive public welfare system. The geographical density of Denmark may mean that fewer people are reliant on cars than in some other countries, possibly causing a somewhat larger share of travellers to commute by means other than private car. Hence, the reduction in car use as a consequence of retirement may be less marked in Denmark. Moreover, the Danish welfare model may create a very particular social environment for ageing and thus influence the retirement transitions and their implications for everyday living. However, although some of the specific findings of this paper may be limited to Denmark, this study remains the first to analyse baby boomer travel patterns in a longitudinal setting, with a representative sample of individuals, many of whom go through retirement transitions. Thus, this paper is likely to have value as a reference point for future studies of countries with different contexts.
Finally, one factor likely to influence the results of this paper is that women generally stop working earlier than men. Women who were still working at the time of the second survey are likely to be a more specific and less representative group than men who were still working. Indeed, the still-working women showed some distinctive patterns, e.g. a higher car reliance that increased over time. Previous research has shown that professional women show a higher attachment to their work and greater difficulties with the transition to retirement than non-professional women (Price 2002). Thus, the still-working women may gain individual fulfilment from their work and continue working as long as possible. Although this group comprises a small share of the studied cohort, it is a distinct one that is expected to grow in future cohorts (Coughlin Reference Coughlin2009). Future studies of this particular group might provide some insight into the future mobility behaviour of ageing professional women.
As a growing number of people keep on working into old age or opt for flexible and informal arrangements, the traditional concept of retirement is clearly changing (Coughlin 2009; Samus 2013). In this study, we chose to distinguish amongst the three groups of respondents by using a combination of both self-reported employment status (retired versus employed or self-employed) and reported weekly working hours. Had we used only the respondents' self-reported employment status, the differences may have been smaller, as some retirees actually reported continuing to work many hours per week. The survey did not cover volunteer work or other informal arrangements. In addition, our construction of the different groups meant that those respondents who described themselves as ‘retirees’ yet reported working over ten hours a week were not included in the analysis. Their response might imply some atypical arrangements, and excluding them from the analysis might have impacted the findings.
Whilst retirement is a transition point that impacts travel behaviour and individuals' transportation needs, the nature of this transition appears likely to change for new cohorts of older persons. The atypical and flexible working arrangements, informal care-giving, women's changing professional roles, and the expansion of leisure and consumption as major cultural and social frameworks of the third age, are elements clearly perceivable in the baby boomers' mobility behaviour. Thus, forecasts for future travel demand should not only consider demographic changes in terms of population ageing but also take into account the social and cultural transformations of old age.
Acknowledgements
The work was part of the project ‘Drivers and Limits for Transport – Possible Contributors for Climate Change’, funded by the Danish Council for Strategic Research. The study was approved by the Danish Data Protection Agency (J.nr. 2009-54-0751) and the National Board of Health (J.nr. 7-505-29-1257/2) for the processing of the respondents' personal data. The authors declare that both authors have made substantial contributions to conception and design, and/or acquisition of data, and/or analysis and interpretation of data; that both authors have participated in drafting the article or revising it critically for important intellectual content; and that both authors have approved the final version. The authors certify that they have no affiliations with or involvement in any organisation or entity with any financial or non-financial interest in the subject matter or materials discussed in this paper.