

1. Introduction
In theory, cheaper and more widely available environmental goods (products such as wind turbines that facilitate the transition to sources of energy that have lower greenhouse gas emissions) are a positive development. The international community is facing a climate crisis, and the widespread adoption of cleaner energy sources is generally regarded as a primary and essential element of addressing this crisis. Government subsidies for environmental goods, at first sight, would seem to be a welcome policy choice. They address the issue that the social costs of high carbon energy sources are higher than the private costs. By facilitating the switch to lower carbon energy sources, subsidies of clean energy promote the goal of pollution reduction (given a context characterized by lack of appropriate carbon taxes due to political infeasibility of such taxes in major economies).
The international response to subsidies, however, has been anything but encouraging thus far. The United States (US), the European Union (EU), and China are arguably in a trade war over government support for environmental goods, including solar panels, wind turbines, and biofuels. In particular, the EU is imposing exceptionally large antidumping duties (ADs) and countervailing duties (CVDs) on Chinese environmental goods and US biodiesel. The US is imposing large ADs and CVDs on Chinese environmental goods. Also, China is imposing CVDs on the US, EU, and South Korean environmental goods (Kasteng, Reference Kasteng2013; Lewis, Reference Lewis2014b). This tit-for-tat application of domestic trade remedies on environmental goods has raised domestic prices for consumers in major markets, and potentially chilled investment by making the future market for these goods uncertain.
States are making some multilateral efforts to liberalize trade in environmental goods by lowering bound MFN tariff rates through the WTO and ASEAN, but these efforts are not gaining traction. States have not even been able to reach a consensus on the definition of environmental goods, and there seems to be little political support to push forward quickly. Moreover, none of the existing draft agreements exempts environmental goods from domestic trade remedies (AD/CVDs/safeguards), which can have a much bigger impact than the MFN tariff rate on the retail prices of these goods. Finally, although the Subsidies and Countervailing Measures (SCM) Agreement used to have a carve-out for environmental goods, there also appears to be no political will to revive it.
Because of the political difficulties in making progress on a new agreement, commentators have frequently looked to the WTO Appellate Body (AB) to craft trade law decisions that would have the effect of liberalizing the trade in environmental goods (Cosbey and Mavroidis, Reference Cosbey and Mavroidis2014). This includes calls for the AB to provide wide flexibility for states to adopt a pro-environmental policy under GATT Article XX and under the SCM agreement (Howse, Reference Howse2013). In addition, there has been some hope that the AB would restrict the conditions under which WTO members could apply domestic trade remedies to environmental goods (Wu and Salzman, Reference Wu and Salzman2013).
Against this background, we analyze the present AB decision, US–Countervailing Measures (China).Footnote 1 This case addresses the US application of countervailing duties (CVDs) on a number of products, two of which are environmental products (solar panels and wind turbines). We focus our analysis on these goods, although the AB does not discuss CVDs on these two goods any differently than any of the other challenged goods.
We argue that: (1) although China ‘won’ this case, the AB decision did not meaningfully restrict the application of CVDs to environmental goods in future cases; (2) from an economic viewpoint, this is likely to be welfare-reducing to the extent that the reduction in international prices due to these policies is not strong enough to compensate for the increase in domestic prices and for the domestic distortions of the CVD; (3) that to make any real progress on more liberalized trade in environmental goods, we need to move away from a reliance on the AB and focus on gaining political support for a new agreement.
2. The legal perspective
2.1 The Appellate Body's ruling
The AB decision in this case addressed the United States Department of Commerce's (USDOC) application of CVDs on 17 products from China. The primary issue that the AB resolved concerned the investigating authority's (the USDOC) creation of a benchmark to evaluate the producer's benefit from the alleged Chinese government subsidy. The SCM Agreement requires both that the government offers a subsidy and that domestic firms receive a benefit from the subsidy for an importing state to impose a CVD (SCM Article 1.1). The importing country can impose a duty only up to the point that the foreign government subsidy provided the exporting firm with a benefit (SCM Article 14(d)). This appeal addresses the methodology by which an investigating authority can determine the benchmark for evaluating the benefit of the government subsidy. Specifically, this dispute between the US and China concerns how the US (the investigative authority) calculates the level of benefit from a firm's receipt of below-market-price inputs from the Chinese government (the subsidizing government). When a government provides a subsidy through below-market-price inputs, the value of the subsidy is not directly transparent (as a cash subsidy or tax credit would be). The value of the subsidy is determined by reference to the market value of the good (SCM Article 14(d)). The dispute in this case concerned how an investigating state can determine what the ‘market benchmark’ is for calculating the firm's benefit from the subsidy. The AB cut a middle ground between the two member states’ arguments, determining that US procedures are inconsistent with the SCM Agreement, but also rejecting China's argument that the activities of state-owned enterprises (SOEs) that are not acting as public bodies can never be relevant to the choice of the market benchmark.
The critical issue in this case hinged on the US measurement of the Chinese firms’ benefit from the government subsidy. The SCM Agreement requires investigative authorities (the government applying the CVD) to perform a ‘subsidy-offered’ analysis and a ‘benefit-received’ analysis as part of its CVD regulatory process. The SCM Agreement is symmetrical in that the subsidy that the government offers and the benefit that the firm receives must be opposite sides of the same transaction. This requirement becomes an important point for the present Appellate Body decision. The level of benefit that the firm receives must be tied to the government subsidy (rather than any advantage that the firm receives from sources other than the government). In the first analysis, the panel looks to see if the government offers a subsidy. The subsidy can come from any number of sources, including government guaranteed loans (lowering the interest rate to the firm and costing the government nothing if the firm repays the loan), tax credits, direct payments, the supply of inputs at below-market prices, or the purchase of the producer's goods at above-market prices. The benefit to the firm may be greater than the cost to the government of offering the subsidy (for instance, government guaranteed loans that the firm repays) or less than the cost to the government (for instance, direct subsidies that require the use of more expensive local products). The benefit to the firm must come only from the government subsidy, although the cost to the government of offering the subsidy does not need to match the firm's benefit.
China's argument was that the US's CVD procedures were decoupling the firm's benefit from the government subsidy from the CVD rate, and that the US's benefit methodology was setting a CVD rate that effectively included actions by the Chinese government and by SOEs that were not public bodies (the latter cannot give a subsidy under CVD rules). China's argument began by pointing out that past AB decisions have highlighted that ‘government’ subsidies can only come from the government directly or from public bodies – that is, organizations controlled by the government that provide a public function. SOEs can be, but are not necessarily, public bodies. The analysis of whether an SOE is a public body does not depend on the level of financial support the SOE offers to a firm or industry, but rather on whether the SOE is performing a ‘government function’ – that is, providing support that is part of the government's sovereign function. An SOE can be government-controlled – meaning the government can own a majority or controlling share of the company – and yet not be a public body because it does not perform any government functions (and thus should be treated like a private firm for CVD purposes).
The specific procedure that China challenged was the US's rejection of Chinese domestic prices for determining the value of the subsidy – inputs from the government that were sold to the firms at below market prices. Article 14(d) requires that calculation of a firm's benefit from the input supplied by the government be determined by comparing the price of the government-supplied input to the prevailing market price.Footnote 2 China and the US disagreed about when the investigative authority could reject ‘in-country’ prices (domestic Chinese prices) as the market benchmark to determine the level of the firm's benefit.
The benchmark is important because it establishes the level of benefit that the firm enjoyed by receiving below-market-price inputs from the government. For instance, if the domestic Chinese price for Widget A is $10 and the price of the government supplied Widget A is $6, then the benefit to the firm from the subsidy is $4. The maximum CVD per good that the investigative authority could then impose would also be $4 (as this is the extent of the firm's benefit). If the investigating authority rejects the in-country price because the market is distorted (and thus cannot establish a market price based on supply and demand), then the benchmark can be much higher. For instance, if the investigating authority selects State B as a the relevant country to supply the benchmark (because there is a market price there) and the State B's price for Widget A is $14, then the benefit that the firm receives from the subsidy jumps 100% to $8. Similarly, the maximum CVD that the investigating authority can now impose increases to $8 per good. Higher CVDs are adverse for exporting firms, but advantageous to import-competing firms in the investigating state (although firms in the investigating state that use the foreign good as an input are disadvantaged).
China next argued that the US procedures are de facto decoupling the government subsidy from the CVD rate because the US government was treating the actions of SOEs that were not public bodies as relevant to the benchmark. To make this next step, the Chinese government observed that the US government had rejected in-country prices for inputs because the US alleged that Chinese SOEs were distorting the domestic market and thus making it impossible for the US to formulate a Chinese ‘market price’ based on supply and demand. As such, the US rejected in-country Chinese prices and established a benchmark based on out-of-country prices. The US justified this decision because it claimed that only out-of-country prices could establish a ‘market price’ for the government-supplied input. The Chinese government highlighted that the actions of non-public-body SOEs (not government subsidies) were responsible for the difference between in-country prices and the out-of-country prices.
To make this (hopefully) clearer, consider the example of the USDOC's CVD investigation regarding Chinese inputs of polysilicon in solar panels. In that investigation, the USDOC simply noted that China had an ownership or management interest in 37 of the 47 producers of polysilicon in China. A government ownership interest does not turn a producer into a public body capable of providing a subsidy. Nonetheless, a high proportion of SOEs in a specific market can be sufficient to reject in-country prices as non-market based. The USDOC did reject in-country prices in this instance, stating, ‘we determine that the GOC [Government of China] is the predominant provider of polysilicon in the PRC and that its significant presence in the market distorts all transaction prices’ (para. 4.94).
This rejection of in-country prices can have the same functional effect (in terms of CVD rates) as treating non-public-body SOEs as public SOEs providing a subsidy. Where a non-public-body SOE market presence leads an investigating authority to reject in-country prices and adopt higher out-of-country prices, then that difference in country prices is functionally the same as a subsidy in terms of the CVD rate. For instance, if the unit price of polysilicon is $10 in China and $14 in the out-of-country price, the CVD rate can be $4 per unit higher if out-of-country prices are used (just as if the Chinese government gave a $4 per unit subsidy). Here the CVD rate increases by $4 notwithstanding the fact that the non-public SOEs cannot provide a subsidy under SCM rules. China argued that this US practice was inconsistent with the SCM Agreement because it violated the symmetry of the government offered subsidy being the source of the firm's benefit.
In less technical terms, the Chinese argument is essentially this: the US can only count government or public body support as a subsidy to the firm in either the ‘government offered’ or the ‘benefit received’ analysis. The US knows that it cannot count any support from non-public body SOEs through the front door, so it is counting non-public body SOEs’ support through the back door. That back door is the out-of-country price benchmark. Thus, China argued that the AB should require the US to use in-country prices as its benefit benchmark (and thereby disallowing the US practice of counting non-public body SOEs’ actions in the market in the ‘benefit-received’ analysis). The Chinese government made this argument textually by maintaining that there could not be two different definitions of the word ‘government’. China maintained that the SCM agreement could have only one definition of the term ‘government’ and thus the actions of non-public body SOEs should not enter into the benchmark analysis (paras. 4.37–4.39).
The US rejects this position, arguing that it was entitled to use out-of-country prices when there was not a domestic market to establish a market price based on supply and demand. Because the Chinese market was distorted by the predominant presence of SOEs, in-country prices would be artificially below true market prices. As a result, the US claimed that the only accurate way to value the firms’ benefit from the government subsidy was to adopt out-of-country prices. The US's position was not that it was entitled to count non-public-body SOEs’ activity as contributing to the subsidy, but rather that the only means of accurately determining the true value of the subsidy was to look to markets that were not distorted by SOEs’ activity. Thus, the US claim was an evidentiary one – that the only good evidence of true market prices existed outside of the Chinese market, and thus it could reject in-country prices – not a substantive claim that the US was justified in including non-public-body SOEs’ activity into the benefit analysis. Importantly, however, the US adopted a standard that presumed the Chinese market was distorted whenever the government or SOEs were the predominant provider of the input.
The AB forged a middle ground, rejecting China's argument that the US could never use out-of-country prices to establish a market benchmark, but also rejecting the US's SOE market presence approach by demonstrating that Chinese prices were in fact distorted. The AB began by accepting China's argument that there is only one definition of the word ‘government’ in the SCM Agreement (para. 4.42), but rejecting the idea that this meant that activities of non-public-body SOEs could not be relevant to the benefit benchmark. As the AB put it, ‘China's argument that there is a single standard for defining the term “government” does not answer the question of whether the prices of goods provided by private or government-related entities in the country of provision are to be considered as market determined for purposes of selecting a benefit benchmark’ (para. 4.43). The AB recounted how previous AB decisions explicitly allowed an investigating authority to reject in-country prices if there was not a domestic ‘market’ price because the market was distorted by government subsidies. Particularly in US–Carbon Steel (India) Footnote 3 and US–Anti-Dumping and Countervailing Duties (China),Footnote 4 prior AB rulings established that investigating authorities could reject in-country prices (and thus shift to an out-of-country price benchmark) when government activity in the domestic market had distorted prices. Citing US–Carbon Steel (India), the AB noted that it ‘would not be appropriate’ to use in-country prices when the government has used its market power to lower private prices of the input because ‘this would lead to a calculation of benefit that is artificially low, or even zero, [thus] the right of Members to countervail subsidies could be undermined or circumvented in such a scenario’ (para. 4.50).
Having established that investigating authorities could in theory reject in-country prices in the benefits analysis, the AB then raised the evidentiary bar for allowing them to do so. The AB emphasized that the link between government predominance in the market and price distortion was one that the investigating authority had to actually demonstrate before turning to out-of-country prices. The AB ‘clarified’ its decision in US–Softwood Lumber IV Footnote 5 by repudiating the idea that an investigating authority could adopt a per se rule that domestic prices were distorted anytime that a government was the predominant supplier in the market (para. 4.52). The AB further found that the USDOC had not adequately demonstrated that such a link existed in the CVD investigations of this issue because the USDOC had adopted a per se rule that government predominance could be equated to market distortion (para. 4.80). To be consistent with the SCM Agreement, the USDOC would have to perform a case-by-case analysis of whether the subsidizing state's domestic market was distorted by government action (by either public bodies or non-public body SOEs). The USDOC would additionally have to offer an adequate explanation of its methodology and how its determined markets were, in fact, distorted (para. 4.84). In short, the AB found that the US could not just assume that there was not a ‘real’ market in China simply because of the presence of SOEs.
2.2 Analysis of the ruling for future CVD cases
This decision continued the AB's attempt to put limits on states’ use of CVDs while accepting that members were entitled under the WTO Agreements to use CVDs under certain conditions. Indeed, the AB stated in its reasoning that it did not want to undermine or circumvent the ‘right’ of members to apply CVDs even to environmental goods (para. 4.50). The current decision did not go particularly far in restricting investigating authorities from using out-of-country prices in establishing a benefit benchmark. The AB did not put any substantive limits on the benchmark analysis. In rejecting China's position, the AB endorsed the idea that high out-of-country price benchmarks were more appropriate even when the in-country prices were influenced by non-public-body SOEs. The limits established by the AB in this case were procedural. The AB imposed new process requirements for investigating authorities before in-country prices could be rejected.
These new process requirements may end up being a rather loose binding on an investigating authority for several reasons. First, a big question going forward is how closely the WTO panels or AB are going to scrutinize a USDOC decision that the Chinese market is distorted by SOE activity. The AB seemed to show its hand that it would be sympathetic to findings of distortion when there is a large government presence in the market when the AB noted that ‘[a]lthough a government's predominance in the market makes it likely that prices will be distorted, the distortion of in-country prices must be established on the basis of the particular facts underlying each countervailing duty investigation’ (para. 4.51, emphasis added). Such a statement does not indicate that panels should give a hard look to an investigating state's determination that in-country prices are distorted. Rather, it indicates a fair level of deference to investigating authority's findings so long as they perform a case-by-case analysis.
Second, the AB essentially lays out a ‘WTO-compliance action plan’ for a CVD application that does not require much real change. Even though the AB completed the legal analysis in four of the CVD cases and found that the USDOC had erroneously rejected in-country prices for the benefit benchmark, the AB failed to say that the USDOC could not continue to reject in-country prices in future cases against the same products. For instance, in the solar panels CVD case, the AB determined that the USDOC had incorrectly rejected in-country prices because it ‘did not explain whether and how the relevant 37 producers possessed and exerted market power such that other in-country prices were distorted’ (para. 4.96). However, the AB's previous statement that government market predominance makes distortion ‘likely’ indicates that it would be receptive to a USDOC finding of price distortion (37 out of 47 firms were SOEs) if the USDOC had provided a case-specific analysis of how the market was distorted. The USDOC simply needs to clean up its procedures – by doing the case-by-case analysis – and it can effectively maintain its current policies. This case may be analogous to the US ‘loss’ in United States ‒Shrimp Footnote 6 where the AB found the US measures to be inconsistent with GATT rules. However, the AB effectively set out a path to compliance that is relatively easy for the US to meet. If the US made only modest changes to its policies, it might then be able to receive WTO approval for its policies through the DSU Article 21.5 compliance process. Thus, while the US ‘lost’ this case in the sense that the AB found the USDOC's rule to be inconsistent with the SCM Agreement, the effect of this ruling may give Chinese exporters little comfort.Footnote 7
The US may be more constrained in future cases by the panel's decision that the US erred by presuming that inputs provided by SOEs were government subsidies for the SCM 1.1(a) government contribution analysis. The panel found that the USDOC needed to provide an analysis of whether the SOEs were performing a government function. If not, then the SOEs would not be public bodies and any contribution from these entities would not be government contributions under the SCM Agreement. The US did not appeal this finding and thus the issue was not included in our review of the AB's decision. Nonetheless, this issue may prove to be more of a substantive constraint on the investigating authority in future cases if the AB establishes a narrow scope for government functions.
2.3 The (un)importance of benchmarks for environmental goods
For all of the previous analyses of benchmarks and SOEs’ activity, the importance of the AB's review of the CVD process (and all trade remedy processes) may be pretty minimal for liberalizing trade in environmental goods. Member states can play the system by applying these duties and then removing them after the WTO dispute resolution process finds them inconsistent with trade rules. Member states do not face any penalties for these actions and they do not even have to refund the past years’ duties. Particularly in environmental goods, where technological change is rapid, the WTO's slow pace has difficulty providing meaningful protection to these goods through the DSU's review of members’ CVD investigations. As a result, some broader (probably non-judicial) approach is needed to liberalize trade in this area.
The application of CVDs (as well as anti-dumping duties) is essentially a unilateral state process with WTO oversight of the outcomes. This means that member states can impose CVD/AD duties, wait to see if another state will take the case to the WTO, and then wait until the WTO review is complete before altering any of the duties. So long as the member state complies at the end of the WTO dispute resolution process, the breaching member state does not have to offer any compensation to the member injured by the breach (and does not have offer retrospective damages even if compliance is not forthcoming) (Schwartz and Sykes, Reference Schwartz and Sykes2002; Brewster, Reference Brewster2011).
The entire process can easily take three years or more. That is four years that the investigating authority can impose duties without any meaningful constraint by the WTO. In the present case, China was challenging the US's application of CVDs imposed between 2007 and 2012. The AB opinion was issued in December 2014, and the US has a ‘reasonable period of time’ after the decision to alter its policy. Thus, the US is able to impose duties unilaterally for three to eight years. In a fast turnover technology sector such as solar panels, three years is effectively the life of the product cycle (Horlick, Reference Horlick2013). By the time that the WTO is able to review a nation's CVD or AD process, the duty served its purpose and a new duty can be applied to the next generation of environmental goods. As a result, alternatives need to be found that bypass the CVD/AD domestic remedy process entirely.
3. The economic perspective
In this section, we discuss the economic aspects of the WTO Appellate Body's ruling in US‒Countervailing Measures (China) focusing on solar panels (SPs) and wind turbines (WTs). Subsection 3.1 presents the framework for the welfare analysis of both the subsidy imposed by China and the CVD imposed by the US government in response. The following subsections apply the framework to first the subsidy and then the CVD and present empirical evidence to answer the following questions: (1) Does the instrument address a market distortion and, if so, is that instrument the first-best tool to address the distortion? (2) Is the subsidy/CVD motivated by ‘strategic trade-policy’ goals? (3) Does the subsidy/CVD have an impact on social welfare in the rest of the world through the ‘terms-of-trade’ channel? (4) And could there political-economy motives behind the subsidy and CVD?
3.1 The welfare analysis framework
In order to analyze welfare effects, it is important to focus on some key aspects of the markets considered that are related to the size and structure of each country and to the existence of distortions. In particular, as we discuss the welfare effects, we will need to take into account the answers to the following questions:
1. Does a market failure related to the environment exist? In particular, what kind of externality is it associated with, a production or a consumption externality? Is the externality local or global?
2. Are China and the US, respectively, net importers or net exporters of SPs and WTs?
3. Are China and the US, respectively, ‘small’ or ‘large’ economies in the markets considered?
4. Is the market structure of the SPs and WTs markets competitive or is there some degree of market power?
5. Are the markets of SPs and WTs politically organized in China and the US?
We address each of these questions and provide empirical evidence (when available).
Regarding the first question, given the nature of the goods considered it is likely that an environmental market failure exists and that it is global in nature. Electricity produced from fossil fuels is associated with high levels of carbon emissions, a negative externality which gives rise to a market failure. The private marginal cost for producers of fossil-fuel electricity will not account for this externality, which implies that there will be over-production of fossil-fuel electricity compared to socially optimal levels. The reduction in carbon emissions from SPs and WTs comes from substituting consumption of carbon-intensive electricity with consumption of clean generated electricity such as solar and wind. In addition, carbon emissions affect all countries in the world, no matter where the generation of carbon-intensive electricity takes places, i.e. the negative externality is global because its effects cross borders.
To address the second question, we use data on imports and exports at the 6-digit Harmonized System (HS) level for SPs (854140) and WTs (730820)Footnote 8 to determine whether the US and China are net exporters or importers of these products (our data are up to 2013). China imported a very small amount of SPs from 1996 until 2007, but since 2007 it has become a net exporter of SPs. In addition, China has been a net exporter of WTs since 1998. The US has been a net importer of SPs throughout the period we consider (1996–2013), while it has been a net importer of WTs since 2001 (see Figures 1 through 4). In terms of production and consumption, some observers note that, until recently, almost all production of SPs and WTs by Chinese manufacturers was exported. However, since 2010 China has invested heavily in deploying solar capacity locally, as detailed below.
Net exports of solar panels by China (millions of USD)

Net exports of wind turbines by China (millions of USD)
Net exports of solar panels by the US (millions of USD)
Net exports of wind turbines by the US (millions of USD)
The third question, whether the US and China are ‘small’ or ‘large’ economies in the markets of SPs and WTs, is essential to determine the terms-of-trade effect of the welfare analysis. Following the literature (see, for example, Broda et al., Reference Broda, Limao and Weinstein2008; Ludema and Mayda, Reference Ludema and Mayda2013), we can measure an importing country's market power in a given market with the inverse elasticity of export supply. Based on this measure, for both WTs and SPs, the US and China are ‘large’ economies.Footnote 9
Regarding question 4, we can gather information on the structure of the markets of SPs and WTs in China and the US, respectively, by calculating the extent of concentration of these markets across firms. One measure of concentration is the market share of the top five firms. A market is considered oligopolistic if the top five firms account for over 50% of the market. Figure 5 shows that the top five wind turbine manufacturers in the world in 2012 accounted for 56% of this market, which suggests that the world market of WTs is oligopolistic. The world market of SPs on the other hand is competitive. In 2012, the top five producers of solar modules accounted for just around a quarter of the market (Figure 6).
Market shares of top 10 wind turbine manufacturers, 2012
Market shares of top 15 solar PV module manufacturers, 2012
The local markets in China and the US look different though. Figure 7 shows market shares by locally owned firms in leading domestic wind markets in the year 2012. The US market for WTs appears more concentrated than the world market, while the Chinese one is less. But in wind, both markets can be considered oligopolistic. As for solar, the US market for SPs is highly oligopolistic with up to 83% of production concentrated in the top five producers (Statista, 2015), while the Chinese market is considered highly competitive (Haley and Haley, Reference Haley and Haley2013). Therefore, outside of the Chinese and world SP industry, all relevant markets exhibit some degree of market power.
Market shares by locally owned firms in leading domestic wind markets, 2012
Finally, data from Ludema and Mayda (Reference Ludema and Mayda2013) show that both HS 6-digit codes 730820 (WTs) and 854140 (SPs) are politically organized sectors in the US (political organization is measured by the presence of business associations). Data for China on sectors’ political organization are not available, but the fact that a WTO case was filed against the US CVD suggests some degree of political organization.
3.2 Social-welfare rationale for the Chinese subsidy on SPs and WTs
In this section, we analyze the social-welfare rationale for the Chinese subsidy from a theoretical point of view for Chinese and rest-of-the-world (ROW) welfare. From the point of view of China's social welfare, we need to explore whether the subsidy under scrutiny was meant to address market distortions. Some distortions might be specific to environmental goods, others may not.
As discussed above, the production of electricity from fossil fuels creates a negative externality in the form of carbon emissions, a global pollutant that affects the whole world. To reduce global carbon emissions from electricity generation, the first-best tool would be a global tax on carbon. There are two reasons why subsidies are not first best. First, subsidies tip the scale in favor of a particular technology while a global tax on carbon allows each firm to choose its most efficient abatement option. Second, subsidies, unlike taxes, increase the profitability of the industry, which induces entry of potentially inefficient firms.
Unfortunately, a global carbon tax has proven to be politically infeasible. As a result, an alternative way to address the negative externality associated with the production of fossil-fuel electricity is to encourage alternative forms of energy that are clean – in particular, generating electricity using SPs and WTs does not produce greenhouse gases. As world consumption of clean energy increases, the world use and production of fossil fuel electricity decreases – other things held equal – which in turn implies a reduction in the negative externality.
The most direct way to increase world consumption of SPs and WTs is to subsidize their consumption. The Chinese subsidy under scrutiny was to production, not consumption, and it targeted Chinese as opposed to world production. However, since China is a ‘large’ economy in these markets, the subsidy has likely decreased the world price of SPs and WTs and thus has increased ROW consumption of these goods, besides having increased Chinese consumption. In addition, since pollution is global, the increase in world consumption of these goods and the associated decrease in greenhouse gas emissions gives rise to an increase in Chinese and ROW welfare.
It is therefore possible to justify the Chinese subsidy on the grounds that it corrects an environmental market failure, although the question remains whether the subsidy is too large or too small to optimally address the environmental problem.
The subsidy could also tackle more general market failures. Suboptimal investment levels can occur when firms cannot be fully compensated for their investment. A firm investing in research and development might be concerned that its innovation could be imitated by competitors or have spillovers into other industries. These failures can result in suboptimal levels of investment in SPs and WTs innovation, or in a diversion of innovative resources away from radically new technologies in favor of more incremental innovation. This failure can be exacerbated if prices are too low to provide incentives to innovate.
Subsidies can also address an infant-industry type of market failure. In some cases, an industry could have latent comparative advantage, which only kicks in when a certain threshold of production is attained (i.e. economies of scale exist, but the firms in the industry do not internalize them, which gives rise to an externality); or capital market imperfections could make it difficult for young industries or small firms to secure funding. However, latent comparative advantage is difficult to identify ahead of time, and so there is no guarantee that the benefit of protecting an industry will outweigh the cost. Governments also suffer from information failures and could mis-time or mis-target the intervention.
The most efficient subsidy would be global: it would encourage an increase in the world use of SPs and WTs – and therefore a decrease in world use and production of fossil fuel electricity – but would allow for the production of SPs and WTs to take place where the comparative advantage is greatest. Instead, a local subsidy will target production of a specific country, in this case China. If China has a comparative advantage in the production of SPs and WTs, the local subsidy is a good tool. If instead it is welfare enhancing to produce SPs and WTs in other countries – because of factor endowments, technology, or the carbon footprint of production and transport – the subsidy is distorting the world allocation of production. The question is then whether it is globally welfare enhancing for the majority of SPs and WTs to be built in China.
Thus, subsidies to SPs and WTs can be justified on the basis of various types of market failures. However, it is important to keep in mind that subsidies should meet two conditions (Kemp, Reference Kemp1960). First, the supported section should eventually be able to survive and compete globally without the subsidy. Making sure that firms can eventually survive without the subsidy also helps alleviate concerns that the subsidies are distorting the allocation of productive resources towards inefficient firms. Since subsidies create rents, firms will lobby to maintain them, even when they are no longer necessary. An agreement which would allow environmental subsidies should make sure to address how and when to remove the subsidies. Second, the total cost of support should be outweighed by the present discounted value of benefits. Costs include financing of the subsidy through taxes, which can create distortions. Benefits include potential employment gains from increased output as well as global environmental benefits.
Beyond market failures, subsidies are sometimes given for ‘strategic trade-policy’ motives, i.e. as a way to favor Chinese firms in export markets, which are not competitive (see Brander and Spencer, Reference Brander and Spencer1985). This scenario is more likely if the subsidies are targeted to exports as opposed to production. Knowing with certainty whether the motive of the subsidy is strategic or environmental or associated with other market failures is a difficult task.
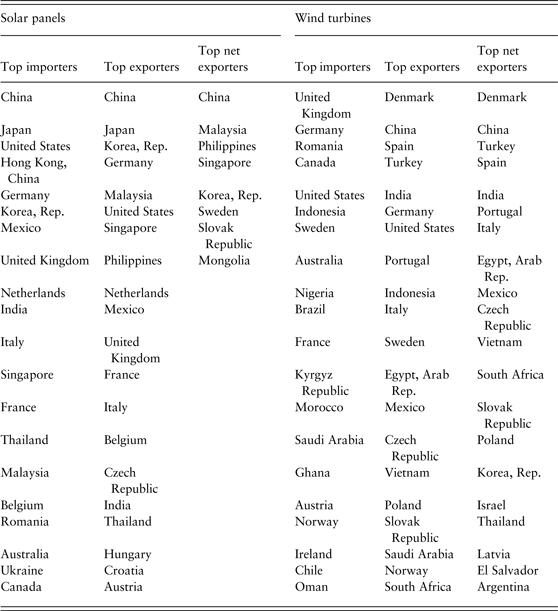
In terms of ROW welfare, since the subsidy increases world consumption of SPs and WTs and thus decreases global pollution, it gives rise to an increase in ROW social welfare. In addition, we need to take into account the impact of the subsidy on international prices. Since the subsidizing country (China) is a large economy, the increase in world supply will decrease international prices. Therefore countries which are net importers of SPs and WTs (Table 1) will benefit from the Chinese subsidy since they will be able to import SPs and WTs for a lower price (i.e., these countries will experience a terms-of-trade improvement). The opposite is true for net exporting countries. In both sets of countries, domestic consumers will benefit from the reduction in prices, while domestic producers will be hurt.
3.3 Empirical evidence on the impact of the Chinese subsidy on SPs and WTs
Following up on the theoretical arguments, and having previously determined that China and the US are ‘large’ economies, we investigate whether there is any empirical evidence that the subsidy given by the Chinese government has been effective in improving China's social welfare and ROW social welfare. The evidence we will provide is anecdotal and not meant to be interpreted causally.
Although a large portion of Chinese production of SPs is exported, China has invested heavily in the domestic deployment of solar energy since 2010 and therefore has become an important consumer of SPs. From less than 1GW of solar capacity in 2010, China had installed almost 30GW by 2014, pulling it to second position worldwide after Germany. This trend is expected to continue as China installed the equivalent of France's entire capacity in just the first quarter of 2015. By the end of 2015, China will have installed new capacity equivalent to more than twice the new capacity installed in the United States in 2014.
Yet, despite record SPs installations in the past few years, manufacturing capacity far exceeded demand in China. By 2010, China was the single largest producer of SPs, supplying 45% of world production (ChinaGlobalTrade, 2012). These high levels of SPs production have resulted in a sharp decline in prices in recent years (IRENA, 2014). As mentioned above, the decrease in world prices of SPs benefits consumers and hurts producers, all over the world. For example, there is evidence that the fall in prices also hurt some Chinese firms, as evidenced by a series of bankruptcies in 2012 and 2013 (Stanford GSB, 2013). These bankruptcies indicate that the subsidies might have been encouraging overcapacity by firms that are not efficient enough to compete in global markets.
From an environmental perspective, cheaper SPs leads to further adoption of solar energy, and therefore to lower emissions worldwide, all else held equal. Until recently, the high costs of SPs were deemed to be a major obstacle to solar adoption. The reduction in prices therefore contributed to promoting solar deployment. However, with the decrease in prices, SPs represent only a small portion of the total cost of a photovoltaic (PV) system, which is now mainly made of the costs of installation, marketing, and permitting. Price declines in SPs will no longer be the main driver of cost reduction of solar PV installations. Therefore, reducing the price of panels further through subsidies or other means will no longer be a major contributor to solar adoption and further emission reductions. The environmental externality of solar panel subsidies will therefore become harder to argue.
Also from an environmental point of view, whether it is globally welfare enhancing to produce the majority of SPs in China depends both on their production's carbon footprint and the pollution reduction they achieve. A study found that the carbon footprint of Chinese SPs is twice as high as European SPs and that the energy use efficiency is 30% lower (Yue et al., Reference Yue, You and Darling2014). Those two facts combined would suggest it might not be optimal for SPs to be built in China. In addition, much of the consumption of SPs happens in Europe and the US, which means there are also shipping emissions costs. A related question would be whether the US is the optimal place to deploy the SPs and WTs, depending on the amount of carbon displaced. In 2010, the carbon intensity of the energy sector in China surpassed that of the US, but the US ranked amongst the countries with the highest carbon intensities (IEA, 2013).
In terms of wind, world prices of WTs declined precipitously after 2008. The capacity increase in WTs originated in part in China. The Chinese market had such large excess capacity by 2009 that the Ministry of Land and Resources started to deny applications for new WTs manufacturing facilities (Lewis, Reference Lewis2014a). Since 2009, China has dramatically increased its domestic WTs installation, while other countries experienced a slow-down. China is now the top country in terms of new WTs installations (GWEC, 2013).
In terms of welfare, China is a growing player in WT production and the price of Chinese turbines was half the price of US turbines in 2012. Nonetheless, the six top Chinese firms combined still account for less global market share than each of the world leaders, Vestas or General Electric (Lewis, Reference Lewis2014a). Still, the recent sharp decline in Chinese WT production costs combined with lower shipping costs have helped China gain a larger global market share, affecting Europe's and the US's capacity to compete. The Chinese subsidies are most likely responsible for at least part of the lower production costs. However, the lack of competition in China might have led to inefficiencies in the Chinese wind industry, and Chinese turbines suffer from reliability issues (Wang et al., Reference Wang, Qin and Lewis2012), which suggests a negative effect on both Chinese and global social welfare. The question is whether the positive effect on welfare from lower prices overcomes the negative effect from inefficiencies in energy use.
In sum, it appears that in both solar and wind China has global market power and affects world prices. The subsidies contribute to lowering world prices through increased supply and competitive cost structures. In turn, this benefits world consumers, but hurts competing suppliers. The positive effect on consumers will offset the loss to import-competing producers so the importing country will be better off overall. Nonetheless, for strategy trade reasons or political economy reasons, it might still be in the interest of the importing country to respond to the subsidies. Environmentally, cheaper SPs and WTs could contribute to increased deployment of clean energies, and therefore to reductions in polluting fossil-fuel energy sources, a global welfare improvement. However, the subsidies might also be distorting efficient markets by incentivizing the production of lower-cost but less energy-efficient SPs and WTs.
3.4 Political-economy considerations regarding the Chinese subsidies to SPs
Besides social welfare considerations, the Chinese subsidy could be motivated by political-economy reasons. The subsidy under scrutiny could have been given under political pressure by local Chinese firms for rent-seeking or political motives. Many studies find that the allocation of subsidies is correlated with the political influence of the beneficiaries. Grossman and Helpman (Reference Grossman and Helpman1994) developed one of the foremost models of the influence of special interests groups on trade and subsidy policy. The bottom line is that incumbent politicians care about maximizing social welfare but also about financial contributions. The second element will incentivize them to offer trade and subsidy policies to special interest groups, leading to socially suboptimal outcomes. Obviously, social-welfare considerations and rent-seeking ones can both be motivating factors for government policy. The question how much each factor contributed to this subsidy is not possible to answer here.
Finally note that, both from a social-welfare point of view and from a political-economy point of view, the discussion on clean energy has been recently linked to the issue of jobs, ‘green jobs’, and ‘green growth’. However, evidence on whether renewable energy policies have a positive effect on economic activity in OECD countries is mixed (Brunel, Reference Brunel2015). On the one hand, renewable energy policies, including subsidies, do not appear to boost domestic innovation in renewable energy technologies as firms adopt existing foreign technologies. On the other hand, the policies and resulting technology adoption do lead to a significant increase in domestic manufacturing production (and thus potentially in jobs in the renewable sector).
3.5 Countervailing duties
CVDs were imposed by the US on a number of products – which include SPs and WTs – imported from China to offset the impact of alleged subsidies. Here, we discuss these CVDs’ welfare effects.
Unlike subsidies to address environmental market failures, a CVD increases the consumer price of SPs and WTs in the US and thus reduces the consumption of clean energy in the US. US industry associations of firms that use these goods repeatedly highlighted that the US CVD will indeed hurt the development of domestic clean energy by making SPs and WTs more expensive (SEIA, 2013).
Another effect of the CVD is to increase the price received by US producers of these products, which will in turn increase their production. Given that US consumption decreases and US production increases, the import demand of SPs and WTs by the US will decline. To the extent that the US is a ‘large’ economy in these markets, the international price of SPs and WTs will decrease. Thus, consumers in the rest of the world will benefit. Countries that are net importers of SPs and WTs will experience a terms-of-trade improvement, while the opposite is true for net exporters of SPs and WTs. More importantly, whether world consumption of clean energy will increase and consumption/production of carbon-fuel energy will decrease depends on the magnitude of the effects on US consumption vs. ROW consumption.
Since the US is a net importer of SPs and WTs, its terms-of-trade will improve with the CVD; however, this might not offset the distortions implied by the CVD – the standard distortions on the consumption and production sides plus the distortion associated with the local market failure – especially for very high levels of the CVD rate. In other words, US social welfare might very well decrease. So the question is: Why would the US government choose to impose CVDs?
There are a number of possible answers to this question. The first one is related to strategic trade-policy considerations, which are relevant if the market considered is not perfectly competitive. One of the goals of the Chinese subsidies might be to dominate the SPs and WTs world markets, which is likely to be a goal of US policy as well. One of the main results of the strategic trade-policy literature (Brander and Spencer, Reference Brander and Spencer1985) is that an export subsidy imposed by a foreign government (China) will increase foreign welfare if there is no retaliation by the domestic government. However, under certain conditions, the optimal response by the domestic (US) government to the Chinese subsidy is indeed a partial CVD (Dixit, Reference Dixit1989). Finally, Collie (Reference Collie1991) shows that the CVD discourages the export subsidy. We have insufficient evidence to sort through the motivational question here.
3.6 Overall assessment from an economic point of view
Our reading of the literature related to this case is that, while the Chinese subsidy might be partly motivated by strategic considerations of the Chinese government to protect and develop its own industry of SPs and WTs, at the same time the Chinese subsidy is also consistent with the environmental goal of promoting renewable energy and reducing CO2 emissions in China and abroad. The Chinese subsidy is probably one of the drivers of the big reduction in world prices of these products, making it cheaper all over the world to install SPs and WTs. At the same time, the existing literature views the countervailing duty as mainly a protectionist measure to help the local (US) SPs and WTs industries, with potentially detrimental effects from an environmental point of view.
We agree with this point of view. Subsidies to SPs and WTs can indeed address market failures associated with the carbon-intensive electricity production. More importantly, since the subsidies were not directly targeted at exports, they did not reduce Chinese consumption of these goods. There is also evidence that Chinese prices of SPs and WTs decreased and their installation in China greatly increased in the last few years, which is consistent with environmental goals.
But in general, how efficient are subsidies in addressing the externality associated with fossil fuel consumption? The Chinese subsidies can address a market failure but they may also introduce other distortions. For example, it might be that the reduction in pollution associated with production of Chinese SPs and WTs is smaller than that of US SPs and WTs. If so, a ‘world’ social-planner would prefer that these subsidies be allocated to US-based production.
What about the CVD imposed by the US? As in the standard case of a tariff, the CVD creates distortions, which are likely to more than offset any welfare-enhancing impact of the CVD. First, consumer prices are going to increase in the US, which will lead to smaller consumption in the US of SPs and WTs. Is there a terms of trade rationale for the CVD? The CVD will further decrease the world price of SPs and WTs, which improves the terms of trade of the US and of any importer of those goods. In addition, the reduction in the international price of SPs and WTs due to the CVD will increase ROW consumption of clean energy and reduce ROW pollution. Note, however, that if the US imposed a subsidy, not a CVD, it would still promote US production of these goods without distorting US consumer prices.
Does this call for changing the WTO rules on trade remedies against foreign subsidies so that countries, at least in the case of environmental goods, are only able to impose ‘countervailing’ subsidies as opposed to countervailing duties? Unfortunately, a complete analysis of this important questions is well outside the scope of this paper.
4. Conclusions: reconciling the legal and economic perspectives
Is the decision by the AB in this case consistent with our answers to the questions above? In other words, did the AB make a decision that promotes environmental goals? The AB decision was not focused on environmental policy or global social welfare. The decision was based on an analysis of the rules of the SCM Agreement ‒ so the doctrinal analysis was whether the US's CVD procedures were consistent with WTO minimum requirements. The AB decision made it more difficult for a nation to apply ‘out-of-country’ benchmarks (making it harder, but not impossible, to impose higher CVDs). If lower (or no CVDs) is better for the environment, then the AB decision pushes WTO law in this direction, although only a little bit. The ruling still allows CVDs on environmental goods regardless of a social welfare analysis of whether CVDs would be optimal in each case. In addition, the SCM Agreement allows WTO members to apply domestic remedies (such as CVDs) without effective WTO review for four years or more, which is particularly harmful in an industry that has rapid technological change, such as the SP and WT industries. Thus, any real advancement in the liberalization of trade in environmental goods will probably require a negotiated agreement rather than judicial interpretations of the current WTO Agreements.