For politicians and political pundits election campaigns lie at the very heart of political life. Political scientists, in contrast, have long supposed that they have minimal effects on election outcomes. Several strong and independent considerations point toward that conclusion:
• In the old days, voting behavior was strongly determined (and still is to some degree) by a person's social status or class location. Obviously, election campaigns do nothing to alter that.Footnote 1
• In the old days, voting behavior was strongly determined (and still is to some degree) by a person's party identification, the strongest determinant of which used to be (and still is to some degree) his or her parents' party identification when the voter was growing up. Obviously, election campaigns do nothing to alter that.Footnote 2
• More recently, the strongest determinant of a government's chances of reelection has been shown to be the strength of the national economy. Obviously, election campaigns do nothing to alter that.Footnote 3
• More pragmatically, the electioneering of equally adept opposing parties roughly cancel each other out. It is not as if one side is campaigning while the other is not.Footnote 4
All those considerations should lead us to expect public opinion not to change much during the campaign period. We offer evidence to the contrary. Opinion does change over the course of the campaign in the three countries we examine: the United States, the United Kingdom, and Australia.
Even more surprising, however, is our further finding. While opinion changes during the campaign, come Election Day it often reverts back nearer to where it was before the campaign began.Footnote 5 That is to say, the government's standing in the polls before the campaign began is—as often as not—a better predictor of the government's ultimate share of the vote than is its standing in the polls during the campaign itself.
That really is surprising. Ordinarily we would expect the poll taken closer to the election to be the better predictor of the electoral outcome. Often it is; but surprisingly often, it is not.Footnote 6 Whereas we ordinarily imagine opinion change to be a continuous process, this finding points instead to a discontinuity on Election Day itself. Whereas ordinarily we expect people who have been persuaded to stay persuaded, by and large, here we see instead non-negligible numbers of people apparently shaking off the effects of the campaign in the poll booth itself.
We offer two hypotheses as to what might explain these findings. One hypothesis—the one just alluded to—works at the level of individual psychology. Perhaps people become more responsible when they step into the poll booth. Perhaps when actually voting they reflect back on the government's whole time in office, rather than just responding (as perhaps they do when talking to pollsters) to the noise of the past few days' campaigning.Footnote 7
A second hypothesis works at the macropolitical level, seeing differential turnout as the key to the puzzle. Perhaps impressionable people, whose opinion is particularly influenced by the glitz of the election campaign, are simply less likely actually to vote. That, too, would lead to the government's pre-campaign standing in the polls being a better predictor of their ultimate share of the vote than is the government's standing in the polls during the campaign.
We differentiate between those hypotheses in two ways. First, we examine the crucial test case of Australia, where voting is compulsory and turnout is near universal. If the same “bounce back” phenomenon occurred in Australia under conditions of near-universal turnout, that would be evidence in favor of the first hypothesis. If the “bounce back” were absent in Australia, that would count in favor of the second hypothesis postulating differential turnout (assuming of course that what is true in Australia is true in the US and UK as well). Second, we examine individual-level panel data from the 1987 and 2005 British elections for direct evidence of how many people change their voting intentions during the campaign only to “bounce back” toward their original intention on election day.
The Surveys We Use
The evidence we offer on these topics is sketchy. Given the small number of elections for which the relevant evidence is available, formal statistical analysis is not very fruitful. Our findings are thus suggestive rather than conclusive. Still, the findings are intriguing even in this necessarily tentative form.
We begin by looking, for each election under study, at two sets of poll data: one is the average support for the incumbent in the “pre-campaign” polls, just before the campaign begins (more on which later); the other is the average support for the incumbent in “pre-election” polls, just before Election Day. We then calculate the absolute magnitude of error between each of those predictors and the incumbent's actual share of the vote in the election itself.
We will examine the cases of the US, UK, and Australia. For the sake of comparability across those countries and over time, we focus on Gallup polls in the UK and US and their equivalent (Morgan Gallup polls) in Australia.Footnote 8 The questions on which we focus concern “voting intention” in the UK and Australia and “presidential approval” in the US.
Again for the sake of comparability, we focus on elections in which an incumbent is standing for re-election. That is always the case in the UK and Australia (except in one ambiguous case, discussed later); but it is often not in US presidential elections, given the two-term limit. The incumbent's share of the vote in the election is the incumbent's share of the popular vote in the US and UK and of “first preferences” in Australia.
We take the election campaign to begin in the UK and Australia on the day the election is announced (listed in Appendix table A1). In the US, we follow the tradition of taking Labor Day as the beginning of the general election campaign.Footnote 9 (In some sense, the campaign has been going on for fully a year at that point: we address that complication later.)
Our measure of “pre-campaign” public opinion is the average of the incumbent's share in all Gallup polls conducted in a three-week period immediately prior to the beginning of the campaign. (Occasionally we have to extend that window slightly, as noted in table 1.) Our measure of “pre-election” public opinion is the average of the incumbent's share in all Gallup polls conducted in a three-week period immediately prior to the election itself. A three-week window is once again dictated by considerations of comparability. In the UK elections of February and October 1974, the periods between the election announcement and Election Day were 21 and 22 days respectively. Wanting to compare like with like, we therefore must restrict our attention to similar three-week windows in all other cases as well.
The performance of pre-campaign and pre-election voting intentions in the UK

Notes:
a The “pre-campaign” period is taken to be the three-week period before the election announcement. The “pre-election” period is the three-week period before election day. For the dates of election announcements and election days, see Appendix table A1.
b During 1983, there was no Gallup poll conducted during the pre-campaign period which excluded the election announcement. Consequently, we used the results of an earlier Gallup poll (conducted between April 7 and 11).
c During 1987, there was no Gallup poll conducted during the pre-campaign period which excluded the election announcement. Consequently, we used the results of an earlier Gallup poll (conducted between April 8 and 13).
d During 2001, there was no Gallup poll conducted during the pre-campaign period which excluded the election announcement. Consequently, we used the results of an earlier Gallup poll (conducted between April 4 and 10).
e In the absence of Gallup polls which were no longer being conducted in the UK by the time of the 2005 election, we used the results of the “2005 Rolling Campaign Panel Survey” conducted by YouGov for the British Election Study.
Sources: Butler and Butler Reference Butler and Butler2000, 1–50, 55; King, Wybrow, and Gallup Reference King, Wybrow and Gallup2001, 1–21; Yonwin Reference Yonwin2004, 10, 17; British Election Study 2005; Mellows-Facer Reference Mellows-Facer2006, 8.
For the UK, the earliest election we use is 1970. Prior to that, Gallup polls were not conducted during all the time periods required for these analyses. The latest election we use is 2005, the last election at the time of writing. For the US, the earliest election we use is 1984; again, prior to that Gallup polls were not conducted during all the periods we require. The latest election we use is 2004, the last election in which an incumbent was standing at the time of writing. For Australia, the earliest election we use is 1977. (Morgan Gallup polls were first conducted during all the time periods we require in 1975:Footnote 10 but we omit that election on the grounds that there was no unambiguous incumbent; the Whitlam Labor government had been dismissed and replaced by the Fraser Coalition government just one month before the election, in what Labor regarded as a “constitutional coup” that it appealed for voters to overturn.) The latest election we use is the 2007 election, the last election at the time of writing.
Which Survey Better Predicts Election Outcomes?
Looking to results for the UK and US, the first thing to notice is the extent to which the incumbent's standing in the polls changes over the course of the campaign. Inspecting data for the UK (table 1) and US (table 2), we see that while it is often the case that pre-campaign and pre-election polls are very close to one another—as the “no campaign effects” hypothesis would predict—they also sometimes differ substantially. In the UK, the incumbent's standing in pre-election polls differs from that in pre-campaign polls by more than two percentage points in fully half the cases and in one year (1983) it differs by over six percentage points.Footnote 11 (Looking ahead to table 3, we see almost exactly the same pattern in Australia.) In the US, while in one year (2004) the two sets of polls were almost identical, in the other three years the two sets of polls typically differ by around four percentage points.
The performance of pre-campaign and pre-election presidential approval ratings in the US

Notes:
a The 1988 and 2000 elections were not contested by an incumbent president.
b The “pre-campaign” period is taken to be the three-week period before Labor Day. The “pre-election” period is the three-week period before election day. For the dates of Labor Days and election days, see Appendix table A1.
Sources: Stanley and Niemi Reference Stanley and Niemi2006, 12–13, 247–249; U.S. Census Bureau 2006, 241; Roper Center for Public Opinion Research 2007.
The performance of pre-campaign and pre-election voting intentions in Australia

Notes:
a Percentage shares of the popular vote and voting intentions refer to “first preferences.”
b The “pre-campaign” period is taken to be the three-week period before the election announcement. The “pre-election” period is the three-week period before election day. For the dates of election announcements and election days, see Appendix table A1.
Sources: Beed, Goot, Hodgson, and Ridley Reference Beed, Goot, Hodgson and Ridley1993; Goot, Ridley, Day, Gibbons, McNair, and Beed Reference Goot, Ridley, Day, Gibbons, McNair and Beed1993; Australian Electoral Commission 2005, 26–28, 66, 94–99; 2008; Roy Morgan Research 2008; Morgan Gallup Poll Findings, various issues.
Insofar as they do differ, which is the better predictor of the election outcome: pre-campaign polls or pre-election polls? Looking first to table 1's report of the UK case, we find a mixed pattern. Sometimes the incumbent prime minister's share of the popular vote is better predicted by pre-campaign voting intentions, and sometimes it is better predicted by pre-election ones.
Nonetheless, in fully half of the ten cases the pre-campaign polls are, surprisingly enough, the better predictors of the incumbent prime minister's share of the popular vote in the election itself. That is to say, as often as not pre-campaign polls are a better predictor of the election result.
Averaging across all the UK cases, pre-campaign polls also perform a tad better than pre-election ones. The mean magnitude of error in pre-campaign polls' predictions of the election result is 3.5 percent, compared with 3.6 for pre-election polls'.Footnote 12 Modest though that mean difference may be, notice that in three out of ten cases UK pre-campaign polls are over 2 percentage points closer to the actual election result than are the pre-election ones.
In table 2's report of the corresponding statistics for the US, we observe broadly the same pattern, albeit with fewer cases to consider. There are only four presidential elections meeting the criteria and data requirements set out. But in three out of four of them, the pre-campaign polls are a better predictor than the pre-election polls of the president's share of the popular vote in the election itself.Footnote 13
In the US just as in the UK, pre-campaign polls also perform slightly better on average than pre-election ones: the magnitude of error in pre-campaign polls' predictions of the election result is 2.6 percent, compared to 2.8 for pre-election polls'. Again, while that average difference is modest, in one out of the four US cases (1996) the pre-campaign polls are fully 3.5 percentage points closer to the actual election result than are the pre-election ones.
Why Pre-Campaign Surveys Might Predict Better
Nothing very conclusive can be inferred from these findings. The number of elections involved is small, especially in the US. In both the UK and US the pattern is mixed, with pre-campaign polls outperforming pre-election ones some years, and the opposite in other years. Averaging across all the cases for each country, pre-campaign polls outperform pre-election ones, but only by a whisker. None of this adds up to decisive evidence of the unqualified superiority of pre-campaign polls as predictors of election outcomes.
Inconclusive though that may seem, those findings are nonetheless striking when set against the natural background assumption that polls taken nearer election day ought surely always be a better predictor of the vote than polls taken further from election day. If the campaign has changed people's minds—as it has in those cases where pre-election polls differ from pre-campaign polls—then what is it about the poll booth that as often as not changes them back, making the pre-campaign polls a better predictor of the electoral outcome?
Two hypotheses seem particularly worth exploring.Footnote 14 One we call the “Responsible Voter” hypothesis.Footnote 15 This hypothesis holds that there is indeed something about the poll booth that changes the way people think. When telling an American pollster whether or not they approve of the way the president is handling his job, or even when telling a British or Australian pollster how they would vote if the election were held today, they give an off-the-top-of-their-head response. Voting, however, is serious business. For responsible voters who take their civic duty seriously, it is an occasion to pause and reflect on how good a job the incumbent really has done—not just over the last little while but over the whole period in office.
There is evidence from the “retrospective voting” literature that significant numbers of voters behave in just that way.Footnote 16 This hypothesis resonates, too, with evidence from cognitive psychology that most of the time people are “cognitive misers.” Time is too limited, the capacity of short-term memory too restricted, to delve into long-term memory for all the stored facts that might be relevant to each and every evaluation required in daily life. People occasionally engage in that sort of off-line “memory-based processing … when the individual has foreknowledge of the need to recollect the evidence, is motivated to keep account of this evidence, and has the time to contemplate its ramifications.”Footnote 17 Most of the time, however, they engage in “impression-driven” processes: when new information comes in, they update their impressions on-line and adjust their summary judgment accordingly, dropping that information into stored memory and proceeding with their day-to-day lives on the basis of that updated summary judgment alone.Footnote 18 The Responsible Voter hypothesis suggests that being in the poll booth is a trigger that switches people from on-line, impression-driven to off-line, memory-based mental processing.Footnote 19
Of course, sometimes on-line and off-line processes lead to the same conclusion. But sometimes they do not, thus leading voters reasoning off-line in the poll booth to act in ways different than how they thought they would act when reasoning on-line in the days and weeks immediately prior to the election. That, on the Responsible Voter hypothesis, is what explains the cases in which we see the surprising reversion to pre-campaign views of the incumbent in the poll booth.
Whereas that first hypothesis operates at the level of individual psychology, the second hypothesis is more macropolitical. Call this the “Differential Turnout” hypothesis. Whereas the Responsible Voter model hypothesizes that voters change their minds, this Differential Turnout account hypothesizes that people who vacillate during the election campaign simply do not turn out to vote (or anyway not nearly as often as people who do not). In effect, that is to say, had the pre-campaign and pre-election polls been conducted only on people who actually voted, they would not differ. The only reason that pre-election polls seem to be sometimes worse predictors of election outcomes than pre-campaign ones is that people who are so politically uninformed and impressionable as to change their opinions during the campaign simply do not turn up to vote.
Australia as a Test Case
One way of pitting these two hypotheses against one another employs Australia as a crucial test. In the UK and US voting is optional, whereas in Australia it is compulsory. In consequence, while turnout rates in the US and UK are in the 50–70 percent range, in Australia they are consistently around 95 percent.
If Differential Turnout were the full explanation of the surprising successes of pre-campaign polls in predicting many UK and US election outcomes, then that success would not be replicated at all in Australia where virtually everyone turns out. If pre-campaign polls are sometimes better predictors of election outcomes in Australia as well, then that would suggest that something like the Responsible Voter model is also at work.
Inspecting table 3 shows that the verdict is indeed mixed. Just looking at the mean magnitude of errors, pre-election polls seem to be a better predictor than pre-campaign polls of the incumbent prime minister's percentage of “first preferences” in the general election. Pre-election polls are on average over half a percentage point more nearly right. Notice however that that mean is being driven by just three elections out of the total of twelve (1990, 1998, 2004) in which pre-election polls outperform pre-campaign ones by very wide margins (well over 3 percentage points).
In fully five out of the twelve Australian elections pre-campaign polls are actually the better predictor of the election outcome (in a sixth case it is a tie). Furthermore, the pre-campaign polls are sometimes substantially better than the pre-election polls—by around 2 percentage points in fully three cases out of the twelve (1980, 1983, 1996). All that suggests that Differential Turnout is not the whole story, and there must also be some element of the Responsible Voter model at work in Australian elections, and, in US and UK elections as well, insofar as these are like Australian ones in that respect.
UK Panel Data as a Test
A second way of assessing the two hypotheses is to look at individual-level panel data. Data of the requisite sort is contained in only two publicly available surveys: the 1987 British Election Campaign Study; and the YouGov Rolling Campaign Panel Survey for the 2005 British Election Study.Footnote 20
In the 1987 study respondents were re-interviewed at various points, three of them pertinent to present purposes: one was about six weeks (rather than our usual three, alas) before the election was called; another was in the final fortnight before the election; and the last was immediately after the election.Footnote 21 In the post-election interview respondents were asked whether and how they had voted. On earlier occasions they were asked the strength of their inclination to vote for each party on a zero-to-ten scale. We code respondents as “not intending to vote” if they rank no party above 5 on the 10-point scale; and we code those scoring at least one party above 5 as “intending to vote” for whichever party they score highest.Footnote 22 We confine our attention to the 747 members of the panel for whom data are reported for all three points in the electoral cycle.
In the 2005 study YouGov conducted a baseline survey in March 2005 asking respondents their voting intentions. Then during the campaign, a follow-up interview was conducted with a random sample of around 270 of those respondents every day. Immediately after the election all pre-campaign respondents were reinterviewed and asked whether and how they voted. Here we confine our analysis to the 2,935 respondents who were initially interviewed within our window of three weeks before the election was called, who were reinterviewed during the campaign within our window of three weeks before the election was held, and who in the post-election interview disclosed whether and how they voted.
The Differential Turnout hypothesis predicts that people whose opinions are most susceptible to change during the campaign will be less likely to vote in the election itself. To test that proposition, table 4 cross-tabulates whether or not respondents changed their voting intention during the campaign with whether or not they reported voting in the election.Footnote 23 Among those whose voting intention changed during the campaign, table 4 further differentiates those who acted on election day in line with that changed intention and those who on election day acted in line with their original pre-campaign intention.
Campaign effects on voting intentions and turnout in the UK, 1987 and 2005

Sources: 1987 British Election Campaign Study (Miller Reference Miller1989; Miller et al. Reference Miller1990); 2005 British Election Study Rolling Campaign Panel Survey (British Election Study 2005).
Table 4 confirms that most people did not change their voting intentions at all during these election campaigns. It also shows, however, that a significant minority of people did change. Between a sixth (in 2005) and a seventh (in 1987) of respondents changed their voting intentions over the course of these campaigns.
Furthermore, table 4 shows that most of those who changed their voting intentions during the campaign actually ended up voting. That is particularly true of those whose intentions changed unidirectionally over the course of the campaign: their turnout rates are essentially identical to those of non-changers. However, even among people who changed voting intentions during the campaign, only to revert to their original intentions on election day, table 4 shows that over half of them actually ended up voting in 2005 and 80 percent voted in 1987. Those are definitely lower turnout rates than for the other two groups in table 4. The Differential Turnout hypothesis is right about that. But the turnout rates for those whose opinion first changed and then bounced back is nonetheless very high, in absolute terms.
Differential Turnout is therefore far from the full explanation of why pre-campaign polls are sometimes better predictors of election results than later pre-election ones. Table 4 offers clear evidence for the Responsible Voter hypothesis as well. The phenomenon of “waking up in the poll booth” is clearly demonstrable through tracking the opinions of the same individuals over time, and is not just some artifact of statistical aggregates.
Table 4 shows that 5.2 percent (36 out of 688) of respondents who voted in 1987 changed their voting intention during the campaign, only to bounce back on election day to vote in line with their original intentions. The corresponding percentage for 2005 is 3.7 percent (91 out of 2488 respondents who reported having voted). Those percentages are hardly huge. On the other hand, elections are commonly won or lost by margins of that magnitude.
Unanticipated Elections
There is one further confounding effect that we ought to try to control for, somehow. The argument we have been developing distinguishes sharply between voting intentions before and after the election campaign is underway. But in a world of “permanent campaigning” that distinction may be blurred. In the US, presidential campaigns will have been going on through more than nine months of primaries and caucuses by the time the campaigns officially kick off on Labor Day. Likewise in the UK, a new election must be held within roughly five years of the last, and any government in its fifth year is de facto in “election mode.”Footnote 24 What we have been taking as pre-campaign opinion might, therefore, have been affected by campaigns that have been underway for some time ahead of that—in which case ours would not be a robust test of the hypothesis that people shake off the effects of the campaign in the poll booth.
Of course that problem arises purely from our taking a very conservative definition of when the election campaign begins (Labor Day in the US, elsewhere the day the election is called). But we cannot merely take a more expansive view of when the campaign actually begins (a year prior to the election, for example). Certainly that would wash out all the effects of the campaign. But it would at the same time also wash out far too much that happens over the course of the year, apart from the campaigns themselves—things that voters really ought to take into account when voting.
The UK offers another way of correcting for these effects, however. British governments are legally obliged to call a new election within roughly five years of the last election. But they are allowed to call “snap elections” at any time of their choosing (Her Majesty permitting of course—which by constitutional convention she invariably does).
Insofar as those snap elections were very early and hence substantially unanticipated, there will not have been much electioneering going on in the run-up to them. In such cases, therefore, the government's standing in the polls in our three-week window prior to the election being called is a less contaminated measure of pre-campaign opinion, compared to cases where the government was legally required to hold an election sometime soon.
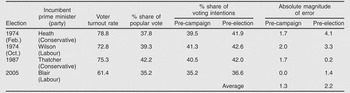
For these purposes we define a snap election as an election that was held more than a year before it was legally required to be. Among the cases reported in table 1, only the four shown in table 5 meet that description.Footnote 25
The performance of pre-campaign and pre-election voting intentions in UK snap elections

Source: Table 1.
From only four cases little can be inferred, of course. Nonetheless, in this, the cleanest test, pre-campaign opinion is even more clearly the better predictor of the electoral outcome three times out of four. Averaging across all those cases, the error in its prediction of the electoral outcome is less than two-thirds that based on pre-election opinion.
Conclusion
Tantalizing evidence therefore suggests that at least some voters indeed might be “responsible” in ways we never imagined. At least three to five percent of them seem to pause in the poll booth to reflect—and having reflected, end up voting differently than they would have done had they not. Three to five percent is not a large proportion of voters, perhaps, but many an election is won by less.
Appendix
Dates of election announcements, Labor Days, and Election Days

Notes:
a Elections announcements were used for the UK and Australia. Labor Days were used for the US.
b In the US, Labor Day is the first Monday in September. Election Day is the first Tuesday after the first Monday in November.
Sources: Coleman, Cantor and Neale Reference Coleman, Cantor and Neale2000, 37–38; Australian Electoral Commission 2005, 50–55; Gay and White Reference Gay and White2007, 14; The Age, various issues.
Supplementary Materials
Explanatory File http://journals.cambridge.org/pps2009003
Opinion Poll Data for the UK http://journals.cambridge.org/pps2009004
Opinion Poll Data for the US http://journals.cambridge.org/pps2009005
Opinion Poll Data for Australia http://journals.cambridge.org/pps2009006
SPSS Code for the British Election Campaign Study 1987 http://journals.cambridge.org/pps2009007
SPSS Code for the British Election Study 2005 Rolling Campaign Panel Survey http://journals.cambridge.org/pps2009008