


Introduction
At VHF frequencies (≈ 100 MHz), ice is one of the most transparent of geophysical materials, and pulses of radio-frequency energy can propagate through it without significant loss for hundreds of metres. This fact has been used extensively in the technique of radio-echo sounding to determine the thickness of some of the world’s large ice sheets (see Reference MacqueenMacqueen, 1988; and references therein). However, the refractive index of an ice sheet is not constant, increasing with depth, and this introduces problems to accurate radio-echo sounding. Expressed in its simplest form, the problem is that a ray travels vertically downwards, is reflected from bedrock, and returns, will take less time to do so than it would if the refractive index were constant at the value appropriate to deep ice. The thickness of the ice mass will thus be underestimated and must be corrected appropriately, by typically 10 m, for accurate determinations of thickness. However, a more complicated problem arises if the underlying bedrock is inclined with respect to the horizontal (and indeed this situation is glaciologically more interesting since the slope of the bedrock is an important source of driving stress on an ice mass). In this case, the ray which reaches the bedrock in the shortest time does not propagate vertically and indeed does not describe a straight line. This causes particular difficulty in determining the point on the bedrock surface at which a ray is reflected and hence in deducing the profile of the bedrock surface.
This problem has been addressed by Reference RasmussenRasmussen (1986), who used a variety of models of n(z)(the variation of refractive index with depth) for which he derived analytic solutions of the ray equations. The resulting correction formulae can be unwieldy in practice, and there exists the possibility that the refractive-index profile of a real ice mass may not be adequately described by the models. In the present paper, we derive a more general approach to the problem, in which no model of n(z) is assumed and corrections to the apparent bedrock position are expressed as polynomial expansions in the bedrock-slope angle. The coefficients of the polynomials are obtained from integrals of n(z), which can be derived directly if n(z) is known, and indirectly but sufficiently accurately if the density profile ρ(z) is known. We analyse a number of density profiles to determine typical values of the coefficients for dry-snow ice masses, so that even if no data are available about the variation of n or ρ with depth, a reasonably accurate correction can be calculated.
Analysis
We assume that the refractive index n of the ice varies only with depth z (and is therefore independent of horizontal position, i.e. the ice is stratified), until it reaches a constant value n i (the refractive index of pure ice) at a depth z f We also assume that the bedrock surface, from which the radio signals are reflected, lies deeper than this value z f In order to simplify the analysis but, without significant loss of generality, we will also assume that the bedrock surface is planar, with a slope parallel to the direction in which the radio-echo-sounding traverse is made (which we will define to be the x indirection). Rays will thus be confined to the x–z plane (see Fig. 1).
A ray follows a curvilinear path from the surface (z = 0) to the point A, beyond which the refractive index of the ice becomes constant. The ray then describes a straight line until it strikes the bedrock perpendicularly at the point P.

A bundle of rays, with a wide spread in angle, is emitted at the origin O of the coordinate system and at time zero, and propagates into the ice. It will be proved below that the ray which reaches the bedrock surface (which is inclined at an angle θ to the horizontal) in the shortest time is the ray which makes an angle θ to the vertical when it is within the region of constant refractive index (z < z f). This ray follows a curvilinear path when z < z f reaching the point A(x f, z f) at time tf, after which it follows a straight path until it reaches the bedrock at the point p(x r, z r) at time T. The ray is reflected at this point, and exactly retraces its path until it reaches O at time 2T. The problem we have to solve is to determine the coordinates (x r, z r) of the point P in terms of the two measurable parameters T (the one-way travel time) and θ (the bedrock slope). We will show below that θ can be determined from the radio-echo sounding measurements.
Following Reference RasmussenRasmussen (1986), we may put

and

for the coordinates of the point A. Beyond A the ray travels in a straight line for a time (T – t f) and hence a distance c(T – t f)/n i until it reaches the bedrock at P. The coordinates of P are thus given by

and

Substituting from Equations (1) and (2), we obtain the desired results:


In these two expressions, the first terms are the usual result (i.e. corrected for slope but uncorrected for refraction) and the following terms represent the refraction corrections.
We can use Equations (3) and (4) to show that the ray which reaches the bedrock in the shortest time must strike it perpendicularly (i.e. that the ray must make an angle of θ to the vertical in the region where the refractive index is constant, if the bedrock makes an angle of θ to the horizontal). The shortest time is significant because this is what is determined by the radio-echo-sounding technique.
Partial differentiation of with respect to θ at constant T gives

and similarly differentiation of Equations 4 gives

Combining Equations (5) and (6) shows that


This result may in turn be used to show how the bedrock slope can be determined from surface obser-varions. Suppose that the shortest travel time to the bedrock is determined from the point O, and also from the point O′ which has x-coordinate ∆X (see Fig. 2).
Determining the bedrock-slope angle θ from surface observations (see text for details).

It is clear that the travel times from O to A and from O′ to A′ must be identical, so the only difference arises from the difference in the path lengths AP and A′P′. If the one-way travel time from O′ to P′ is less than that from O to P by ∆T, it thus follows that

(Reference HarrisonHarrison, 1970). The bedrock slope θ can thus be determined from the rate of change of travel time with surface position, as usual in the relocation of radio-echo-sounding data.
In principle, then, we now have enough information to determine the location (xr, zr) of the point Ρ at which a ray from O is reflected at the bedrock. The bedrock slope is obtained from Equations (7), and the coordinates of the reflection point are then given by Equations (3) and (4). However, these equations are not particularly simple to apply unless the refractive-index profile n(z) can be approximated by a simple analytic expression (e.g. Reference RasmussenRasmussen, 1986).
We adopt a more general approach by expanding the integrals of Equations (3) and (4) as polynomials in sin θ and cos θ Specifically, we may write


where the general integral Ip is defined by

Thus, if n(z) is known, the integrals Ip can be evaluated for different values of ρ and the correction terms obtained from Equations (8) and (9). For practical purposes, however, we may obtain expressions which are rather simpler to use by expanding cos θ and sin θ as polynomials in θ where θ is expressed in radians. In general, we may write

and

It can be shown that the ξi are zero when i is even, and that theζ i are zero when i is odd. The first few non-zero terms are given in Table 1 in terms of the integrals Ip.
The coefficients ξi and ζi of Equations (11) and (12) evaluated in terms of the general integral Ip of the rifractive index defined by Equations 10

Estimation of ξi, and ζ i, For Real Ice Masses
Equations (11) and (12) show how to correct a radio-echo-sounding measurement for the effects of varying refractive index. Application of these equations requires knowledge of the coefficients ξi, and ξi. (Table 1) shows how they may be calculated from the refractive-index profile using the definition of Ip in Equations (10), but n(z) is a parameter which is seldom measured for an ice sheet or a glacier. However, the refractive index n is determined principally by the density ρ, and density profiles ρ(z) are more often available. In this section we discuss the relationship between ρ and n, and analyse a number of published ρ(z) profiles to deduce the corresponding coefficients ξi, ζi.
The simplest physically plausible assumption for the relationship between the density and the refractive index is that of linearity:

The constant K is clearly given by

where n i and ρ i are respectively the refractive index and the density of pure ice. Departures from this relationship are caused mainly by variations in the internal structure of the ice sheet, summarized by a structural parameter known as the Formzahl u. For a ray propagating vertically, a Formzahl u = 0 corresponds to ice in vertical layers, u = 2 to ice with no preferred direction and u = ∞ to horizontal layers of ice. Figure 3 (replotted from Reference EvansEvans (1965)) shows the expected variation of n with ρ for these three values of Formzahl, assuming n i = 1.77 and ρ i = 920 kg m−3 (these numerical values are discussed below).
Refractive index as a function of density of ice (in Mgm−3) for different values of the Formzahl u. The upper curve corresponds to u = ∞, the middle curve to u = 2 and the lower curve to u = 0.

From Figure 3 it can be seen that, if u takes any value between 2 and ∞, the linear assumption of Equations (13) is a reasonably accurate one. Reference EvansEvans (1965) stated that any value between 2 and ∞ must be expected in practice and, since we are unlikely to possess detailed knowledge of the variation of u with depth, there seems little justification in adopting a model more complicated than that of Equations (11).
In order to apply Equations (13) to ρ(z) profiles for real ice masses we must determine the constant Κ from Equations (14). First we consider the density ρ, of pure ice.
At the surface of an ice sheet or glacier, ice is deposited as snow crystals which, after it has settled, has a density of typically 200–300 kg m−3 or 350–400 kg m−3 if packed by wind (Reference SeligmanSeligman, 1936). At greater depths this material is compressed by the mass of the overlying material, increasing the density and resulting in a material which is normally (though erroneously; see Reference PatersonPaterson, 1981) known firn. At a depth sufficient for the density to have reached a value of about 830 kg m−3 (typically about 70 m if the firn is dry, and less if wet), the interconnecting air passages between the grains of ice are sealed off (“bubble close-off”) and the material is more accurately described as glacier ice. This ice is less dense than pure ice because of the trapped air bubbles, and some further increase of density occurs with increasing depth. Temperature effects are also significant in modifying the density, and are discussed below.
Reference Anderson, Benson and KingeryAnderson and Benson (1963) quoted a density value for pure ice under laboratory conditions of 917 kg m−3, and Reference Salamatin, Lipcnkov, Smirnov and ZhilovaSalamatin and others (1985) reported a value of 916.7 kgm−3 for deep glacier ice, although this of course was measured in the laboratory after the core had been retrieved. When this figure is corrected for the effects of pressure, the density of deep ice is found to be about 920 kgm−3. Reference NakawoNakawo (1986) quoted a value of 919.6 ± 0.1 kgm−3 for deep (400 m) ice, which is consistent with Salamatin and others’ measurement. Nakawo’s figure can be corrected for the effects of air bubbles to derive the density of pure ice at a depth of 400 m by assuming that the entrapped air at 70 m depth (bubble close-off) has a volume of 10−4m3kg−1 of ice (Reference Narita and MaenoNakawo, 1986), and that below this it is in temperature and pressure equilibrium with the ice. At a depth of 400 m and a temperature of -35° C, the correction to the density is approximately 1.7 kgm−3, giving a density for pure ice under these conditions of 921.8 ± 0.5 kgm−3. However, Nakawo suggested that his density estimate was too high by approximately 0.5 kg m−3, giving a final figure of 921.3 ± 0.5 kgm−3.
This figure can be compared with the laboratory value by correcting for the compressibility and volumetric thermal expansivity of ice. The effect of an overburden of 400 m of ice is to increase the density by approximately 0.25 kgm−3, assuming a bulk elastic modulus of 13 GPa, and the effect of a temperature of –35° C is to increase the density by approximately 4.9 kgm−3, assuming a volumetric expansivity of 1.53 x 10⁻⁴K−1. Thus, Nakawo’s data are consistent with a density for pure ice under laboratory conditions of 916.5 ± 0.5 kgm−3, which we shall take as a standard.
The refractive index n i of pure (polycrystalline) ice is less well determined than the density, and this will therefore contribute more to the uncertainty in K. Although Reference YoshinoYoshino (1961) reported a weak frequency-dependence in the VHF band, this is now generally discredited (see Reference EvansEvans, 1965; Reference Fitzgerald and ParenFitzgerald and Paren, 1975; Reference RobinRobin, 1975; Reference Bogorodskiy, Bentley and GudmandsenBogorodsky and others, 1985). More significant is a small temperature effect, which decreases the value of n¡ by about 0.02 between –1° C and –60° C (Reference NakawoNakawo, 1986). Statistical combination of avalues of n¡ for pure ice collected by Reference Bogorodskiy, Bentley and GudmandsenBogorodsky and others (1985), and values reported by Reference RobinRobin (1975) and Reference JezekJezek (1985), gives a figure of 1.77 ± 0.01. Since the uncertainty in this result is comparable to the difference produced by large differences in temperature, it is reasonable to accept this value as appropriate to polycrystalline ice at a density of 916.5kgm” and normal glacier temperatures. It is consistent with a more accurate but unpublished measurement at Dye-3 due to Gorman (personal communication). Finally, then, we can evaluate the constant Κ from Equations (14) as (0.77 ± 0.01)/ (916.5 ± 0.5) m3 kg−1. Thus,

at 100 MHz.
This value of Κ has been used to derive profiles of n(z) for profiles of ρ(z) published by a number of workers. In order to obtain a reasonably uniform data set, we have restricted our analysis to dryfirn ice masses, i.e. those for which the depth of bubble close-off is about 70 m, and have excluded measurements from blue-ice areas. The data sets we have used are from Site 2, Greenland (Reference LangwayLangway, 1967), Mizuho, Antarctica (Reference Narita and MaenoNarita and Maeno, 1978), and from G2, Antarctica (Reference NishioNishio, 1984). We also compare our deduced n(z) profiles with direct measurements of n(z) from Devon Island (made at 420MHz by Reference RobinRobin (1975)). Figure 4 shows the n(z) profiles for the upper 200 m of these ice masses. These values of n(z) have been used to evaluate the coefficients ξi and ζi by numerical integration, using (Table 1) and the definition of Ip in Equations (10). The first three terms, in metres, are shown in (Table 2).
VHF refractive index plotted against depth for the data sets discussed in the text.

Experimental values (in m) of the coefficients ξi and ζi for the data sets discussed in the text. The table also shows the estimated value of the depth zf at which bubble close-off occurs, in m

Substitution of various values of θ into Equations (11) and (12), using these six coefficients, shows that the refraction correction can be calculated to a precision of better than 1 m for bedrock angles up to 0.5 rad (29° ). It thus seems unnecessary to calculate any of the higher-order terms. For a dry-snow ice mass whose density profile is unkown, an approximate correction for refraction can be made using the average coefficients (20, 11 and 9 m for the ξs and 9, –10 and –10 for the ξs), and Figure 5 shows the size of these approximate corrections. It can be seen from (Table 2) that the coefficients are similar for different glaciers, so this approach should not introduce a large error as long as the depth to bubble close-off is within the range 50–70 m. In fact, use of these average values gives errors less than 2 m for angles up to 0.5 rad when compared against the coefficients given in (Table 2). The numerical integration shows that approximately half of the correction terms ζ 5 and ζ 0 and ζ0 to ζ4 are built up in the upper 25 m of the firn, so that even limited measurements of the density profile will be better than none.
Typical refraction corrections for an ice sheet whose depth to bubble close-off is about 60 m.

We can also use these average coefficients to estimate the correction for a blue-ice or wet-snow ice mass, since to first order we expect the coefficients to be proportional to the depth of bubble close-off (clearly if this depth is zero, the ice mass is of almost constant refractive index and so the correction terms will be zero).
Generalization to Three Dimensions
The method we have described can be generalized to allow for the possiblity that the bedrock slope is not parallel to the track followed by the radio-echo sounder. We continue to assume that the refractive index varies only with depth z, that the bedrock reflection point is below the depth at which the refractive index becomes constant and that the bedrock surface is planar. Measurements are made on an orthogonal x-y grid of points on the surface.
If we write b (= bx,by, bz) for the unit vector normal to the bedrock surface, the equation of the surface is
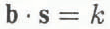
where k is a scalar constant and s is a vector denoting any point in the surface. Consider a ray which passes through the point x located at depth z 0 Since the refractive index is constant below this point, the ray follows a straight path normal to the bedrock, as has already been shown. A point xr on this ray is thus defined by
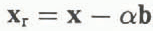
where α is the distance from x. The ray clearly meets the bedrock surface when

so

Thus the total travel time from x to bedrock surface is

Differentiating this partially with respect to X and Y (the x and y-coordinates of the point x) and re-arranging gives

and

which are the three-dimensional equivalents of Equation (7).
Since b is a unit vector,


If this value of θ is substituted into Equations (11), the z-correction will be obtained directly. Substitution into Equations (11) yields the correct magnitude for the horizontal correction, but not its direction. Since the projection of the ray on to a horizontal plane must point in the direction parallel to (b z,b y,0) we may write the x and y corrections x′ r and y′ ras

and

where x r is given by Equations (11).
Conclusions
We have described a simple method for correcting radio-echo-sounding measurements through ice masses for the effects of varying refractive index in the firn layer. This method expresses the corrections to the position of the bedrock reflection point (in the along-track and vertical directions) as polynomials in the bedrock angle 0 (Equations (11) and (12)), and can be generalized to three dimensions. The coefficients of the polynomials can be calculated for a particular ice mass if its refractive index or density profile is known, but examination of measurements of ice masses in Greenland, Antarctica and Devon Island suggests that for dry-snow glaciers the coefficients have fairly well-defined values, and that use of average values is unlikely to introduce errors of more than 3% of the depth to bubble close-off, i.e. typically 0.03 x 60 m = 2 m for typical dry-snow conditions. The coefficient ζ0 is typical of the magnitude of the corrections (it is the correction which should be applied for an ice mass with a horizontal bedrock surface), and our data show that this coefficient varies between about 6 and 10 m under these conditions.
This surprisingly good result probably disguises the effects of varying temperature (and crystal orientation) within an ice mass and should perhaps be treated with some caution. However, the validity (and therefore usefulness) of the method is not seriously compromised by this uncertainty since what we have developed is essentially a method of locating the position of the bedrock reflection given knowledge of the variation of refractive index with depth. Potentially more serious errors, which the radio-echo-sounding technique is at present unable to address, are caused by non-planarity of the bedrock surface over the scale of the Fresnel zone, and by the fact that there may be a layer of mud or till (between the bottom of the ice and the bedrock) which could give rise to anomalous or indeterminate echoes.
Acknowledgements
We are grateful to Dr G.deQ. Robin and two anonymous referees for their helpful comments on this paper.
The accuracy of references in the text and in this list is the responsibility oJ the authors, to whom queries should be addressed.



