Introduction
Several features are necessary for sperm cells in order to fertilize an oocyte, such as motility, normal morphology, sufficient metabolism for energy production, and membrane integrity (Zrimsek et al., Reference Zrimsek, Kunc, Kosec and Mrkun2005). Although several analytical techniques have been developed to evaluate these features, there is no a single method that provides a complete picture of semen quality or complete information for predicting fertility (Rodríguez-Martínez, Reference Rodríguez-Martínez2007).
Metabolism is a basic process of cellular function and biological activities. Reproductive performance depends on several metabolic processes since a fine metabolic activity is necessary for fertilization to occur (Zrimsek et al., Reference Zrimsek, Kunc, Kosec and Mrkun2004). The assessment of metabolic rates of sperm cells could provide pertinent information for evaluating sperm cell quality (Wang et al., Reference Wang, Holyoak, Panter, Liu, Liu, Evans and Bunch1998b). The resazurin reduction seems to be a useful technique to assess the metabolic rate of sperm cells. The analyses of resazurin reduction have been used in human and ovine sperm cells after adaptation of the test previously described to assess the bacterial content of milk, and the quality control of pasteurized and ultra-high temperature-treated food (Rahman & Kula, Reference Rahman and Kula1997; Martin et al., Reference Martin, Crenshaw, Dean, Dart, Purdy and Ericsson1999). Resazurin, as a nontoxic redox dye, allows to follow-up in vivo cellular activity whereas other dyes such as 3-(4,5-dimethylthiazol-2-yl)-2,5-diphenyltetrazolium bromide (MTT) are non-vital (O’Brien et al., Reference O’Brien, Wilson, Orton and Pognan2000; Aziz et al., Reference Aziz, Ahlswede and Enbergs2005; Aziz, Reference Aziz2006; Iqbal et al., Reference Iqbal, Aleem, Ijaz, Rehman and Yousaf2010). Mahmoud et al. (Reference Mahmoud, Comhaire, Vermeulen and Andreou1994) found that the resazurin is a better and more accurate metabolic assay than ATP measurements thanks its higher sensitivity as indicator of cellular dehydrogenase activity.
Inside the cell, resazurin undergoes enzymatic reduction in mitochondria (Czekanska, Reference Czekanska and Stoddart2011). This reaction is manifested by a visual colour change from blue (resazurin) to a spectrum ranging from dark purple to pink (resorufin) and further to a colorless compound (dihydroresorufin) (Erb & Ehlers, Reference Erb and Ehlers1950; Glass et al., Reference Glass, Ericsson, Ericsson, Drouin, Marcoux and Sullivan1991; Zalata et al., Reference Zalata, Lammertijn, Christophe and Comhaire1998). Initially, the colour change of resazurin was usually graded by using colour charts but the measurements were subjective and variable among evaluators (Glass et al., Reference Glass, Ericsson, Ericsson, Drouin, Marcoux and Sullivan1991; Dart et al., Reference Dart, Mesta, Crenshaw and Ericsson1994). Later, Mahmoud et al. (Reference Mahmoud, Comhaire, Vermeulen and Andreou1994), Rahman & Kula (Reference Rahman and Kula1997) and Wang et al. (Reference Wang, Holyoak, Panter, Liu, Liu, Evans and Bunch1998b) developed a spectrophotometric evaluation of the resazurin that provided a quantitative and objective method for measuring metabolic activity.
Resazurin reduction has been used successfully by spectrophotometry or colorimetric methods in several studies to evaluate the quality and fertility potential of semen from humans (Mahmoud et al., Reference Mahmoud, Comhaire, Vermeulen and Andreou1994; Glass et al., Reference Glass, Ericsson, Ericsson, Drouin, Marcoux and Sullivan1991; Rahman & Kula, Reference Rahman and Kula1997; Zalata et al., Reference Zalata, Lammertijn, Christophe and Comhaire1998) and from animals such as stallions (Carter et al., Reference Carter, Ericsson, Corn, Weyerts, Dart, Escue and Mesta1998), bulls (Dart et al., Reference Dart, Mesta, Crenshaw and Ericsson1994), rams (Wang et al., Reference Wang, Holyoak, Panter, Liu, Liu, Evans and Bunch1998b; Martin et al., Reference Martin, Crenshaw, Dean, Dart, Purdy and Ericsson1999) and boars (Zrimsek et al., Reference Zrimsek, Kunc, Kosec and Mrkun2004, Reference Zrimsek, Kosec, Kunc and Mrkun2006). However, some of these studies have described the use of resazurin without standardizing for sperm cell concentration, which could saturate the reaction and give variable results (Erb & Ehlers, Reference Erb and Ehlers1950; Dart et al., Reference Dart, Mesta, Crenshaw and Ericsson1994).
Recent studies have shown that resazurin is a non-fluorescent dye while resorufin is a strong fluorescent redox indicator. Both dyes can be detected by fluorometric methods using a lower concentration of resazurin and fluorimetry, which has a greater sensitivity and a lower detection limit than spectrophotometry (O’Brien et al., Reference O’Brien, Wilson, Orton and Pognan2000; Wang et al., Reference Wang, Holyoak, Liu, Bunch, Evans and Bunch1998a; Gil et al., Reference Gil, Sarun, Biete, Prezado and Sabés2011; Hamoutene et al., Reference Hamoutene, Rahimtula and Payne2000). Besides being able to provide a reliable analysis of metabolic activity of cells, Kuisma et al. (Reference Kuisma, Andersson, Koskinen and Katila2006) described the capacity of resazurin for also evaluating the plasma membrane integrity of cells.
The aim of this study was to develop a new fluorometric method for evaluating metabolic activity of rabbit sperm cells. In this study, we assessed the effect of sperm cell number on the reaction of resazurin reduction, which allows quantitative measurement of sperm cells metabolic activity in rabbit sperm cells. It also enables to study the correlation between metabolic activity and sperm cells features, such as viability, acrosome status, morphology and motility.
Materials and methods
Semen samples
Twenty-five New Zealand White adult rabbit bucks (older than 7 months) from the nucleus of selection of the farm of the Institut de Recerca i Tecnologia Agroalimentaries (IRTA, Torre Marimon, Spain) were used in this study and maintained for commercial purposes. Each animal was housed in a single cage (85 × 40 × 30 cm) equipped with a plastic footrests, a feeder and nipple drinker. Animals were given an all-mash pellet and offered water, both of them ad libitum.
All males began the training to an artificial vagina at 4.5 months of age. A homemade polyvinyl chloride artificial vagina containing water at a temperature of 50ºC was used. One ejaculate was collected per male. Ejaculates which contained urine and calcium carbonate deposits to eye inspection were discarded, and gel plugs were removed. After this initial pre-selection, each sperm sample was diluted 1:3 (vol/vol) in a commercial liquid diluent for rabbit semen (Galap, IVM Technologies, Saint Ouen sur Iton, France). Ejaculates were stored in an isothermal chamber and evaluated within 30 min after collection.
Individual fertility data were not available because pooling ejaculates from several males for heterospermic insemination is a common practice in rabbit AI centres (Tusell et al., Reference Tusell, Legarra, García-Tomás, Rafel, Ramon and Piles2011). Collective fertility with heterospermic inseminations was 85% on average.
Semen analysis perform
Following the determination of the ejaculate volume, concentration and total sperm number with a haemocytometer chamber, sperm morphology and viability were determined by an eosin–nigrosin staining. The eosin–nigrosin staining was performed by mixing 10 μl of sperm sample and 10 μl of the dye solution, smeared onto a glass slide and allowed air drying. Then, the slide was covered with mounting medium and a cover glass. Slides were analyzed using an optical microscope (Motic BA210, Spain) at ×1000 magnification under immersion oil. As many as 200 cells were counted on each slide and the following ratios were calculated: percentage of sperm viability [percentage of sperm cells that remained white or unstained while non-viable sperm cells stained pink or stained, since the integrity of their plasma membranes had been compromised causing an increase in membrane permeability that led to uptake of the dye (Bamba, Reference Bamba1988)], percentage of sperm with acrosome abnormalities (percentage of sperm cells with irregularities in the acrosome membrane), percentage of sperm with morphological abnormalities of head (abnormalities in shape and dimensions), percentage of sperm morphological tail abnormalities (bent tails and coiled tails), percentage of proximal and distal cytoplasmic droplets, and percentage of sperm without tails. The eosin–nigrosin staining provides similar measurements of sperm membrane integrity to those observed using flow cytometry (Foster et al., Reference Foster, Love, Brinsko, Hinrichs, Teague, LaCaze and Blanchard2011), and also allows the sperm morphology analysis.
Motility characteristics were determined using a computer-assisted sperm analysis system (CASA system; Integrated Sperm Analysis System V.1.2.; Proiser SL, Valencia, Spain). The CASA system is based on the analysis of 25 consecutive digital images taken from a single field at a magnification of ×100 in a dark ground in a time lapse of 1 s.
Sample aliquots (5 μl) were previously adjusted to 60 × 106 cells/mL with Galap extender. Aliquots were placed on a pre-warmed slide for 1 min and viewed in a phase contrast microscope equipped with a warmer stage of 37ºC for CASA evaluation.
Four to five separate fields were taken for each sample and a minimum of 200 cells/sample were analyzed. The motility descriptors obtained after CASA analyses were: Curvilinear velocity (VCL), as the mean path velocity of the sperm head along its actual trajectory (units: μm/s); linear velocity (VSL), as the mean path velocity of the sperm head along its average from its first to its last position (units: μm/s); mean velocity (VAP), as the mean velocity of the sperm head along its average trajectory (units: μm/s); linearity coefficient (LIN = (VSL/VCL) × 100 (units: %); straightness coefficient (STR = (VSL/VAP) × 100 (units: %); wobble coefficient (WOB): (VAP/VCL) × 100 (units: %); mean amplitude of lateral head displacement (ALH), as the mean value of the extreme side-to-side movement of the sperm head in each beat cycle (units: μm); and frequency of head displacement (BCF), as the frequency with which the actual sperm trajectory crosses the average path trajectory (units: Hz).
Finally, total motility was defined as the percentage of sperm cells which showed a VAP above 10 μm/s, and progressive as the percentage of sperm cells which showed a VAP above 50 μm/s and 70% of STR.
A sperm index (SI) was calculated by multiplying sperm concentration by the square root of the percentage of sperm motility (% total motility) multiplied by the percentage of morphological normal sperm (Mahmoud et al., Reference Mahmoud, Comhaire, Vermeulen and Andreou1994):
 $$\begin{eqnarray*}
{\rm sperm\, index} &=& {\rm sperm\, concentration}\\
&& \times [{\rm root}](\% \,{\rm total\, motility}\\
&& \times \% \,{\rm normal\, forms}).
\end{eqnarray*}$$
Resazurin reduction test (RRT)
The sperm cell metabolic activity was evaluated by the RRT using the QBlue cell viability test (QBlue Cell Assay kits, Biochain, USA).
In order to determine which concentration of sperm cells was the most appropriate before saturating the reaction of resazurin reduction, four sperm concentrations were assessed at 5 × 10⁶, 10 × 106, 15 × 106 and 20 × 106 sperm cells/ml. Three replicates were performed for each concentration of each sample in this assay.
Concentrations were adjusted to one of the four evaluated sperm concentrations with phosphate-buffered saline (PBS; Sigma, Madrid, Spain). Each sample was placed into a 1.5 ml eppendorf and centrifuged at 4442.7 g for 10 min. The supernatant was discarded and samples were gently resuspended with 100 μl QBlue solution (10% QBlue diluted in PBS).
Blanks were made by taking an equal amount of QBlue solution without sperm cells. All Eppendorfs were incubated at 37ºC in a humidified air atmosphere with 5% CO2 for 25 min. This time of incubation was standardized previously in our laboratory for rabbit sperm cells, and it corresponds to the time required to observe a change of colour in the culture medium from purple to pink. After incubation, samples were immediately centrifuged at 4846.6 g for 10 min. Part of the supernatant (90 μL) of each sample was taken and measured with a Wallac Fluorometry plate reader (VICTOR3 V 1420 multilabel counter, PerkinElmer precisely, Waltham, USA) (excitation wavelength at 550 nm and emission at 615 nm). All procedures were made in the dark to avoid light effects in the wavelength emission. The results of RRT were quantified in relative fluorescence units (RFU).
Statistical analysis
The normal distribution of all parameters was assessed using a Shapiro-Wilk test. Statistical comparison of differences in RRT among the different sperm concentrations was carried out by means of the non-parametric test of Kruskal–Wallis and Mann–Whitney–Wilcoxon. Spearman rank correlation analysis was calculated to determine the correlation between the RRT and semen parameters such as total sperm number, viability, sperm morphology, motility parameters and SI.
All statistical analyses described were performed using the R program (version 2.10.0 ISBN 3–900051–07–0). P-values < 0.05 were considered statistically significant.
Results
Average semen characteristics and range of the samples were as follows [mean ± SD (Min − Max)]: total number of sperm cells: 1020.5 × 106 ± 722.4 × 10⁶ (108 – 2684.5 × 106), viable sperm cells: 80.3% ± 11.3% (46–93.5 %), normal morphology: 75.5% ± 13.4% (37–91.2 %), total motility: 74.4% ± 15.5% (33.8–92.9 %), and progressive motility 34.4% ± 12.8% (12.8–62.8 %).
Relationship between RRT and sperm concentration
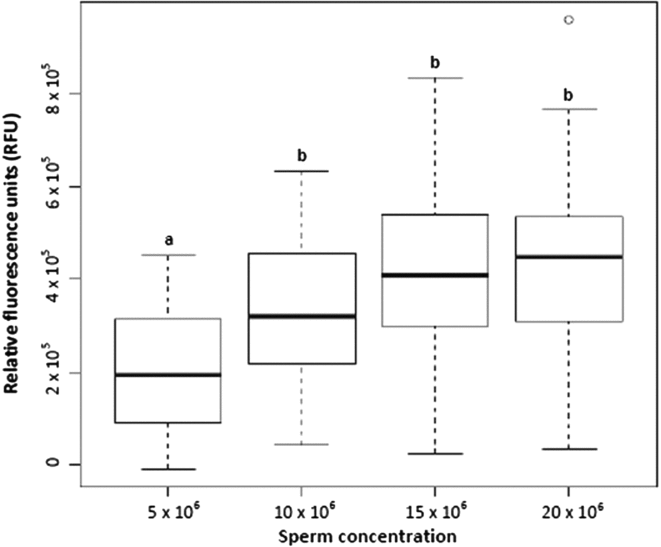
Figure 1 shows that there were significant differences (P < 0.05) between the RFU of the concentration of 5 × 10⁶ sperm cells/ml and the other three evaluated concentrations. No significant differences (P > 0.05) were found among the RFU of 10 × 106, 15 × 106 and 20 × 106 sperm cells/ml concentrations. Taking into account these results, the concentration of 10 × 106 sperm cells/mL was used for further experiments.
Values of the resazurin reduction test in relative fluorescence units (RFU) based on the sperm concentrations evaluated. a,bNote: different scripts between box plots indicate significant differences

Correlation between RRT and sperm viability, acrosome status and morphology
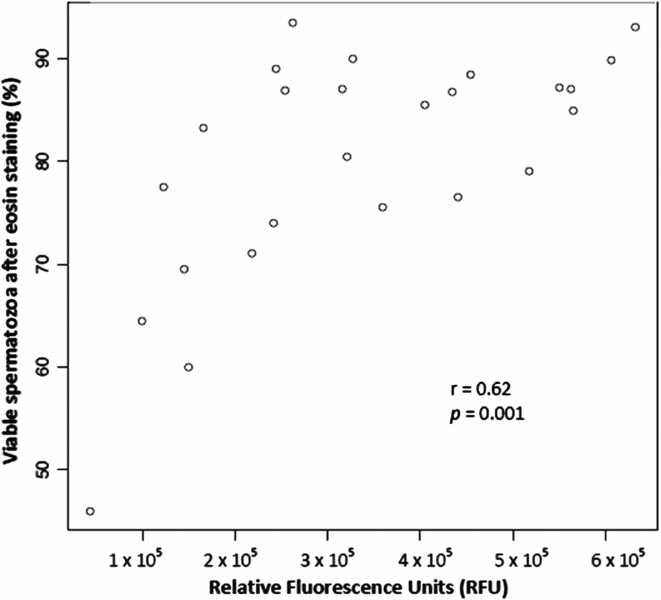
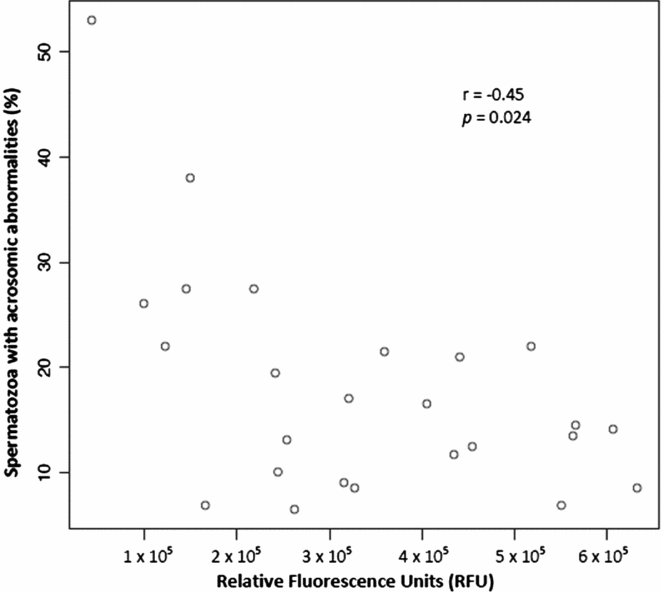
A significant positive correlation between the results of RRT in RFU and the percentage of viable sperm cells was detected (r = 0.62; P = 0.001) (Fig. 2). Additionally, the results of RRT were inversely correlated with the percentage of acrosomic abnormalities (r = −0.45; P < 0.05) (Fig. 3). No significant correlation was found between the results of RRT and the following: abnormalities in shape and head dimensions, cytoplasmic proximal and distal droplets, bent tails, coiled tails, swollen tails and heads without tails (data not shown).
Correlation between the percentage of viable sperm cells and the results of the resazurin reduction test in relative fluorescence units (RFU).

Correlation between the percentage of acrosomic abnormalities and the results of the resazurin reduction test in relative fluorescence units (RFU).

Correlation between RRT and sperm motility parameters
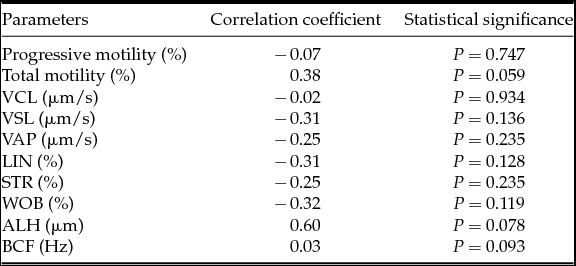
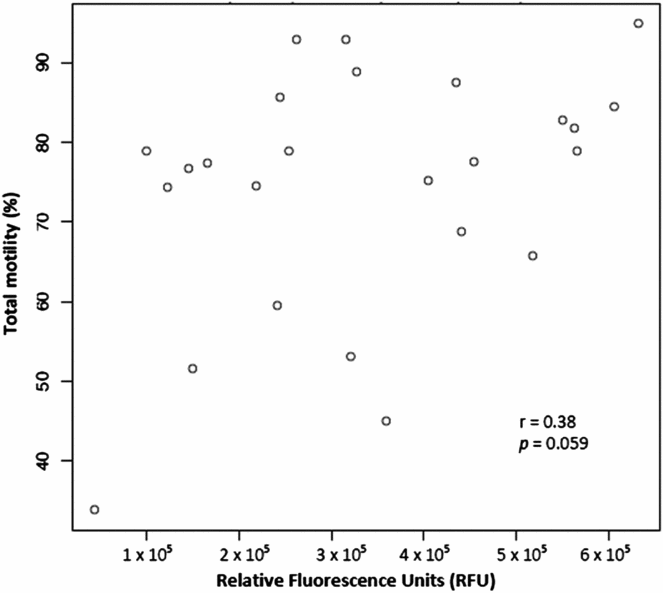
The correlation of the results of RRT with the motility and velocity parameters is shown in Table 1. No significant correlation was found between these parameters. Nonetheless, there was a positive tendency to being significant for the correlation between the results of RRT and total motility (r = 0.38; P = 0.059) (Fig. 4).
Correlation of RRT results with motility and velocity parameters (n = 25, Spearman rank correlation analysis)

Correlation between the percentage of total motility using the CASA system and the results of the resazurin reduction test in relative fluorescence units (RFU).

There was no significant correlation between the results of the RRT and the SI (r = 0.23; P > 0.05).
Discussion
Our results confirm that the RRT determined by fluorimetry is a useful test to quantitatively evaluate the metabolic activity of sperm cells in the rabbit and it is in direct relation to the sperm cell concentration, viability and acrosome integrity.
Previous studies shown that the use of resazurin was cell concentration dependent and thus the efficient prediction of fertility could be related to the time of exposure (Erb & Ehlers, Reference Erb and Ehlers1950; Erb et al., Reference Erb, Ehlers and Flerchinger1952; Glass et al., Reference Glass, Ericsson, Ericsson, Drouin, Marcoux and Sullivan1991; Dart et al., Reference Dart, Mesta, Crenshaw and Ericsson1994; Zalata et al., Reference Zalata, Hafez, Mahmoud and Comhaire1995; Rahman & Kula, Reference Rahman and Kula1997; Carter et al., Reference Carter, Ericsson, Corn, Weyerts, Dart, Escue and Mesta1998; Wang et al., Reference Wang, Holyoak, Panter, Liu, Liu, Evans and Bunch1998b). For this reason, in this experiment a fluorometric method has been developed based on a fixed sperm cells number and a known reduction time of resazurin so to measure sperm cell metabolic activity quantitatively.
Taking into account that the values of RFU for the concentration of 5 × 10⁶ sperm cells/ml was significantly lower than the other three concentrations and that no significant differences were detected among those other concentrations, we suggest the use of 10 × 106 sperm cells/ml for further experiments with the RRT.
A positive correlation of RRT and sperm viability has been demonstrated in this study. Also, it can be stated that the higher percentage of damage, the lower metabolic activity. These results agree with those from Rahman & Kula (Reference Rahman and Kula1997) and Fuse et al. (Reference Fuse, Ohta and Katayama1993) demonstrating a significant correlation between acrosome abnormalities and viability of human sperm cells with the results of resazurin. By contrast, in our study the results of RRT were not related with other sperm morphological parameters.
To the authors’ knowledge, prior to this study and according to the available literature, only one assay had used the reduction of resazurin to evaluate sperm quality in rabbits (El-Battawy, Reference El-Battawy2008). In contrast to our study, this assay used spectrophotometry to evaluate the resazurin reaction, performed a trypan blue/Giemsa staining to determine the acrosomal integrity, evaluated the motility parameters by a subjective score by optical microscopy, and also, did not standardize the initial sperm concentration. Although the staining used to evaluate the acrosomal integrity was different, their results confirm our findings that resazurin reduction values inversely correlates with acrosomal abnormalities. Despite the obvious fact that the metabolic activity is affected by the acrosomal abnormalities of sperm cells, it still represents a significant result and gives additional value to the RRT study.
El-Battawy (Reference El-Battawy2008) observed a significant correlation between the resazurin results and sperm motility. These findings do not totally match with the results from our study. Our results suggest a tendency that total motility could be correlated with resazurin results, but not with other motility parameters such as progressive motility or sperm velocities. A possible explanation for this is that, in our study, motility characteristics were determined by a computer-assisted semen analysis in contrast to the previous study by El-Battawy (Reference El-Battawy2008). CASA facilitates results comparison and enables the finding of subtle differences between treatments increasing accuracy and repeatability (Awad, Reference Awad2011).
Moreover, in the study by El-Battawy (Reference El-Battawy2008), initial sperm cell concentration was not defined. This might eventually saturate the resazurin reaction and consequently give variable or false positive results (Erb & Ehlers, Reference Erb and Ehlers1950; Dart et al., Reference Dart, Mesta, Crenshaw and Ericsson1994).
In other species, it has been reported that resazurin reduction results significantly correlate with sperm concentration and motile sperm cells concentration (Glass et al., Reference Glass, Ericsson, Ericsson, Drouin, Marcoux and Sullivan1991; Dart et al., Reference Dart, Mesta, Crenshaw and Ericsson1994; Mahmoud et al., Reference Mahmoud, Comhaire, Vermeulen and Andreou1994; Zalata et al., Reference Zalata, Hafez, Mahmoud and Comhaire1995; Rahman & Kula, Reference Rahman and Kula1997; Zalata et al., Reference Zalata, Lammertijn, Christophe and Comhaire1998; Martin et al., Reference Martin, Crenshaw, Dean, Dart, Purdy and Ericsson1999; Zrimsek et al., Reference Zrimsek, Kunc, Kosec and Mrkun2004; Eljarah, Reference Eljarah2007). Only Eljarah (Reference Eljarah2007) in bulls, and Zalata et al. (Reference Zalata, Lammertijn, Christophe and Comhaire1998; Reference Zalata, Hafez, Mahmoud and Comhaire1995) and Mahmoud et al. (Reference Mahmoud, Comhaire, Vermeulen and Andreou1994) in humans used a semi-computer-assisted semen analysis to evaluate progressive motility, total motility and linear velocity. Those studies found a positive correlation between resazurin reduction ability and progressive and total motility which is consistent with the findings of the current study.
Further experiments are needed to correlate RRT with fertility after insemination. However, in the rabbit industry heterospermic insemination is a common practice in order to compensate for possible infertile ejaculates. This fact makes the evaluation of individual fertility more difficult when animals are kept for commercial purposes, as it was the case of our study.
In conclusion, the RRT is a vital, simple and reproducible test that can be performed by fluorimetry in the rabbit with a small volume of semen. We suggest that the most appropriate concentration of sperm cells for performing the RRT in rabbit sperm cells seems to be 10 × 106 sperm cells/mL. The assessment of metabolic rates of sperm cells could provide better or more complete information about semen quality than other routine semen analysis. Although further research involving fertility trials using RRT in rabbits is required in order to confirm our findings, we believe this test has a great potential as an additional tool for evaluating semen quality in rabbits.
Acknowledgements
Authors thank Oscar Perucho for technical assistance in animal handling and sample recovery, IBB Service for technical assistance with the RRT.
Financial support
This study was supported by the Ministerio de Economía y Competitividad (Ref. AGL2013–46769-P). Maria Sabés-Alsina and Maria José Maya-Soriano were supported by Predoctoral Research Fellowship (PIF) from the Universitat Autònoma de Barcelona, Bellaterra, Spain.
Conflict of interest
None