


Introduction
Blood clotting is traditionally understood as a thrombin-driven process in which fibrin polymers form structured networks that are susceptible to regulated fibrinolysis; however, under inflammatory conditions, clotting can also originate from prothrombotic seeding areas that give rise to structurally distinct, fibrinolysis-resistant assemblies. In healthy haemostasis, these fibres form branching networks whose architecture is influenced by fibrinogen concentration, thrombin generation, flow, and cross-linking. In the electron microscope, these appear like spaghetti (Weisel and Litvinov, Reference Weisel and Litvinov2017; Pretorius et al., Reference Pretorius, Page, Mbotwe and Kell2018b).
However, blood can also clot into anomalous forms that are significantly resistant to fibrinolysis and that in the electron microscope appear instead as ‘dense matted deposits’ that take on the appearance of parboiled spaghetti that has been allowed to congeal (e.g., (Pretorius et al., Reference Pretorius, Oberholzer, van der Spuy and Meiring2010; Pretorius et al., Reference Pretorius, Vermeulen, Bester and Lipinski2013a; Swanepoel et al., Reference Swanepoel, Visagie, de Lange, Emmerson, Nielsen and Pretorius2016).
Based on staining using a variety of established amyloid dyes, this form was seen as being consistent with these structures being amyloid in nature (Pretorius et al., Reference Pretorius, Mbotwe, Bester, Robinson and Kell2016b), involving the kind of cross-β sheets seen in prion diseases and classical amyloidoses (Kell and Pretorius, Reference Kell and Pretorius2017). These observations suggest that pathological clotting does not simply reflect dysregulated thrombin activity; one mechanism is that of surface-driven nucleation processes in which damaged biological interfaces act as catalytic scaffolds for amyloidogenic fibrin(ogen) assembly. We have referred to these microclot complexes as fibrinaloid, and they typically possess a diameter in the range 2–200 μm. They also contain neutrophil extracellular traps (NETs (Thierry et al., Reference Thierry, Usher, Sanchez, Turner, Venter, Pastor, Waters, Thompson, Mirandola, Pisareva, Prevostel, Laubscher, Kell and Pretorius2025). Importantly, these complexes represent heterogeneous phenotypic forms, reflecting their origins on distinct seeding substrates, such as membrane debris, microparticles, NET-derived nucleoprotein scaffolds, and plasma protein aggregates.
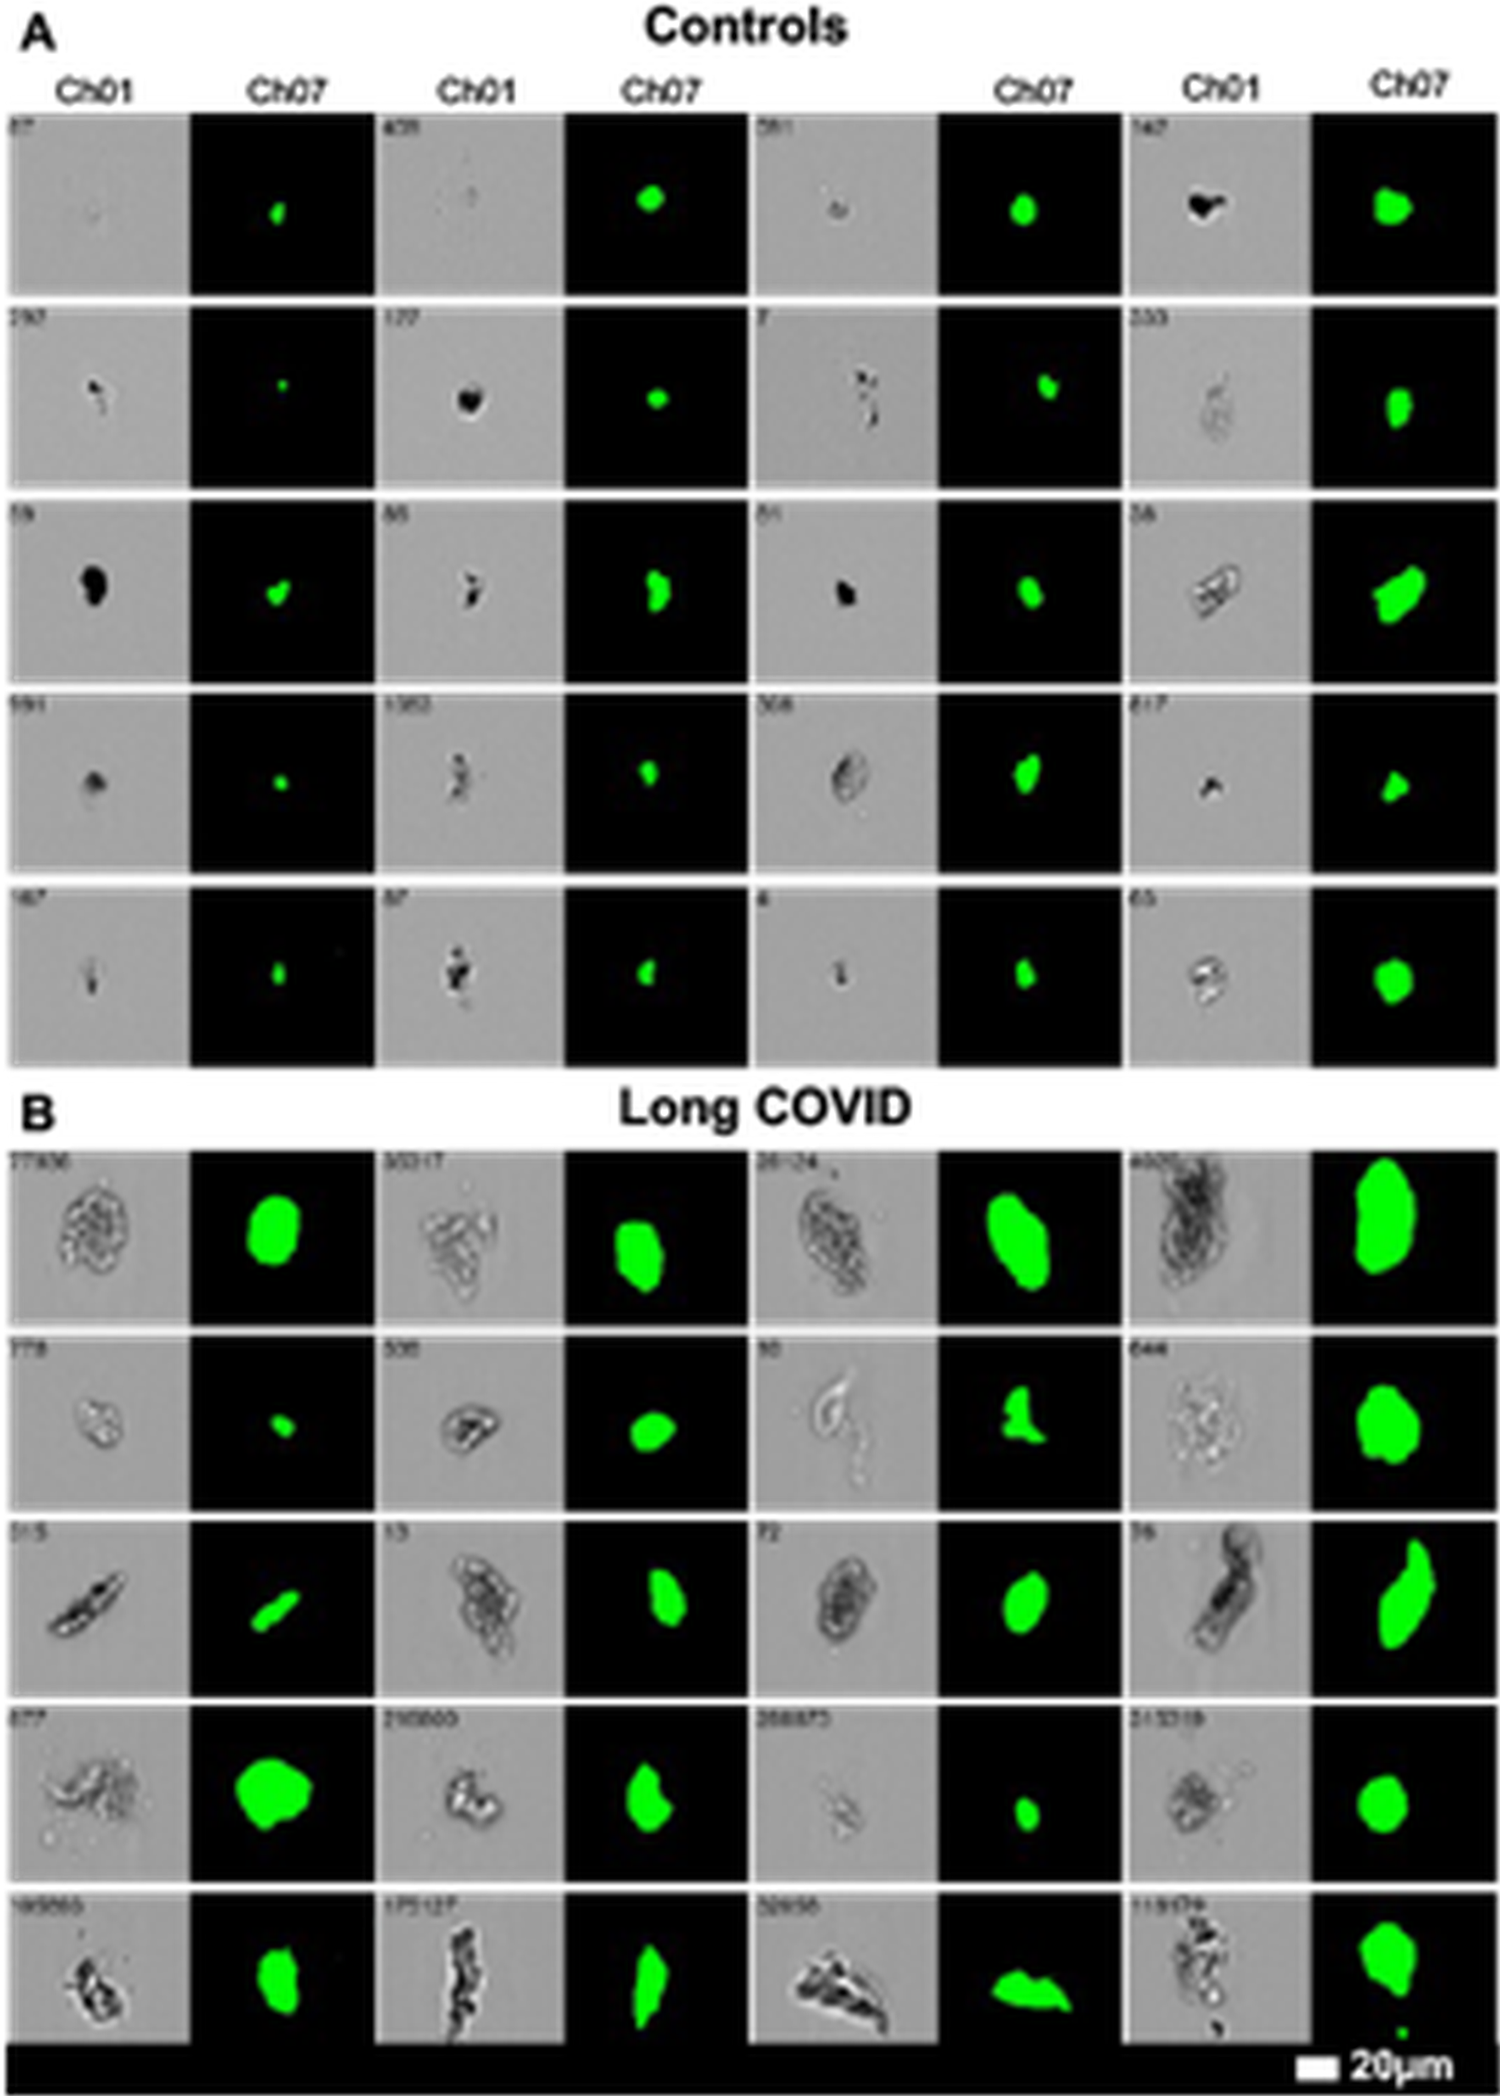
The fibrinaloid microclot complexes are typically observed using fluorogenic amyloid stains such as thioflavin T (Biancalana and Koide, Reference Biancalana and Koide2010; Gade Malmos et al., Reference Gade Malmos, Blancas-Mejia, Weber, Buchner, Ramirez-Alvarado, Naiki and Otzen2017; Xue et al., Reference Xue, Lin, Chang and Guo2017) or the oligothiophene ‘Amytracker’ dyes (de Waal et al., Reference de Waal, Engelbrecht, Davis, de Villiers, Kell and Pretorius2018; Pretorius et al., Reference Pretorius, Page, Engelbrecht, Ellis and Kell2017b, Reference Pretorius, Page, Hendricks, Nkosi, Benson and Kell2018a). As is well known, amyloids are much more resistant to normal proteolysis than the soluble forms formed at the ribosome. Figure 1 shows examples of representative microclot complexes stained with Thioflavin T and detected with imaging flow cytometry. Together, these findings are considered to define a mechanistically distinct mode of clot formation in which smaller amyloidogenic, surface-seeded complexes can precede and potentially drive the development of larger, clinically relevant thrombotic structures, as is common in classical amyloidoses.
Fibrinaloid microclot complexes stained with Thioflavin T (ThT) as detected in platelet-poor plasma (PPP) using imaging flow cytometry. Image taken from the CC-BY 4.0 publication (Turner et al., Reference Turner, Laubscher, Khan, Kell and Pretorius2023b): (a) Controls and (b) Long Covid.

Figure 1. Long description
The photo is divided into two horizontal sections, A and B, each containing a grid of microscopic images.
* Section A is titled Controls. It consists of five rows and eight columns. The columns alternate between C h 01, which shows brightfield grayscale images of small particles, and C h 07, which shows corresponding fluorescent green signals from Th T staining. The particles in this section are generally small, sparse, and appear as tiny dark specks in brightfield and small green dots in fluorescence.
* Section B is titled Long C O V I D. It follows the same five-row, eight-column alternating format of Ch 01 and Ch 07. In contrast to the controls, the microclot complexes here are significantly larger, more numerous, and exhibit irregular, fibrous shapes. The green fluorescent signals in the C h 07 columns are much brighter and cover larger surface areas, indicating a higher concentration of amyloid-like protein structures.
* A scale bar at the bottom right indicates 20 micrometers. Each individual image frame contains a small identification number in the top-left corner.
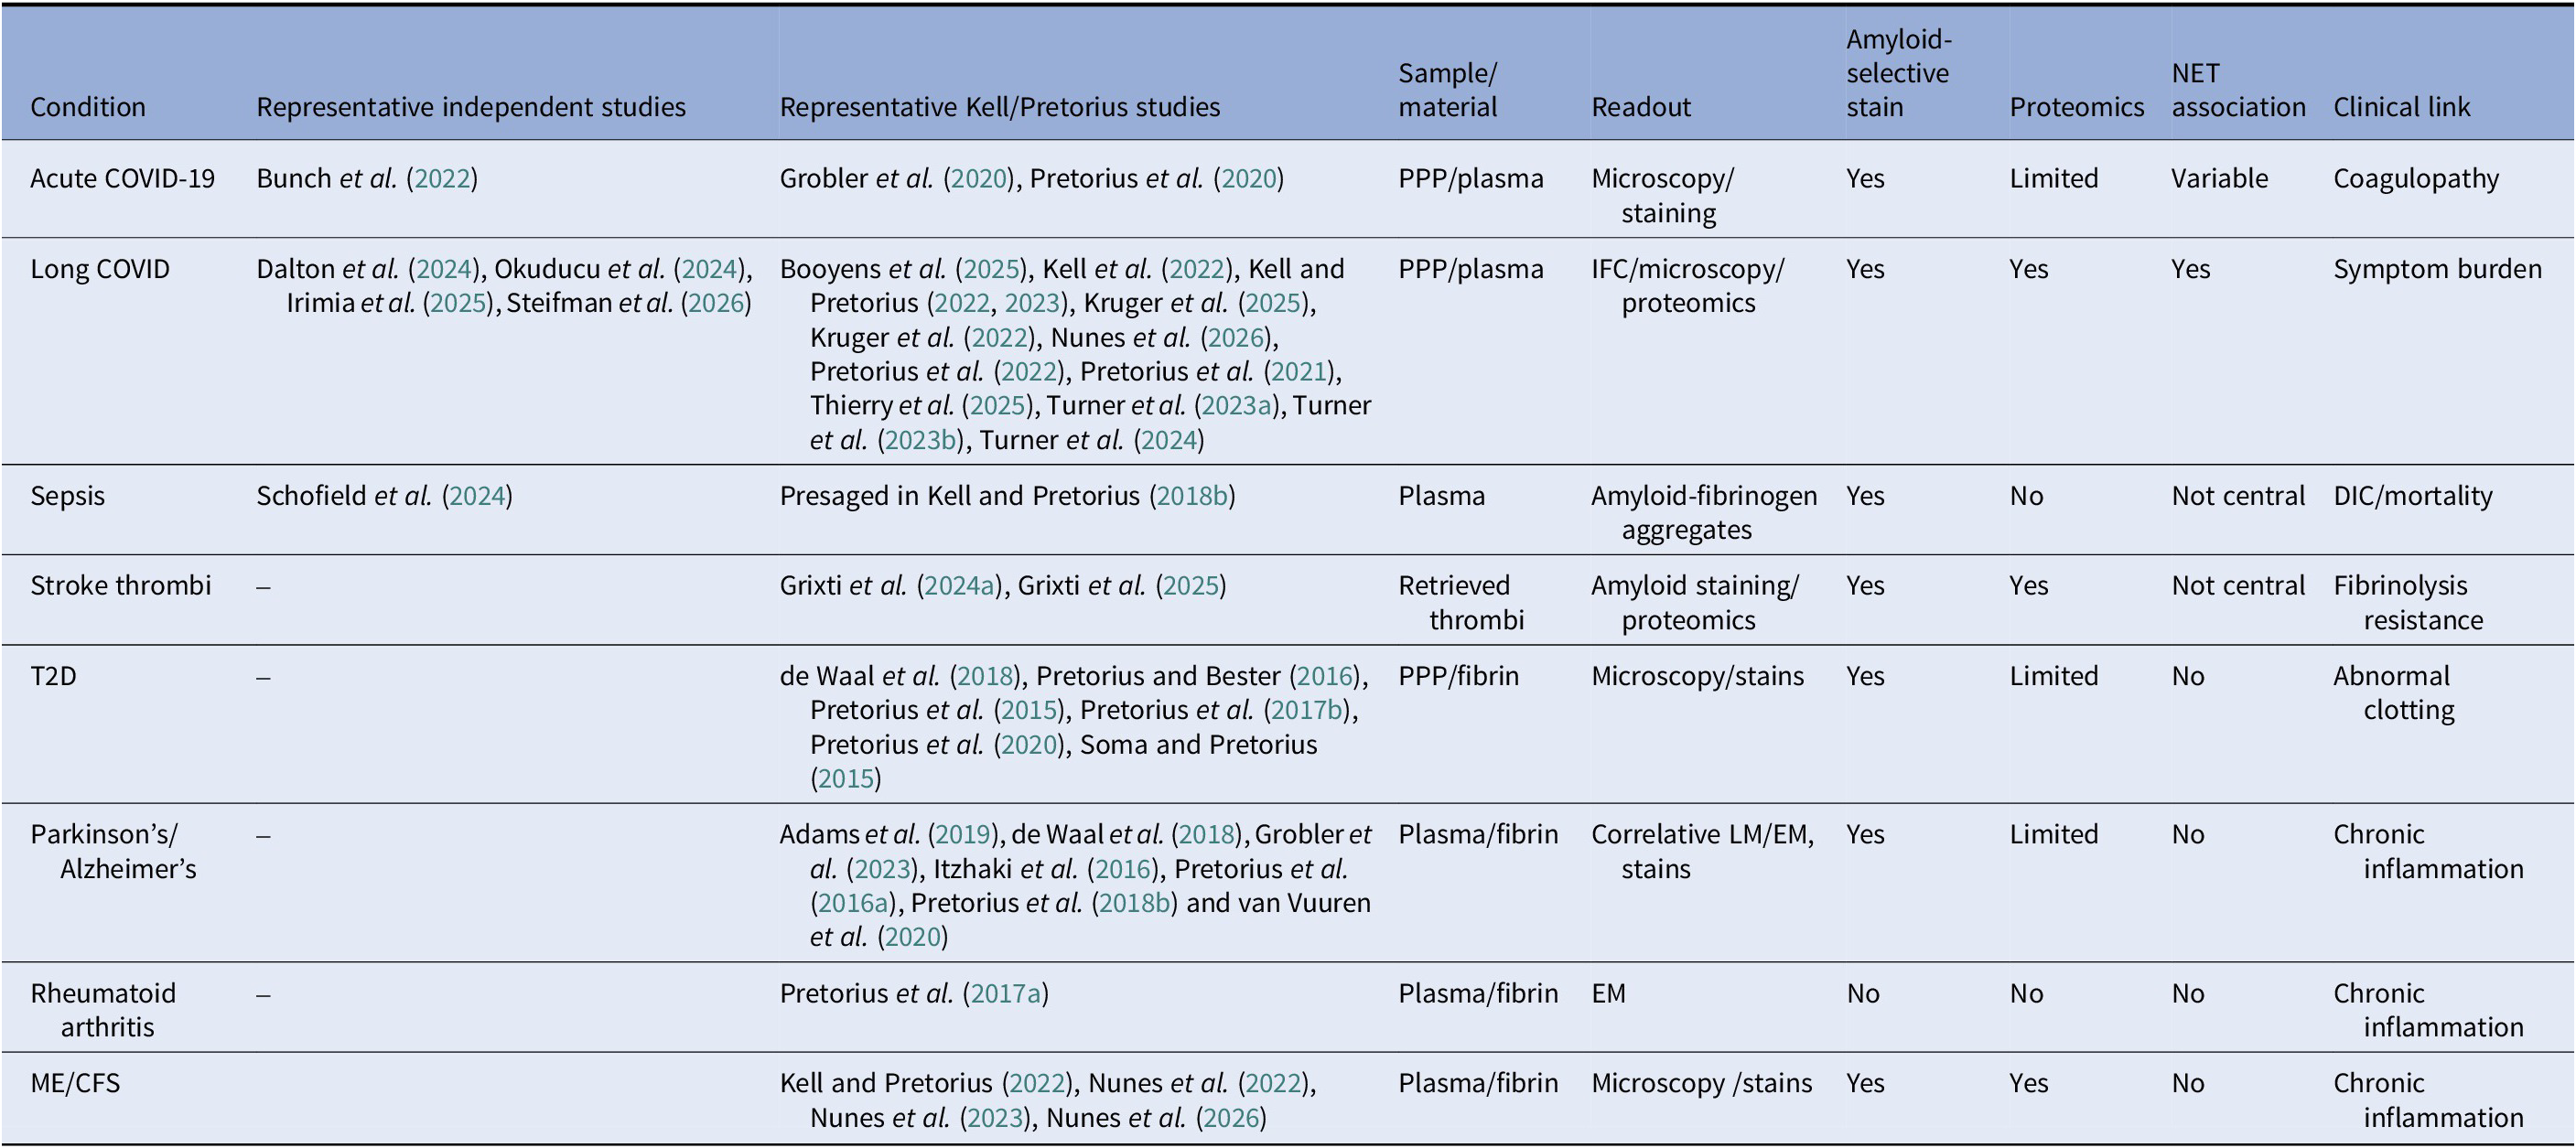
Fibrinaloid microclot complexes have now been reported across a widening range of inflammatory and thrombo-inflammatory conditions (Kell and Pretorius, Reference Kell and Pretorius2018a) (Table 1), including acute COVID-19, Long COVID, sepsis, type 2 diabetes, Parkinson’s disease, rheumatoid arthritis, and Alzheimer-related syndromes, with support coming both from our own studies and from independent groups. However, while the presence of fibrinaloid microclot complexes has been observed across these diverse conditions, detailed mechanistic characterization of their phenotypes and their origins from specific prothrombotic seeding areas has not been uniformly established.
Summary of representative evidence for fibrinaloid microclot complexes across selected disease settings

Table 1. Long description
The table consists of nine columns: Condition, Representative independent studies, Representative Kell/Pretorius studies, Sample/material, Readout, Amyloid-selective stain, Proteomics, NET association, and Clinical link.
* Acute COVID-19: Studies by Bunch et al., Grobler et al., and Pretorius et al. using P P P or plasma. Readout via microscopy/staining. Amyloid stain: Yes. Proteomics: Limited. NET association: Variable. Clinical link: Coagulopathy.
* Long COVID: Extensive studies including Dalton et al., Okuducu et al., and numerous Kell/Pretorius studies. Sample: PPP or plasma. Readout: IF C, microscopy, and proteomics. Amyloid stain: Yes. Proteomics: Yes. NET association: Yes. Clinical link: Symptom burden.
* Sepsis: Studies by Schofield et al. and Kell/Pretorius. Sample: Plasma. Readout: Amyloid-fibrinogen aggregates. Amyloid stain: Yes. Proteomics: No. NET association: Not central. Clinical link: D I C or mortality.
* Stroke thrombi: Kell/Pretorius studies (Grixti et al.). Sample: Retrieved thrombi. Readout: Amyloid staining and proteomics. Amyloid stain: Yes. Proteomics: Yes. NET association: Not central. Clinical link: Fibrinolysis resistance.
* T2 D: Kell/Pretorius studies. Sample: PP P or fibrin. Readout: Microscopy/stains. Amyloid stain: Yes. Proteomics: Limited. NET association: No. Clinical link: Abnormal clotting.
* Parkinson’s/Alzheimer’s: Kell/Pretorius studies. Sample: Plasma or fibrin. Readout: Correlative L M or E M and stains. Amyloid stain: Yes. Proteomics: Limited. N E T association: No. Clinical link: Chronic inflammation.
* Rheumatoid arthritis: Kell/Pretorius studies. Sample: Plasma or fibrin. Readout: E M. Amyloid stain: No. Proteomics: No. N E T association: No. Clinical link: Chronic inflammation.
* ME/CFS: Kell/Pretorius studies (Nunes et al.). Sample: Plasma or fibrin. Readout: Microscopy/stains. Amyloid stain: Yes. Proteomics: Yes. NET association: No. Clinical link: Chronic inflammation.
The table distinguishes disease context, study provenance, material analysed, analytical modality, and the type of supporting evidence. It is intended as an evidence map rather than an exhaustive systematic review.
To date, such phenotypic resolution, including the identification of distinct seeding substrates such as cellular debris, microparticles, and nucleoprotein complexes, has been most clearly demonstrated in COVID-19, Long COVID, and type 2 diabetes. In contrast, in other disease settings, fibrinaloid microclots have largely been described at the level of presence, morphology, or proteomic enrichment, without explicit discrimination of their underlying phenotypic diversity or seeding mechanisms.
The thrombi causing ischaemic stroke also display amyloid (Grixti et al., Reference Grixti, Chandran, Pretorius, Walker, Sekhar, Pretorius and Kell2024a, Reference Grixti, Chandran, Pretorius, Walker, Sekhar, Pretorius and Kell2025), and the fibrinaloid microclots can be formed using just purified fibrinogen, thrombin, and a suitable trigger molecule (Grixti et al., Reference Grixti, Chandran, Pretorius, Walker, Sekhar, Pretorius and Kell2024a; Pretorius et al., Reference Pretorius, Mbotwe, Bester, Robinson and Kell2016b).
Several triggers of amyloidogenic clotting have been observed experimentally, including ferric ions (Pretorius et al., Reference Pretorius, Vermeulen, Bester and Lipinski2013a, Reference Pretorius, Vermeulen, Bester, Lipinski and Kell2013b, Reference Pretorius, Bester, Vermeulen, Lipinski, Gericke and Kell2014; Pretorius and Kell, Reference Pretorius and Kell2014), bacterial lipopolysaccharide (LPS) (Pretorius et al., Reference Pretorius, Mbotwe, Bester, Robinson and Kell2016b), lipoteichoic acids (Pretorius et al., Reference Pretorius, Page, Hendricks, Nkosi, Benson and Kell2018a), and the SARS-CoV-2 spike protein (Grobbelaar et al., Reference Grobbelaar, Venter, Vlok, Ngoepe, Laubscher, Lourens, Steenkamp, Kell and Pretorius2021. These have all been found to trigger the amyloidogenic clotting, often at minuscule levels (Pretorius et al., Reference Pretorius, Mbotwe, Bester, Robinson and Kell2016b).
The SARS-CoV-2 spike protein is itself highly amyloidogenic (Nyström and Hammarström, Reference Nyström and Hammarström2022; Westman et al., Reference Westman, Hammarström and Nyström2025), its amyloidogenicity (in different strains of SARS-CoV-2) being related to the virulence of the strains (Grobbelaar et al., Reference Grobbelaar, Kruger, Venter, Burger, Laubscher, Maponga, Kotze, Kwaan, Miller, Fulkerson, Huff, Chang, Wiarda, Bunch, Walsh, Raza, Zamlut, Moore, Moore, Neal, Kell and Pretorius2022). Taken together, these findings are consistent with the view that clot amyloidogenesis can lie on an important disease pathway.
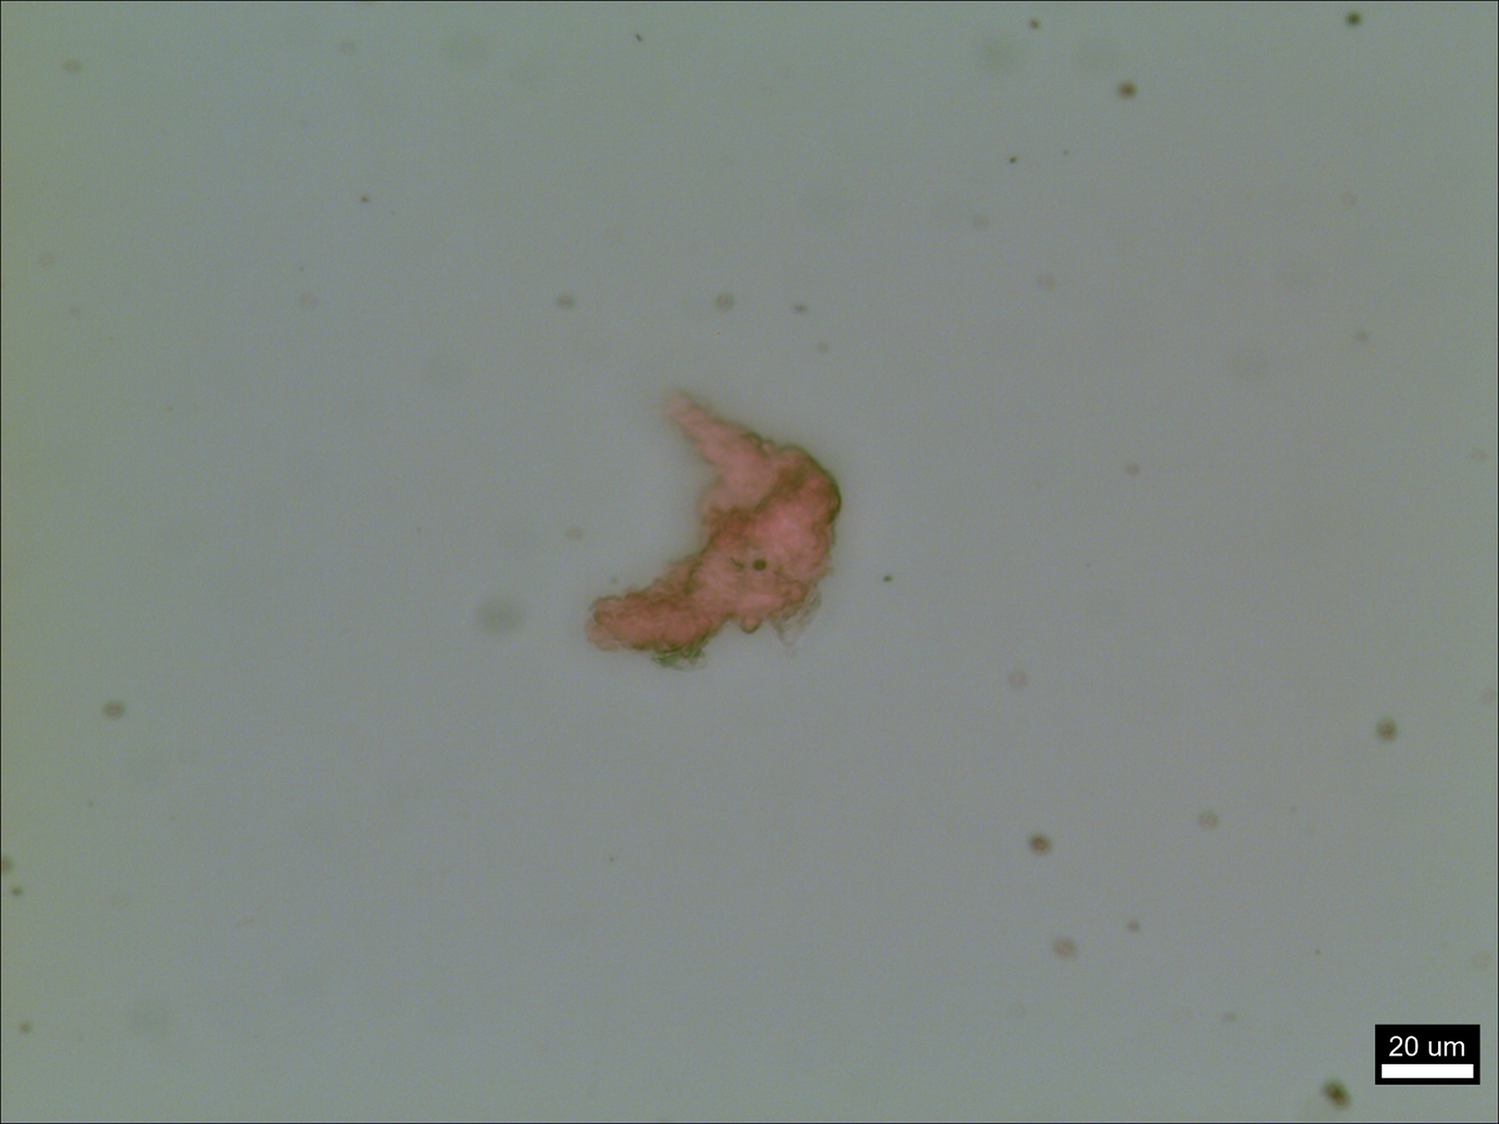
It is recognised that thioflavin T, while seen as a gold standard amyloid stain (Biancalana et al., Reference Biancalana, Makabe, Koide and Koide2009; Xue et al., Reference Xue, Lin, Chang and Guo2017), is not entirely specific for amyloid (Thierry et al., Reference Thierry, Usher, Sanchez, Turner, Venter, Pastor, Waters, Thompson, Mirandola, Pisareva, Prevostel, Laubscher, Kell and Pretorius2025). To this end, we have also employed the more selective oligothiophene ‘Amytracker’ dyes, again showing that they stained fibrinaloid microclot complexes (e.g., see de Waal et al., Reference de Waal, Engelbrecht, Davis, de Villiers, Kell and Pretorius2018; Pretorius et al., Reference Pretorius, Page, Engelbrecht, Ellis and Kell2017b, Reference Pretorius, Page, Hendricks, Nkosi, Benson and Kell2017c, 2018a). Another ‘classical’ amyloid dye is Congo Red, which shows an ‘apple-green’ birefringence when illuminated with polarised light (e.g., see Elghetany et al., Reference Elghetany, Saleem and Barr1989; Howie, Reference Howie2015; Yakupova et al., Reference Yakupova, Bobyleva, Vikhlyantsev and Bobylev2019; cf. Howie, Reference Howie2024). We here show, for the first time, fibrinaloid microclots assessed in this way with Congo Red.
Figure 2 shows images of a fibrinaloid microclot created in vitro (as per (Grixti et al., Reference Grixti, Theron, Salcedo-Sora, Pretorius and Kell2024b; Pretorius et al., Reference Pretorius, Mbotwe, Bester, Robinson and Kell2016b)), stained with the classical amyloid dye Congo Red (Dapson, Reference Dapson2018) and assessed using a polarising microscope as described in Methods, below. It displays the classical ‘apple green’ birefringence, providing further evidence for the amyloid nature of the microclots.
A fibrinaloid microclot created using purified fibrinogen and thrombin as in Methods, stained with 0.3 mM Congo Red, and imaged in a polarising microscope as in Methods. The classical ‘apple-green’ birefringence is observed in particular around the periphery of the microclot.

In Long COVID, increased FMC burdens have been reported in platelet-poor plasma by more than one group (Dalton et al., Reference Dalton, de Oliveira, Stafford, Peake, Kane, Higham, Singh, Jackson, Davies, Price, Duncan, Tattersall, Barnes and Smith2024; Okuducu et al., Reference Okuducu, Boribong, Ellett, Hajizadeh, VanElzakker, Haas, Pillai, Fasano, Irimia and Yonker2024; Irimia et al., Reference Irimia, Gill, Alvarez-Carcamo, Steifman, Swank, Walt, VanElzakker and Yonker2025; Steifman et al., Reference Steifman, Alvarez-Carcamo, Verma, McCarthy, Guthrie, Gill, Swank, Walt, Grabowski, Fasano, VanElzakker, Irimia and Yonker2026), although with inter-individual variability and continuing debate over assay standardisation and interpretation. These observations are consistent with the broader concept that persistent thrombo-inflammation, endothelial activation, and impaired fibrinolysis may contribute to symptom burden in at least a subset of patients. Within this framework, microcirculatory impairment provides one plausible route by which diverse symptoms may arise, although the degree of causal contribution is still being defined.
The effect of these insoluble FMCs is potentially to partially block or interfere with blood flow in microcapillaries (the ‘microcirculation’) and hence O2 transfer to tissues. Taking Long COVID as an example, such a blockage can straightforwardly and self-consistently explain a great many symptoms that accompany this highly variable syndrome, including fatigue (Kell et al., Reference Kell, Laubscher and Pretorius2022), post-exertional malaise (Kell and Pretorius, Reference Kell and Pretorius2022), autoimmunity (Kell and Pretorius, Reference Kell and Pretorius2023), atrial fibrillation (Kell et al., Reference Kell, Lip and Pretorius2024b), fibromyalgia (Kell and Pretorius, Reference Kell and Pretorius2026), POTS (Kell et al., Reference Kell, Khan, Kane, Lip and Pretorius2024a), and tinnitus (Kell and Pretorius, Reference Kell and Pretorius2025a). This said, we do recognise that other mechanisms are also involved.
Emerging evidence also indicates that FMCs represent a spectrum of structurally and mechanistically distinct entities rather than a single homogeneous clotting product. While earlier work has focused primarily on fibrin(ogen)-derived amyloid formation, it is now clear that a substantial proportion of these complexes originate from prothrombotic seeding areas, including cellular debris, membrane fragments, microparticles, and nucleoprotein immune structures. These debris-associated complexes are fundamentally different from classical fibrin networks in that they do not form through thrombin-driven polymerisation, do not integrate into organised fibrin fibre architectures, and are largely resistant to conventional plasmin-mediated fibrinolysis. In parallel, a related but distinct process occurs in which soluble inflammatory and amyloidogenic molecules interact with fibrinogen and, upon thrombin activation, become incorporated into fibrin networks, giving rise to the dense matted deposits previously described. These observations support the existence of at least two overlapping but mechanistically distinct pathways: (i) surface-seeded formation of debris-associated fibrinaloid complexes, and (ii) thrombin-mediated formation of structurally altered fibrin networks incorporating inflammatory components. This distinction is critical, as conventional coagulation and fibrinolysis assays are likely to capture only the latter, thereby underestimating or entirely missing the presence of debris-associated fibrinaloid structures and contributing to ongoing discrepancies in the literature.
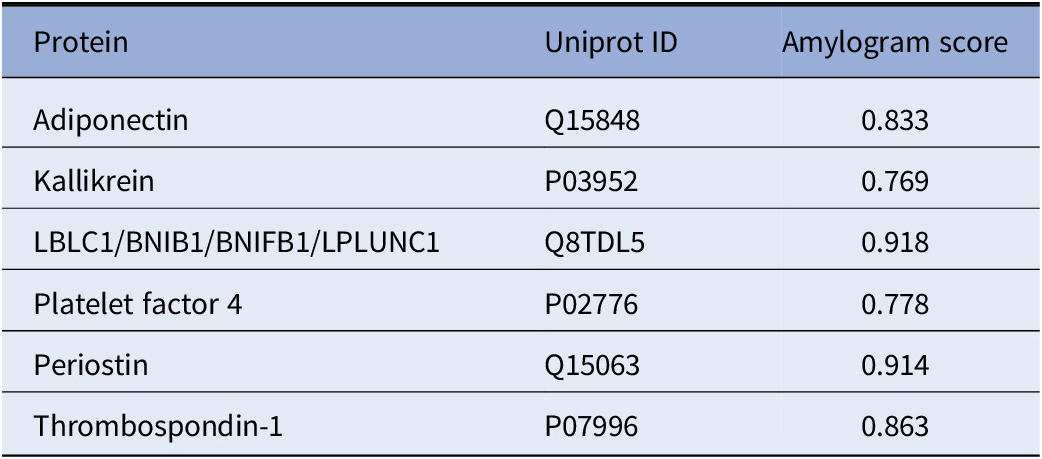
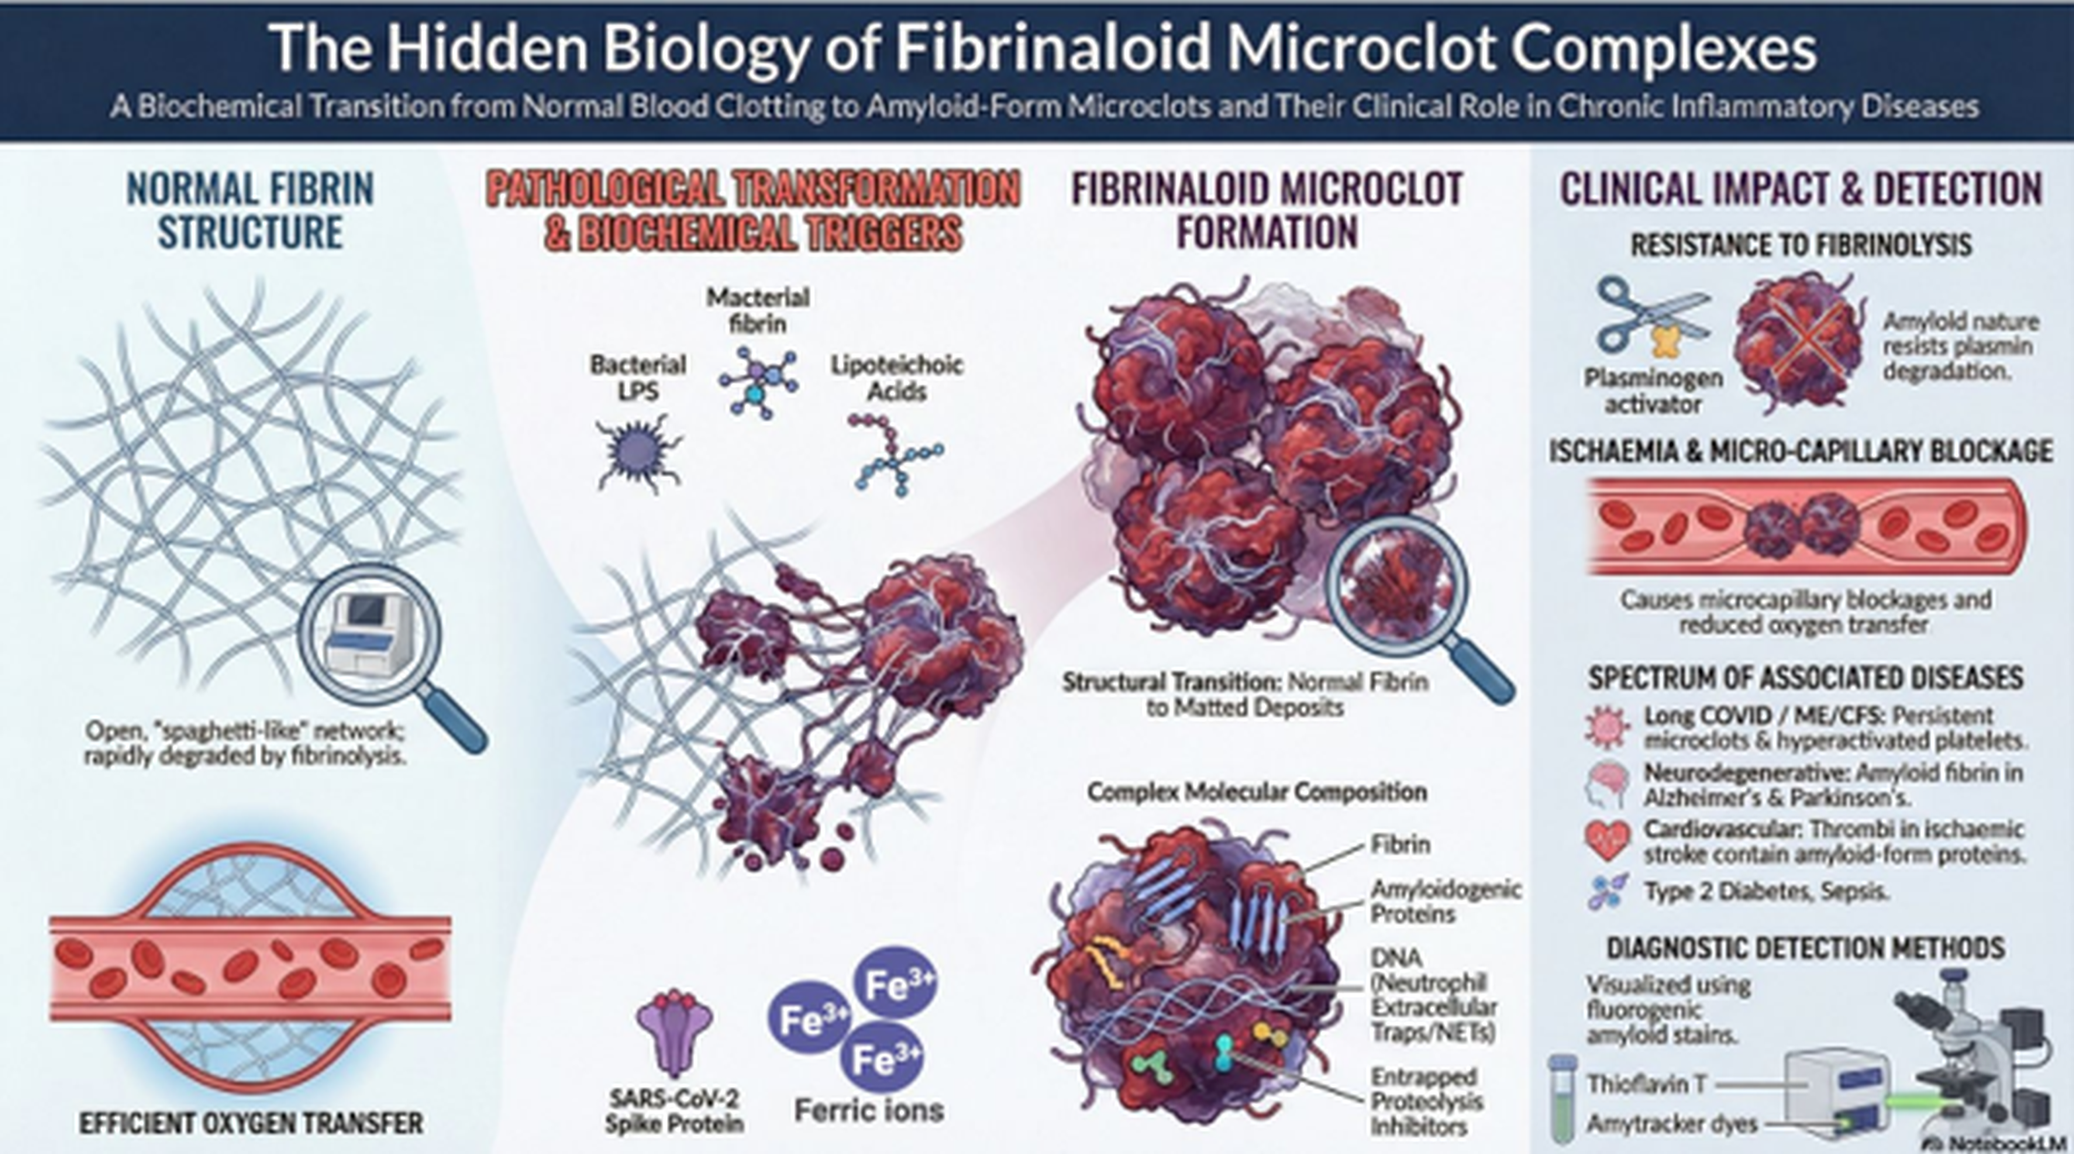
We have used the Amylogram programme (Burdukiewicz et al., Reference Burdukiewicz, Sobczyk, Rödiger, Duda-Madej, Mackiewicz and Kotulska2017; Szulc et al., Reference Szulc, Burdukiewicz, Gąsior-Głogowska, Wojciechowski, Chilimoniuk, Mackiewicz, Šneideris, Smirnovas and Kotulska2021) to assess the amyloidogenicity of individual proteins (the output is a score between 0 and 1, with anything over ca 0.75 being significantly and experimentally amyloidogenic (Kell et al., Reference Kell, Doyle, Salcedo-Sora, Sekhar, Walker and Pretorius2025). The proteome of normal thrombi (Ząbczyk et al., Reference Ząbczyk, Stachowicz, Natorska, Olszanecki, Wiśniewski and Undas2019) largely reflects that of the soluble plasma proteome. However, the proteomes of the various fibrinaloid microclot complexes are very different, with the proteins that are enriched in them being themselves highly amyloidogenic (Kell et al., Reference Kell, Doyle, Salcedo-Sora, Sekhar, Walker and Pretorius2025; Kell and Pretorius, Reference Kell and Pretorius2024, Reference Kell and Pretorius2025b). Table 2 shows proteins enriched in the microclots, a dataset (Kell and Pretorius, Reference Kell and Pretorius2024) to which we have added their Amylogram scores. Each of these exceeds 0.75, some by a considerable margin. One explanation is simply that this is caused by cross-seeding of these amyloidogenic proteins catalysing the transition to the amyloid form, and that the macroclots in ischaemic stroke and other cardiovascular diseases can form via accretion of these microclots. Of course, their amyloid nature again straightforwardly explains their resistance to the normal fibrinolysis that would be catalysed by plasmin. A pictorial summary is given in Figure 3.
Proteins enriched or lowered in fibrinaloid microclots relative to normal clots (Kell and Pretorius, Reference Kell and Pretorius2024), with their Amylogram scores

Table 2. Long description
The table consists of three columns: Protein, UNIPROT ID, and Amylogram score.
* Adiponectin: UNIPROT ID Q1 58 48, Amylogram score 0.833.
* Kallikrein: UNIPROT ID P03952, Amylogram score 0.769.
* LBLC1/BNIB1/BNIFB1/LPLUNC1: UNIPROT ID Q8TDL5, Amylogram score 0.918.
* Platelet factor 4: UNIPROT ID P02776, Amylogram score 0.778.
* Periostin: UNIPROT ID Q15063, Amylogram score 0.914.
* Thrombospondin-1: UNIPROT ID P07996, Amylogram score 0.863.
A summary of fibrinaloid microclot complexes. This figure (and also the graphical abstract) was generated on 23 April 2026 with the assistance of the artificial intelligence tool NotebookLM (https://notebooklm.google/), using author-provided text and figure concepts; all scientific content, interpretation, and final design decisions were verified and approved by the authors.

Figure 3. Long description
Panel 1, Normal Fibrin Structure. Top shows an open spaghetti-like network of thin blue fibers. A magnifying glass highlights the porous nature. Bottom shows a cross-section of a blood vessel with red blood cells flowing freely, labeled Efficient Oxygen Transfer.
Panel 2, Pathological Transformation and Biochemical Triggers. Triggers include Bacterial L P S, Macterial fibrin, Lipoteichoic Acids, SARS-CoV-2 Spike Protein, and Ferric ions (F e 3 super plus). These triggers interact with the fibrin network, causing it to collapse into dense, dark red matted deposits.
Panel 3, Fibrinaloid Microclot Formation. Top shows a cluster of large, dense red microclots. A magnifying glass shows the structural transition from normal fibrin to matted deposits. Bottom shows a Complex Molecular Composition diagram of a single microclot containing Fibrin, Amyloidogenic Proteins, DNA (Neutrophil Extracellular Traps or NETs), and Entrapped Proteolysis Inhibitors.
Panel 4, Clinical Impact and Detection. Top section, Resistance to Fibrinolysis, shows a pair of scissors (Plasminogen activator) unable to cut a microclot due to its amyloid nature. Middle section, Ischaemia and Micro-capillary Blockage, shows microclots obstructing a narrow vessel, reducing oxygen transfer. Bottom section lists associated diseases: Long COVID / ME/CF S, Neurodegenerative (Alzheimer’s and Parkinson’s), Cardiovascular (Ischaemic stroke), and Type 2 Diabetes or Sepsis. The final section, Diagnostic Detection Methods, shows a microscope setup using Thioflavin T and Amytracker dyes.
Although the broader disease-spanning framework has been developed largely through our own work, recent reports from independent groups in sepsis and Long COVID indicate that the phenomenon is reproducible beyond a single laboratory context. At the same time, the field would benefit greatly from further methodological standardisation, head-to-head comparison of assays, and additional external replication across disease settings.
We note that treatments, such as nattokinase and lumbricase, that serve to remove microclots can be efficacious (Eckey et al., Reference Eckey, Li, Morrison, Bergquist, Davis and Xiao2025). Consequently, our next strategy is to develop methods that are not simply anticoagulating (though such can be efficacious (Wright et al., Reference Wright, Kell, Pretorius and Putrino2025)), but that can inhibit the transition of fibrin(ogen) to the amyloid form. Success here would add considerably to the existing evidence (such as that relating amyloidogenicity to virulence (Grobbelaar et al., Reference Grobbelaar, Venter, Vlok, Ngoepe, Laubscher, Lourens, Steenkamp, Kell and Pretorius2021, Reference Grobbelaar, Kruger, Venter, Burger, Laubscher, Maponga, Kotze, Kwaan, Miller, Fulkerson, Huff, Chang, Wiarda, Bunch, Walsh, Raza, Zamlut, Moore, Moore, Neal, Kell and Pretorius2022) that the microclots are not only present but on the disease pathway.
Methods
To create and analyse fibrinaloid microclots with Congo Red in vitro , 30 ng/mL of bacterial LPS were added to purified FBG at 2.6 mg/mL. To this, Congo Red was added at 0.3 mM, followed by 7 U of Thrombin. All concentrations stated are final. Images were taken on an Axio Observer.Z1 (Zeiss, Jena, Germany) microscope using a halogen lamp (HAL100) and a polariser filter with a GXCAM-3 (GT Vision, Wickhambrook, UK). Images were acquired with the software GXCam version 7.3. All images were taken with a Plan-APOCHROMAT FLUAR 20 × 0.75 DIC and saved in .tif format. The methods and data for Figure 1 were obtained using imaging flow cytometry, the image being taken from a CC-BY 4.0 publication (Turner et al., Reference Turner, Laubscher, Khan, Kell and Pretorius2023b).
Conclusion
FMCs have now been reported across a widening range of inflammatory and thrombo-inflammatory conditions (Kell and Pretorius, Reference Kell and Pretorius2018a) (Table 1), including acute COVID-19, Long COVID, sepsis, type 2 diabetes, Parkinson’s disease, rheumatoid arthritis, and Alzheimer-related syndromes, with support coming both from our own studies and from independent groups. However, while the presence of fibrinaloid microclot complexes has been observed across these diverse conditions, detailed mechanistic characterization of their phenotypes and their origins from specific prothrombotic seeding areas has not been uniformly established, although our group has identified the need for better phenotyping (Nunes et al., Reference Nunes, Kell, Slaghekke, Wust, Fielding, Kell and Pretorius2026). To date, such phenotypic resolution, including the identification of distinct seeding substrates such as cellular debris, microparticles, and nucleoprotein complexes, has been most clearly demonstrated in COVID-19, Long COVID, and type 2 diabetes. In contrast, in other disease settings, fibrinaloid microclots have largely been described at the level of presence, morphology, or proteomic enrichment, without explicit discrimination of their underlying phenotypic diversity or seeding mechanisms.
This distinction is critical, as it indicates that FMCs are not a single pathological entity but a spectrum of mechanistically distinct, surface-seeded assemblies, and that resolving their phenotypic diversity and seeding origins is essential for understanding their role in disease pathogenesis, as well as for developing targeted diagnostic and therapeutic strategies.
Open peer review
To view the open peer review materials for this article, please visit http://doi.org/10.1017/qrd.2026.10022.
Acknowledgements
The authors gratefully acknowledge Marco Marcello of the LIV-SRF Centre for Cell Imaging https://www.liverpool.ac.uk/research/facilities/shared-research-facilities/centre-for-cell-imaging/ for assistance with the polarised light microscopy.
Author contribution
Conceptualization: DBK and EP. Resources: DBK and EP. Data generation for Figure 2 JMG. Writing – original draft preparation: DBK. Writing – review and editing: all authors. Visualization: EP. Funding acquisition: DBK and EP.
Financial support
The authors would like to thank the Balvi Foundation for financial support. The content and findings reported and illustrated are the sole deduction, view, and responsibility of the researchers, and do not reflect the official position and sentiments of the funders. The funders had no role in study design, data collection and analysis, decision to publish, or preparation of the manuscript.
Competing interests
EP holds a patent application for the use of fluorescence microscopy in microclot imaging and is a Founding Director of Biocode Technologies.

 Open access


Comments
Nothing to add. This is for the ‘Uncovering Hidden Biology’ meeting