Introduction
Awareness about the food and environmental quality of organic production is increasing at society level and people are becoming more concerned about sustainability, environmental impacts, and health effects of intensive farming (Randall & James, Reference Randall and James2012). On the other side, according to some authors, organic farming is becoming a slightly modified version of conventional agriculture, substituting the inputs to fit with regulation and not considering abovementioned concerns (Hall & Mogyorody, Reference Hall and Mogyorody2001; Goldberger, Reference Goldberger2011).
When demonstrating the benefits of organic farming on beneficial fauna including soil arthropods, most of the studies has to start with the two well-known meta-analyses of Hole et al. (Reference Hole, Perkins, Wilson, Alexander, Grice and Evans2005) and Bengtsson et al. (Reference Bengtsson, Ahnström, Weibull and Weibull2005). Organic farming in protected systems of cultivation (i.e. greenhouse production) is characterized by diverse structures and conditions (depending on the zone, region, country, etc.) and displays fewer examples of specific studies compared with the open field. The food-web structures, including soil interactions, also have been less studied in organic greenhouse (OGH) production (Smeding & de Snoo, Reference Smeding and de Snoo2003), having a lack of studies concerning soil arthropods.
The importance of soil arthropods in soil and agroecosystem processes has been well recognized, due to their high biodiversity, abundance, and their important role as predators of pests and soil organic matter decomposers (Van Straalen, Reference Van Straalen1998; Bohac, Reference Bohac1999; Kromp, Reference Kromp1999; Andre et al., Reference Andre, Duarme and Lebrum2002). Beside their roles in ecosystem functioning, they respond to a variety of environmental and ecological factors (changes in soil chemistry, microhabitat configuration), anthropogenic changes, habitat disturbance, pollution, which led to their recognition and use as bioindicators in agroecosystems assessment (Razo-González et al., Reference Razo-González, Castaño-Meneses, Callejas-Chavero, Pérez-Velázquez and Palacios-Vargasa2014).
Environmental impact and sustainability of a given unit (farm, greenhouse, landscape, etc.) can be assessed only by comparison with similar units that are under different management or that use different practices. Although it is difficult to assign absolute values of sustainability to a given unit, comparisons with other units can indicate promising, compatible tools (Paoletti & Bressan, Reference Paoletti and Bressan1996). Thus, comparing different farming techniques is essential to evaluate OGH environmental sustainability within organic systems of production. Systems approach in experimental work is considered as powerful tool to study agroecosystems and inter-relationships among environmental conditions, management, biological processes – with common reflection on chosen outcomes – indicators (Drinkwater, Reference Drinkwater2002), leading the opportunity to test broad and integrated hypotheses. Any agricultural practice, as part of the management system, can have immediate and legacy effect on soil arthropod community (Jabbour et al., Reference Jabbour, Pisani-Gareau, Smith, Mullen and Barbercheck2016), that is why it is important to study their activity density (AD) and community structure over longer time span, within crop rotation.
Farming system determines plant communities (cash crop and often depending from the practices associated with weed flora), while arthropod communities are influenced by plants (Caballero-López et al., Reference Caballero-López, Blanco-Moreno, Pérez, Pujade-Villar, Ventura, Oliva and Sans2010) and it can be hypothesized that crop rotation is one of the decisive factors when assessing the effect of different management practices on soil arthropods. For example, decomposition occurs more rapidly when litter is placed beneath the plant species from which it had been derived than beneath different plant species, as confirmed by a study of Ayres et al. (Reference Ayres, Steltzer, Simmons, Simpson, Steinweg, Wallenstein, Mellor, Parton, Moore and Wall2009) in a forest environment. This phenomenon is known as ‘home field advantage’. Beside inputs, other management aspects, such as groundcover management, species cultivated, crop rotation, and irrigation system, also have an impact on soil arthropod population dynamics (Lindberg et al., Reference Lindberg, Engtsson and Persson2002; Mathews et al., Reference Mathews, Bottrell and Brown2004; Diekötter et al., Reference Diekötter, Wamser, Wolters and Birkhofer2010; Ebeling et al., Reference Ebeling, Pompe, Baade, Eisenhauer, Hillebrand, Proulx, Roscher, Schmid, Wirth and Weisser2014).
In warm climates, including Mediterranean regions, where humidity and temperature control in protected conditions are mostly limited to opening and closing the greenhouses, a continuous migration of organisms in and out of the greenhouse is expected (Van Lenteren, Reference Van Lenteren2000). For this reason, it is crucial to study the spatio-temporal dynamics of their communities in order to assess the resilience of a given system and indication power of selected bioindicators (Kampichler & Geissen, Reference Kampichler and Geissen2005).
The present paper is, to our knowledge, the first attempt to use soil arthropods as bioindicators of ecological sustainability in OGH production. Three systems were investigated in a two-year rotation which included four cash crop species. In two systems, agroecological service crops – ASC [tailored use of cover crop species (Canali et al., Reference Canali, Diacono, Campanelli and Montemurro2015)] were cultivated during the summer, while in the third, soil was left bare. It was hypothesized that different systems of organic farming in the Mediterranean greenhouse production can have a significant effect on soil arthropod community characteristics and that, in turn, it is possible to detect individual patterns of abundance and richness of the different soil arthropod macrogroups.
Materials and methods
Site description and experimental design
The present study was carried out at the experimental farm of the Mediterranean Agronomic Institute in Bari – MAIB (Apulia region, Italy, 41°.0536 N; 16°.8766 E) under an unheated plastic tunnel. The experimental tunnel was established in 2012 and was split into two fields; the experimental layout was a completely randomized block design with three blocks per field. Three organic farming systems (OFS) were randomly assigned to the three blocks of each field for a total of 18 plots (4.0 × 3.0 m). The presented results refer to field I (including three replicates per system, with a total of nine plots), covering the period of a 2-year crop rotation (2014–2016), including four crop species (kohlrabi, lettuce, zucchini, and lamb's lettuce) and cultivation of ASC crops during summer period (fig. 1). Experimental OGH was a typical plastic tunnel for the Mediterranean region, with manual opening for humidity and temperature regulation. Tunnel was surrounded by ecological infrastructures (flowering strips), composed of different plant species, to increase biodiversity and ensure a richer pool for individuals exchange with cultivated plants inside the tunnel. A more detailed description of experimental design can be found in Tittarelli et al. (Reference Tittarelli, Ceglie, Ciaccia, Mimiola, Amodio and Colelli2016).
Crop rotation, with planting details and duration of soil arthropod monitoring.

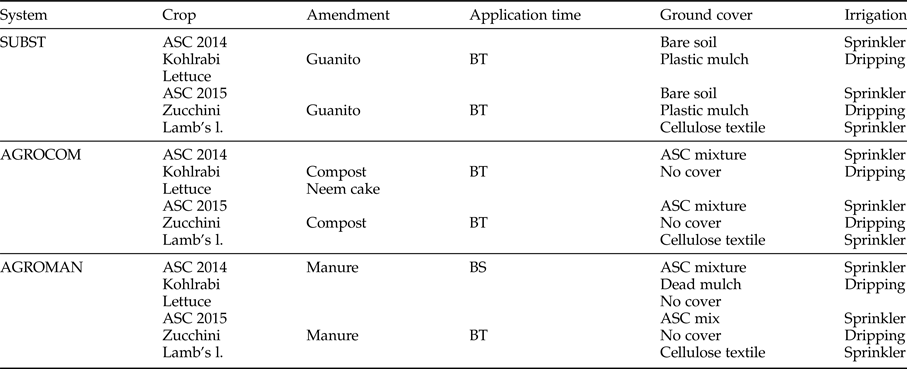
Three types of OFS were under comparison: (i) SUBST – bare soil in the summer period (before cash crop cultivation) + organic commercial fertilizer (input substitution system); (ii) AGROMAN – ASC cultivation during summer (used as dead mulch or green manure before cultivation of autumn cash crop) + animal manure (from organic husbandry); and (iii) AGROCOM – ASC cultivation during summer (used as green manure before autumn cash crop) + compost produced on-farm. More details on systems and rotation are presented in table 1.
System description: crop rotation, ground cover, and soil fertility management.
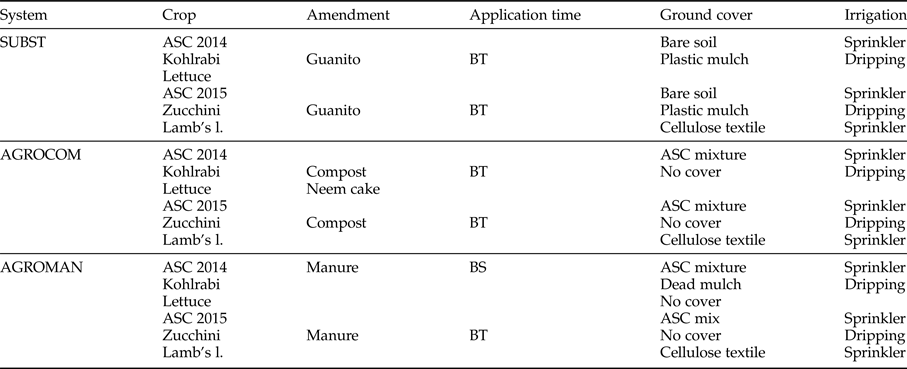
BT, before transplanting; BS, before sowing.
Experimental design implemented in our study was based on system approach, without having fixed experimental factors. Each system was characterized by system-dependent agricultural practices (e.g. soil fertility management), while some of them were crop-dependent (as, e.g. ground cover management, ASC mixture composition). Soil amendment application rates were based on nitrogen (N) supply and the need of increasing soil organic matter content. Two hundred kilograms of N/ha was provided to AGROMAN and AGROCOM with soil organic amendments (animal manure and compost, respectively), while 100 kg of N/ha, as organic fertilizer (guanito), was applied in SUBST plots. The remaining part of nutrients (to satisfy crop needs) was provided in all systems with commercial, a liquid fertilizer Kappabios (SERBIOS srl – Italy), with the following nutrient composition: total organic carbon (C) 150.0 g kg−1, total N 30.0 g kg−1, K2O 60 g kg−1.
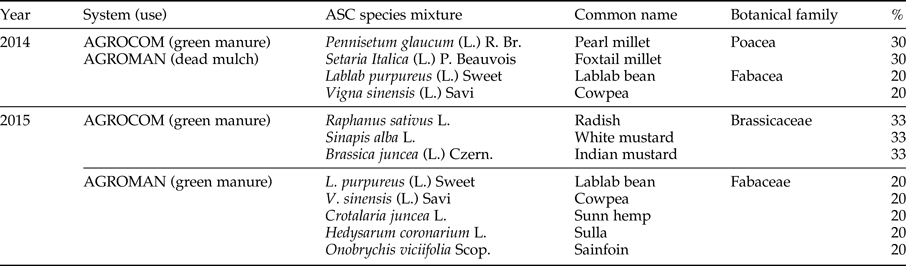
ASC cultivation was carried out in the summer period of 2014 and 2015 seasons, with the aim to provide different ecological services in AGROCOM and AGROMAN systems, i.e. soil organic matter increase, biofumigation, and dead mulch formation (Scholberg et al., Reference Scholberg, Dogliott, Zotarelli, Cherr, Leoni, Rossing and Lichtfouse2010; Ciaccia et al., Reference Ciaccia, Testani, Campanelli, Sestili, Leteo, Tittarelli, Riva, Canali and Trinchera2015). Same ASC mixture was applied in both systems in 2014, while in 2015 mixtures were different (table 2).
ASC mixtures cultivated in summer period 2014 and 2015 in AGROCOM and AGROMAN.
The plant protection program (products and application rate) was the same for all systems under assessment. It was based on the products allowed to use in organic agriculture by the European Union (EU) regulation – EC Reg. No. 834/2007 (EC, 2007) – copper and sulfur as active substances in case of fungal infection and pyrethrin for aphid control (in case of kohlrabi, lettuce, and zucchini).
Soil arthropod monitoring
Monitoring of soil fauna started on July 2014, following a rotation plan, until May 2016. It lasted overall for 345 days in each OGH system, depending on the crop cycle, as follows: ASC 2014 – 49 days, kohlrabi – 56 days, lettuce – 43 days, ASC 2015 – 46 days, zucchini – 93 days, and lamb's lettuce – 58 days. Pitfall traps were used (one per plot – with three replicates per system) to collect arthropods. Traps position was assigned randomly, avoiding space near to plot borders. Each trap consisted of a plastic cup (13 cm × 10 cm, 500 ml) half filled with 50% propylene glycol water solution. The cups were dug into the soil and the rim was leveled with the soil surface. A 15 cm diameter plastic roof was placed 4 cm above the cup to prevent the overflow due to the irrigation water. The traps were replaced every 15–25 days during the monitoring period (depending on the capture rate). The content of each cup was collected in the field into a plastic container and stored in the fridge until counting in the laboratory. Arthropods captured were separated in seven macrogroups (Carabidae, Staphylinidae, Collembola, Araneae, Myriapoda, Isopoda, and Opiliones). Capture rates from pitfall traps integrate arthropod density and activity levels, providing a proxy for the magnitude of the ecological processes in which the organisms are involved (Southwood & Henderson, Reference Southwood and Henderson2000; Høye & Forchhammer, Reference Høye and Forchhammer2008). Numbers trapped depend not only on the population density of a species but also on its locomotory activity, as well as on habitat characteristics. Therefore, numbers caught do not allow direct estimation of population density but only of activity density (Thiele, Reference Thiele1977). The use of a higher taxonomic level (e.g. richness of indicator groups) in studies of soil arthropod dynamics proved to be suitable for bioindication and to reduce costs when exploring biodiversity, assessing the anthropogenic impact and guiding management decisions (Biaggini et al., Reference Biaggini, Consorti, Dapporto, Dellacasa, Paggetti and Corti2007; Burgio et al., Reference Burgio, Campanelli, Leteo, Ramilli, Depalo, Fabbri and Sgolastra2015; Gkisakis et al., Reference Gkisakis, Volakakis, Kollaros, Barberi and Kabourakis2016).
Data analysis
Total abundance of arthropods was considered as the total number of individuals captured in each management type, with the exclusion of Collembola, which are presented separately, due to their high abundance compared with others. Relative abundance of the taxa was calculated as the proportion of individuals of each group with respect to the total – pooled number of individuals (including Collembola). AD was calculated by dividing the pooled number of individuals captured by the number of days of trap activity.
Soil arthropods collected were divided in two subgroups according to the functions provided by the majority of their species, as follows: (i) biological pest control (BPC) group and (ii) nutrient cycling (NC) group (Gkisakis et al., Reference Gkisakis, Volakakis, Kollaros, Barberi and Kabourakis2016). BPC subgroup included potential predators as Araneae, Carabidae, Staphylinidae, and Opiliones (Pinto da Rocha et al., Reference Pinto da Rocha, Machado and Giribet2007; Clough et al., Reference Clough, Holzschuh, Gabriel, Purtauf, Kleijn, Kruess, Steffan-Dewenter and Tscharntke2007a; Woodcock et al., Reference Woodcock, Redheada, Vanbergenb, Hulmesa, Hulmesa, Peytona, Nowakowskic, Pywella and Hearda2010), while NC group included decomposers and detritivores – Isopoda, Myriapoda, and Collembola (Paoletti & Hassall, Reference Paoletti and Hassall1999; Lensing et al., Reference Lensing, Todd and Wise2005; Snyder & Hendrix, Reference Snyder and Hendrix2008).
Analysis of variance (ANOVA) was performed using CoStat software (Version 6400, CoHort Software, Monterey, CA, USA). Data were square root transformed, if necessary, prior to ANOVA to satisfy assumptions of normality and homogeneity of variances. Mean separations were performed using the HSD Tukey's test (P < 0.05). Principal components analysis (PCA) was performed on the data for mean total abundance of soil arthropod macrogroups in the cumulative monitoring period (including all crops, for overall 345 days), using XLSTAT software (XLstat 2016; Addinsoft, New York, NY, USA).
Results
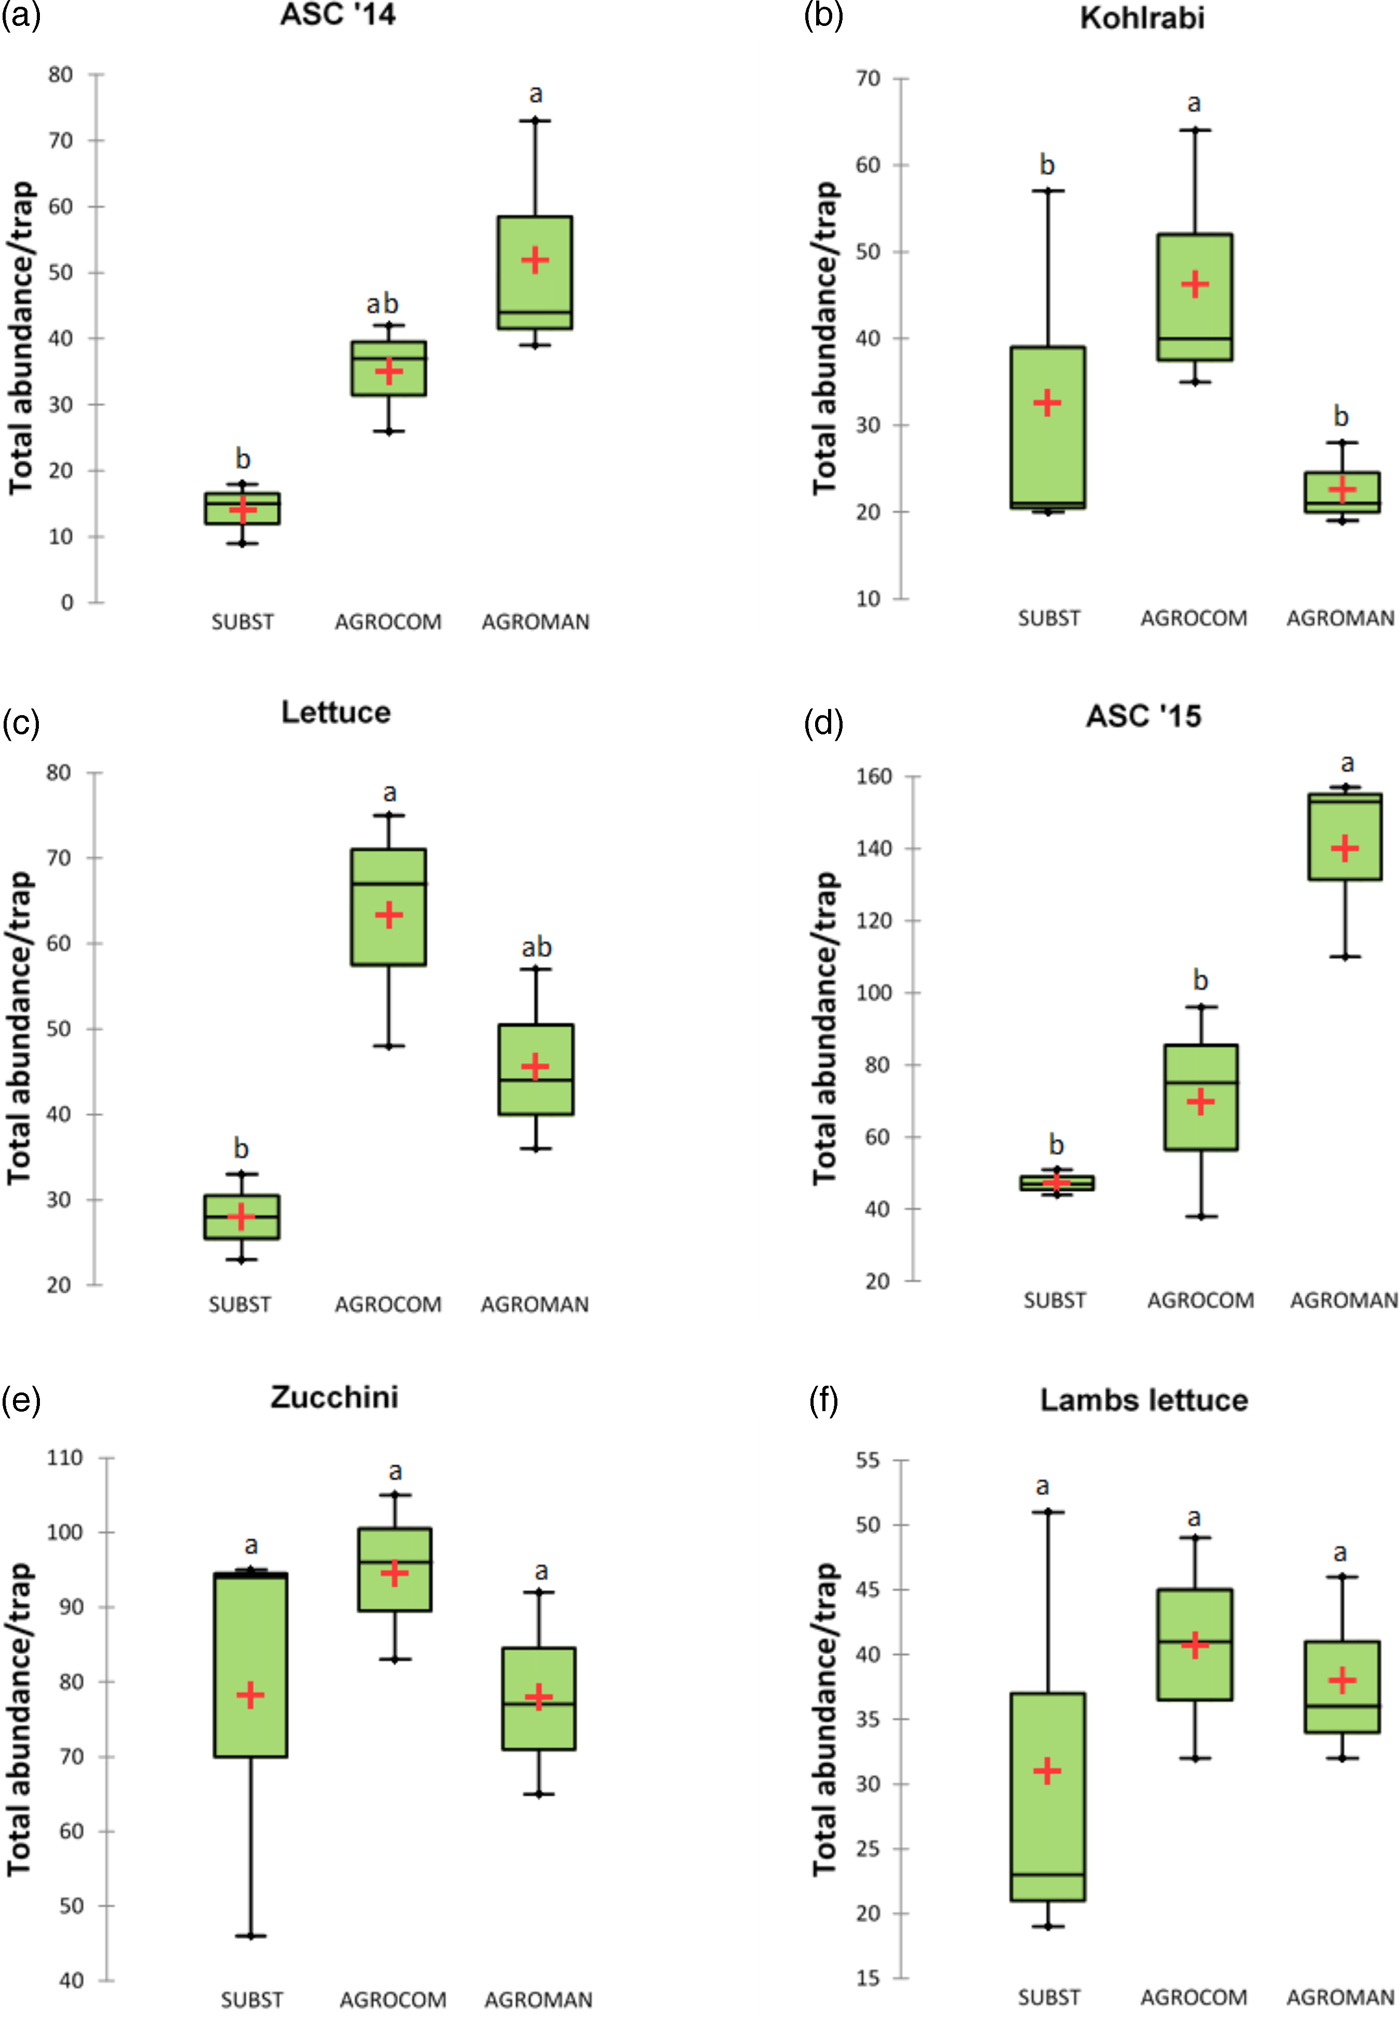
A total of 14 448 arthropod individuals were collected, including 1785 for ASC 2014, 1005 for kohlrabi, 2179 for lettuce, 1514 for ASC 2015, 6466 for zucchini, and 1499 for lamb's lettuce. Mean total abundance per system, without Collembola, is presented in fig. 2. In the first year of OGH crop rotation, during ASC cultivation, the greatest abundance was recorded in AGROMAN system (52.0 ± 18.4), which showed higher values than SUBST (14.0 ± 4.6) and AGROCOM (35.0 ± 8.2). Succeeding cash crop – kohlrabi, demonstrated a different pattern, with the highest mean value recorded in AGROCOM (46.3 ± 15.5), followed by SUBST and AGROMAN with means of 32.7 (±21.1) and 22.7 (±4.7), respectively. Lettuce, the second crop in the first year of rotation, showed significantly higher values of total abundance of soil taxa in AGROCOM, with a mean of 63.3 (±13.9).
Soil arthropods mean total abundance (without Collembola) per system in each crop, during a 2-year crop rotation. The thick line marks the median and cross mean of the distribution. ANOVA followed by Tukey's test (P < 0.05); different letters indicate significant differences.
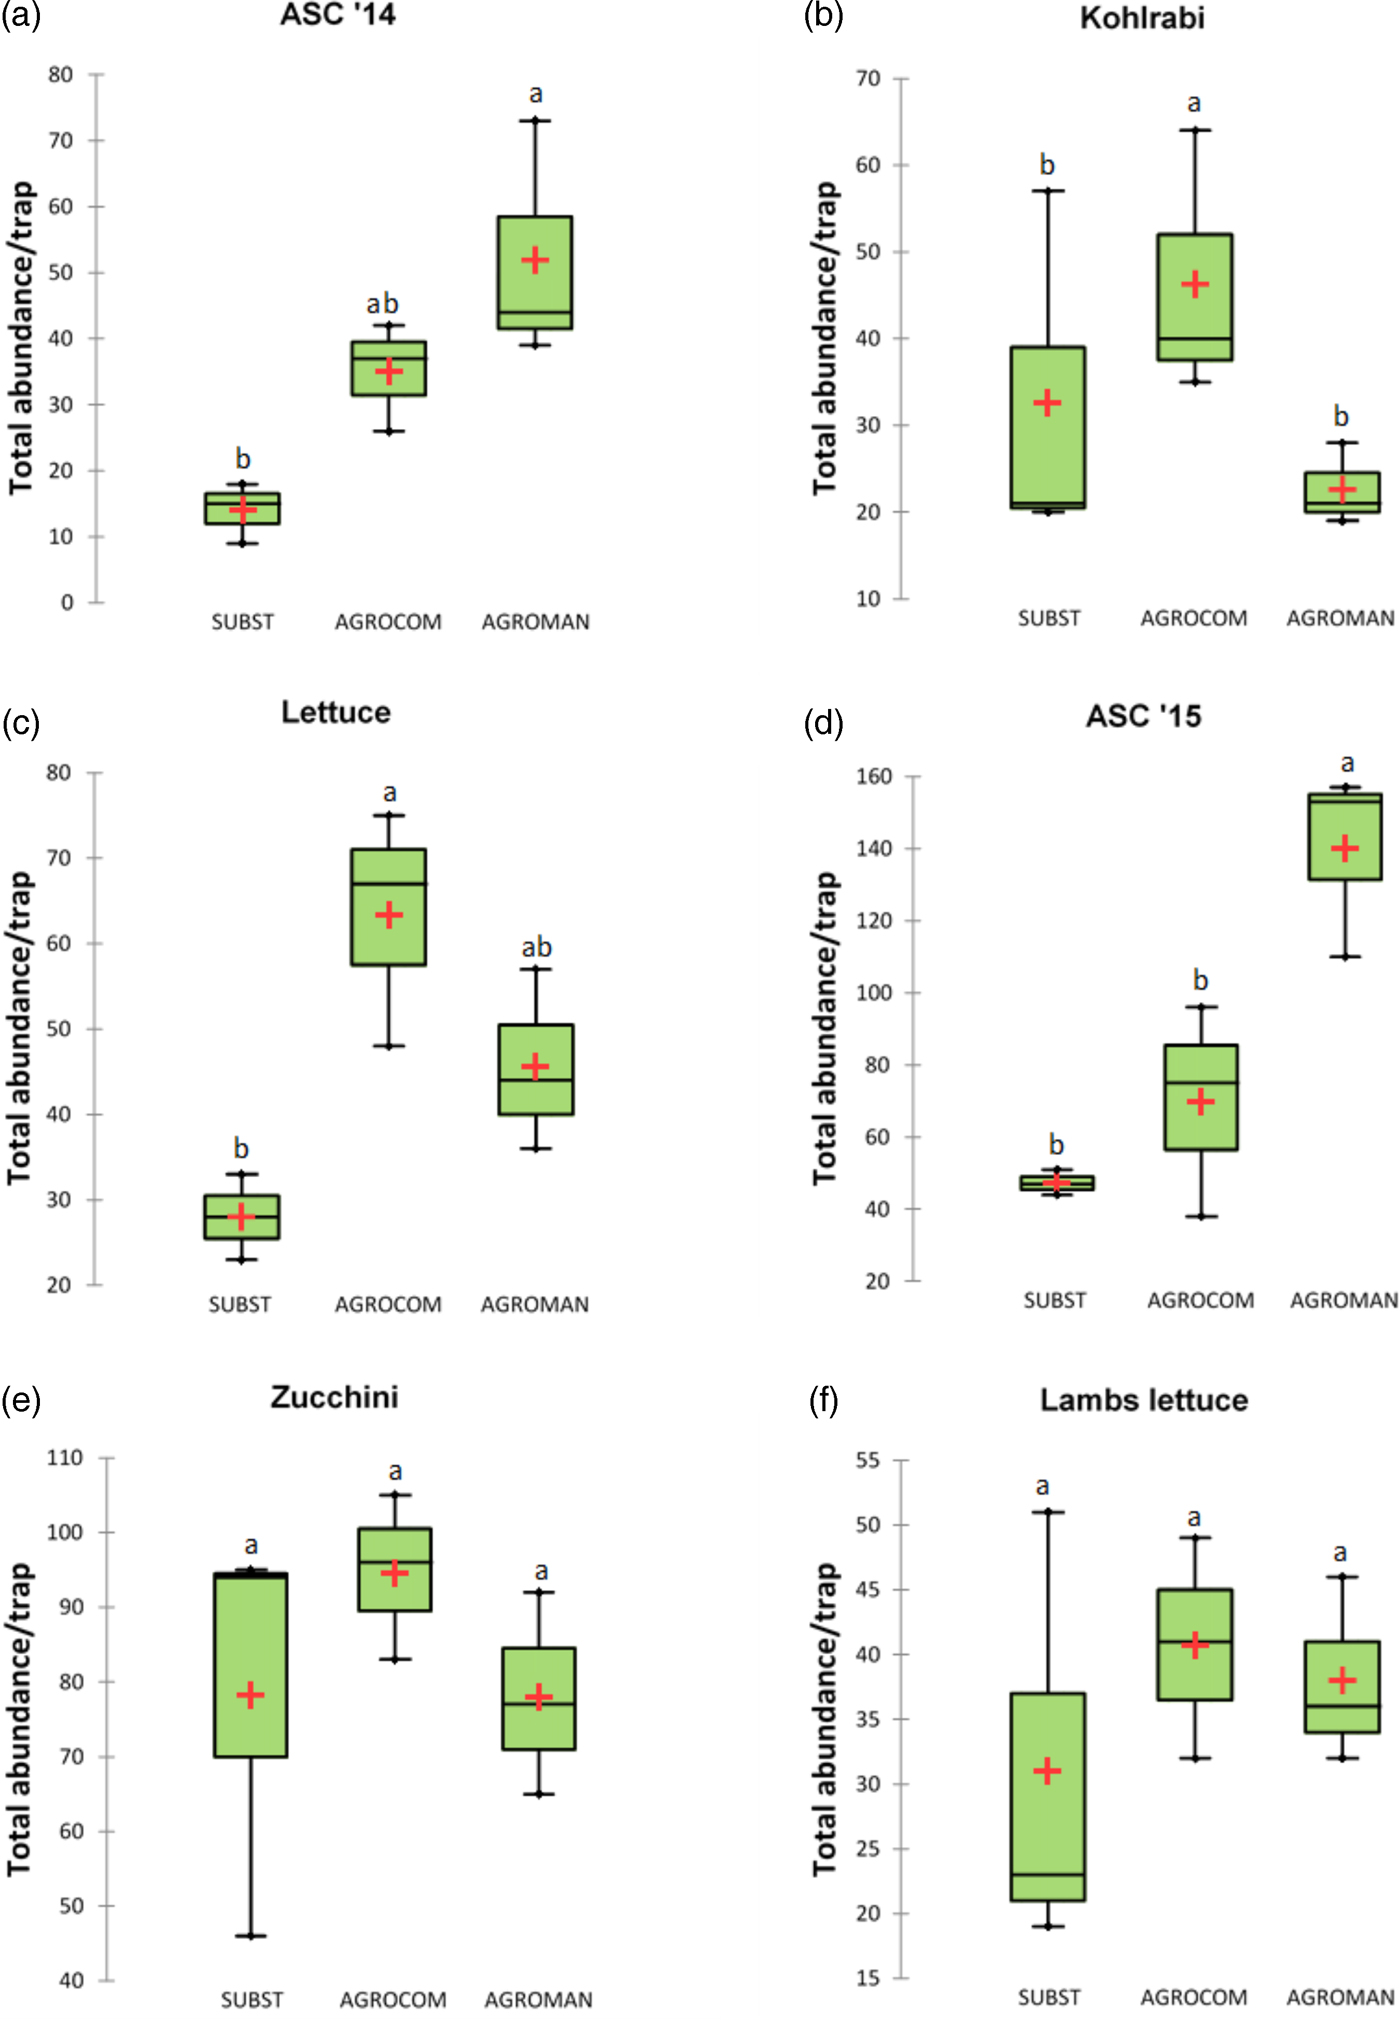
In the second year of crop rotation, AGROMAN confirmed significantly higher total abundance (140 ± 26.1) in ASC cultivation, in comparison with SUBST (47.3 ± 3.5), while AGROCOM showed an intermediate position respect to other systems, and it was characterized by high variability (69.7 ± 29.3). Total abundance of soil arthropods did not differ among systems in the period of zucchini and lamb's lettuce. Arthropod monitoring of these two crops revealed high variability for SUBST system and the highest values in AGROCOM, with a mean of 94.6 (±11.1) for zucchini and 40.7 (±8.5) in case of lamb's lettuce.
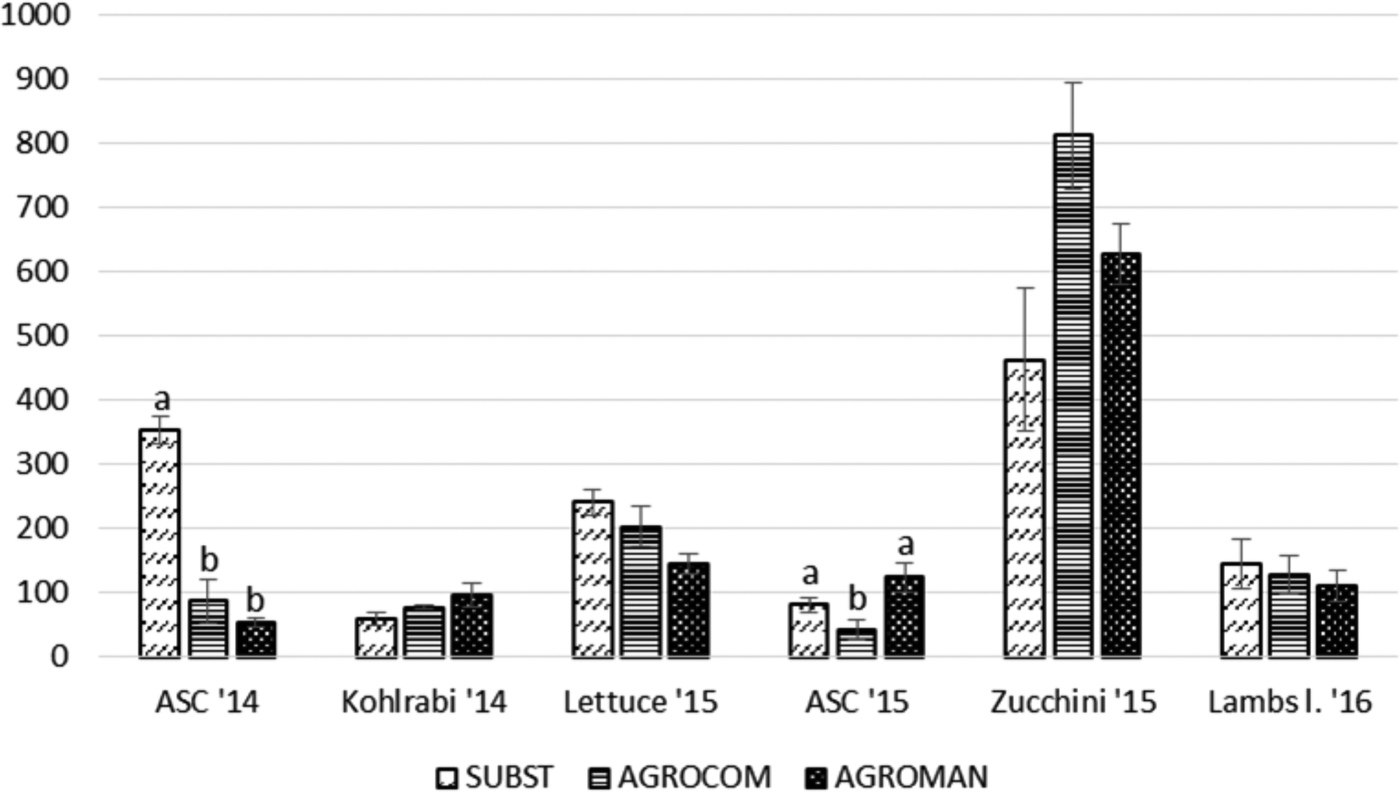
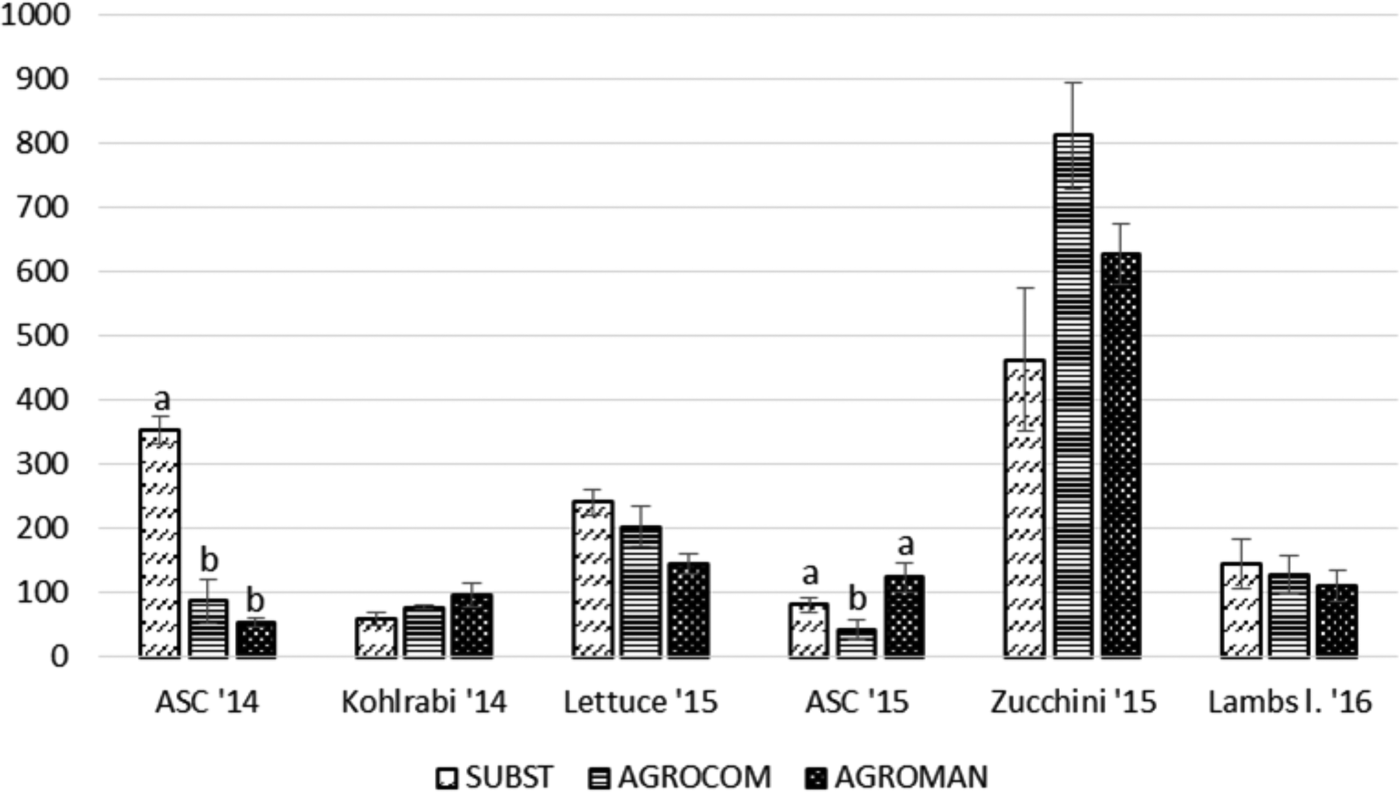
Collembola population trends are shown in fig. 3. This taxon showed significant differences among systems for ASC cultivation in both years. In 2014, SUBST system displayed the highest abundance of Collembola (353.76±21.49), whereas in 2015, AGROMAN system was the most abundant (124.67 ± 22.82). For other crops, in 2-year period, significant differences for Collembola abundance were not present.
Total abundance of Collembola (mean ± standard error) per system in each crop, during a 2-year crop rotation. ANOVA followed by Tukey's test (P < 0.05); different letters within one crop indicate significant differences.
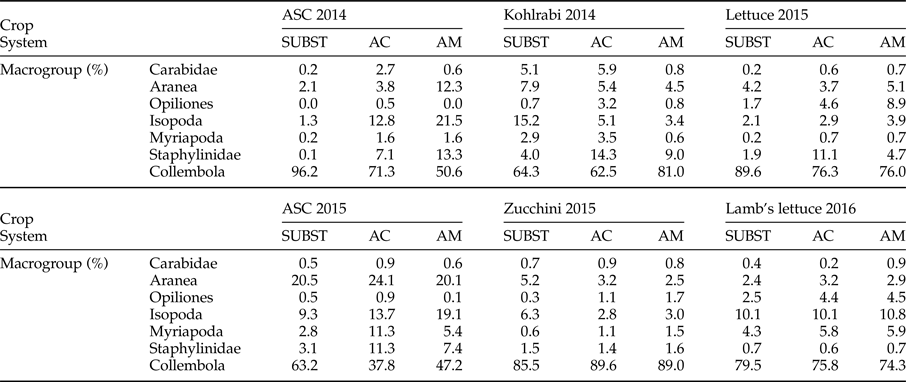
Collembola was the most represented group during whole monitoring period. This was particularly pronounced for ASC 2014 in SUBST system and during zucchini cultivation (table 3). The second abundant group for ASC 2014 in AGROCOM and AGROMAN were Isopoda, accounting for 12.8 and 21.5% of the trap catches, respectively. In AGROMAN system also, Aranea and Staphylinidae accounted for more than 10% of the total. For the period of kohlrabi and lettuce, besides Collembola, the taxon with relative abundance of more than 10% was represented by Staphylinidae (in AGROCOM). Opiliones reached 8.9% of relative abundance in lettuce for AGROMAN system, representing the highest value for this macrogroup, in the whole experiment.
Relative abundance (%) of soil arthropods in experimental OGH systems during a 2-year crop rotation.
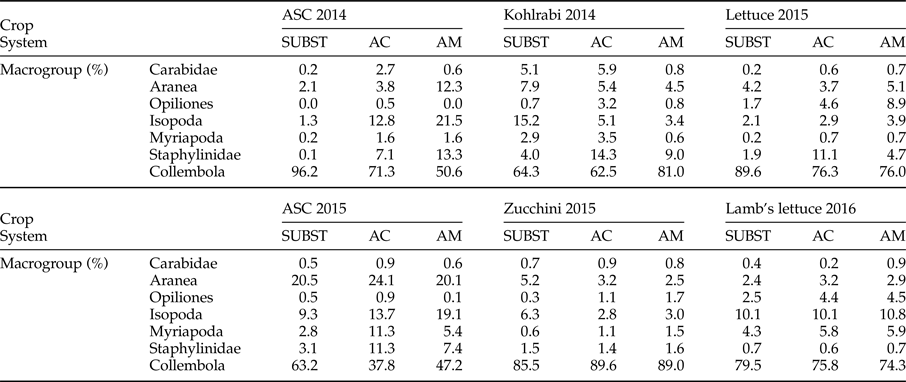
Cultivation of ASC 2015 showed a different trend compared to previous year, displaying a strong decrease in Collembola, especially for AGROCOM, while Aranea, Isopoda, Myriapoda, and Staphylinidae accounted for 24.1, 13.7, 11.3, and 11.3% from the total number of individuals, respectively. In SUBST, only Aranea (20.5%), besides Collembola, showed a high relative abundance, while in AGROMAN, Aranea (20.1%) and Isopoda (19.1%) were the more represented taxa. Collembola dominated during zucchini and lamb's lettuce cultivation.
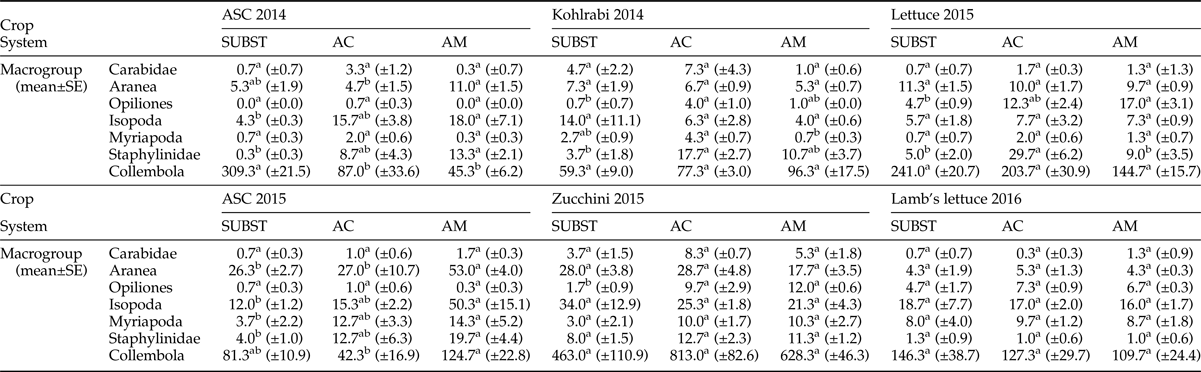
Table 4 presents the mean number of individuals per system and crop during the 2 years of monitoring. Data analysis for ASC 2014 cultivation showed significant differences among the systems for Aranea, Isopoda, and Staphylinidae. For these taxa, AGROMAN system displayed the highest abundance. On the contrary, Collembola was the most prevalent group in SUBST. Opiliones, Myriapoda, and Carabidae were poorly represented in all systems. Results for kohlrabi demonstrated significantly higher number of Opiliones and Staphylinidae in AGROCOM system in comparison to SUBST; also Myriapoda were higher in AGROCOM in comparison to AGROMAN. Opiliones, as previously shown, displayed the lowest number of individuals in all systems. In the following crop (lettuce), which was cultivated during spring period, Opiliones increased their number in all systems and were significantly more abundant in AGROMAN in comparison with SUBST, while Staphylinidae were more abundant in AGROCOM, against the other systems. Carabidae and Myriapoda were poorly represented in all systems.
Number of individuals per system/crop (mean ± standard error) in experimental OGH systems during a 2-year crop rotation; analysis of variance followed by Tukey's test (P < 0.05)*.

* Different letters in apex within row – for one crop, indicate statistically significant differences.
In ASC 2015 cultivation, Isopoda, Myriapoda, and Staphylinidae showed a higher population in AGROMAN in comparison with SUBST. Similarly, Aranea and Collembola showed highest presence in AGROMAN, being significantly higher than in other two systems. In this case, Carabidae and Opiliones were represented by a very low number of individuals. In zucchini cultivation only Opiliones displayed significant differences among systems; this taxon was significantly more abundant in AGROMAN (12.0 ± 0.6) and AGROCOM (9.7 ± 2.9), in comparison to SUBST (1.7 ± 0.9). No significant differences of soil taxa were detected among the systems, during lamb's lettuce cultivation.
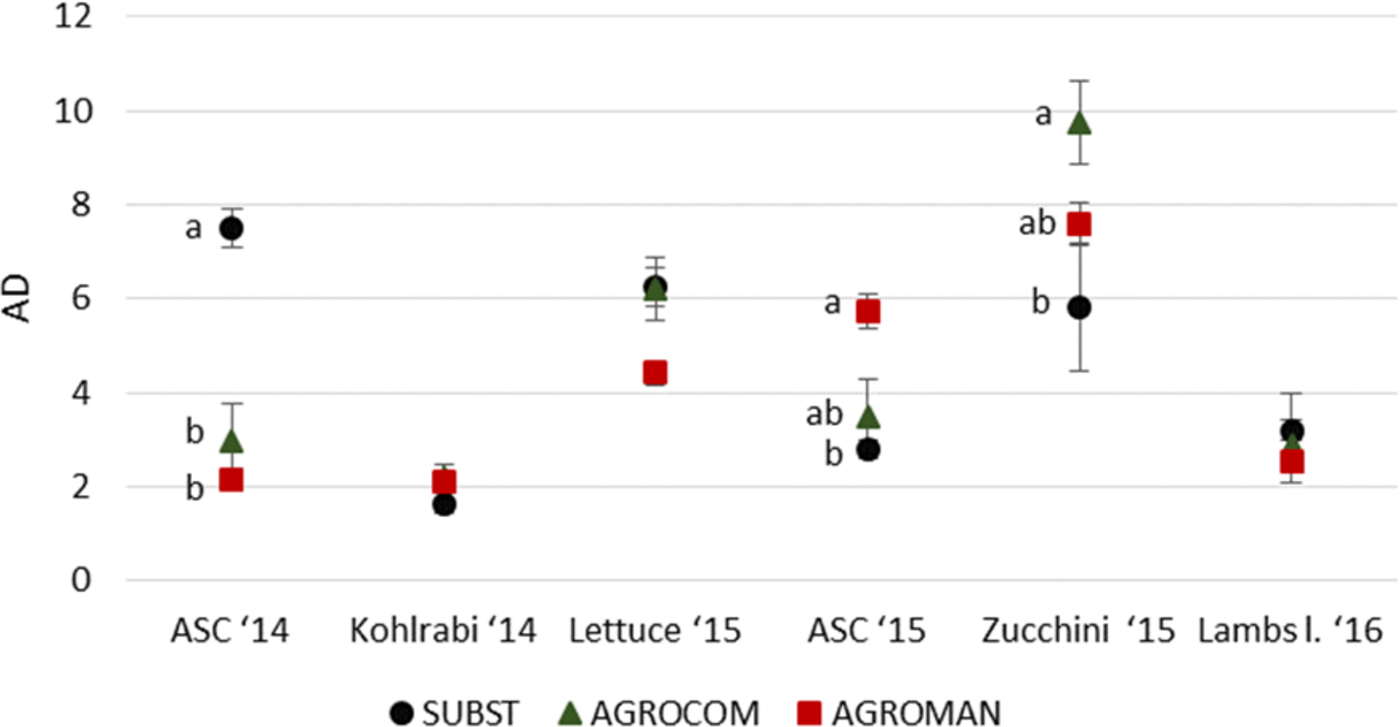
Soil arthropod's AD did not show a constant pattern among systems over the 2 years (fig. 4). SUBST with AD value of 7.5 (±0.4) for ASC 2014 significantly differed from AGROCOM (2.9 ± 0.8) and AGROMAN (2.1 ± 0.2). There were no statistically significant differences among systems for kohlrabi crop. In all systems, AD increased during lettuce cultivation, being 6.3 (±0.4) in SUBST, 6.2 (±0.7) in AGROCOM, and 4.4 (±0.3) in AGROMAN, without being significantly different.
Activity density (AD) of the total number of soil arthropods (pooled number of individuals in system/number of pitfall trap active days) in experimental systems during a 2-year crop rotation (mean ± standard error). ANOVA followed by Tukey's test (P < 0.05); different letters within one crop indicate significant differences.
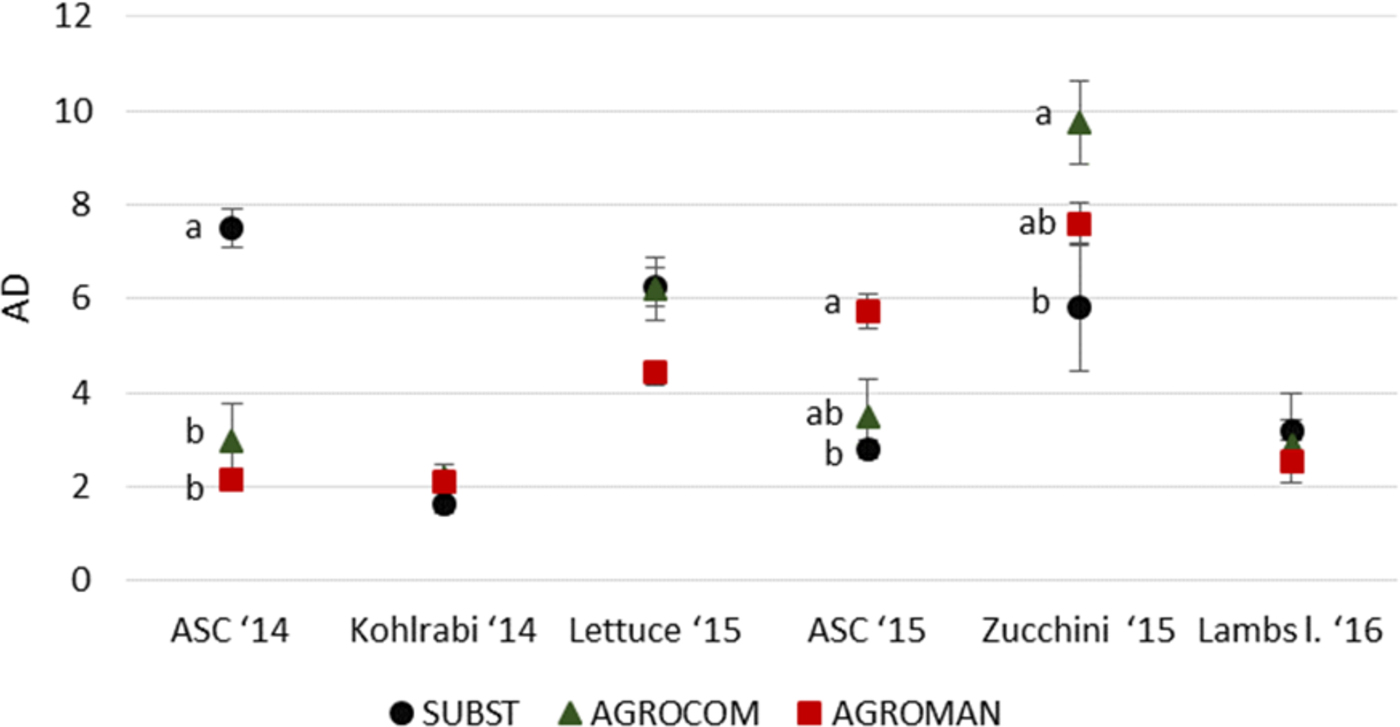
ASC 2015 cultivation, as in 2014, revealed statistically significant differences of AD among systems. AGROMAN (5.7 ± 0.4) had significantly higher value compared with SUBST (2.8 ± 0.2), with intermediate AGROCOM (3.5 ± 0.8).
During zucchini cultivation, soil arthropod's AD retained significant differences among systems. AGROCOM had the highest value (9.6 ± 0.9), significantly differing from SUBST (5.8 ± 1.4) while an intermediate value for AGROMAN (7.5 ± 0.4) was observed. During lamb lettuce cultivation, AD did not differ among systems.
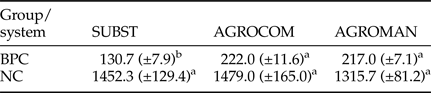
Considering the functional criterion for soil fauna (table 5), AGROCOM and AGROMAN showed significantly higher values for BPC subgroup, while number of individuals for NC subgroup was similar in the three systems.
Total abundance of functional subgroups per system (mean±standard error).
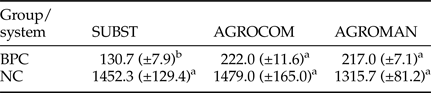
ANOVA followed by Tukey's test (P < 0.05); different letters within the row indicate significant differences.
BPC, biological pest control; NC, nutrient cycling.
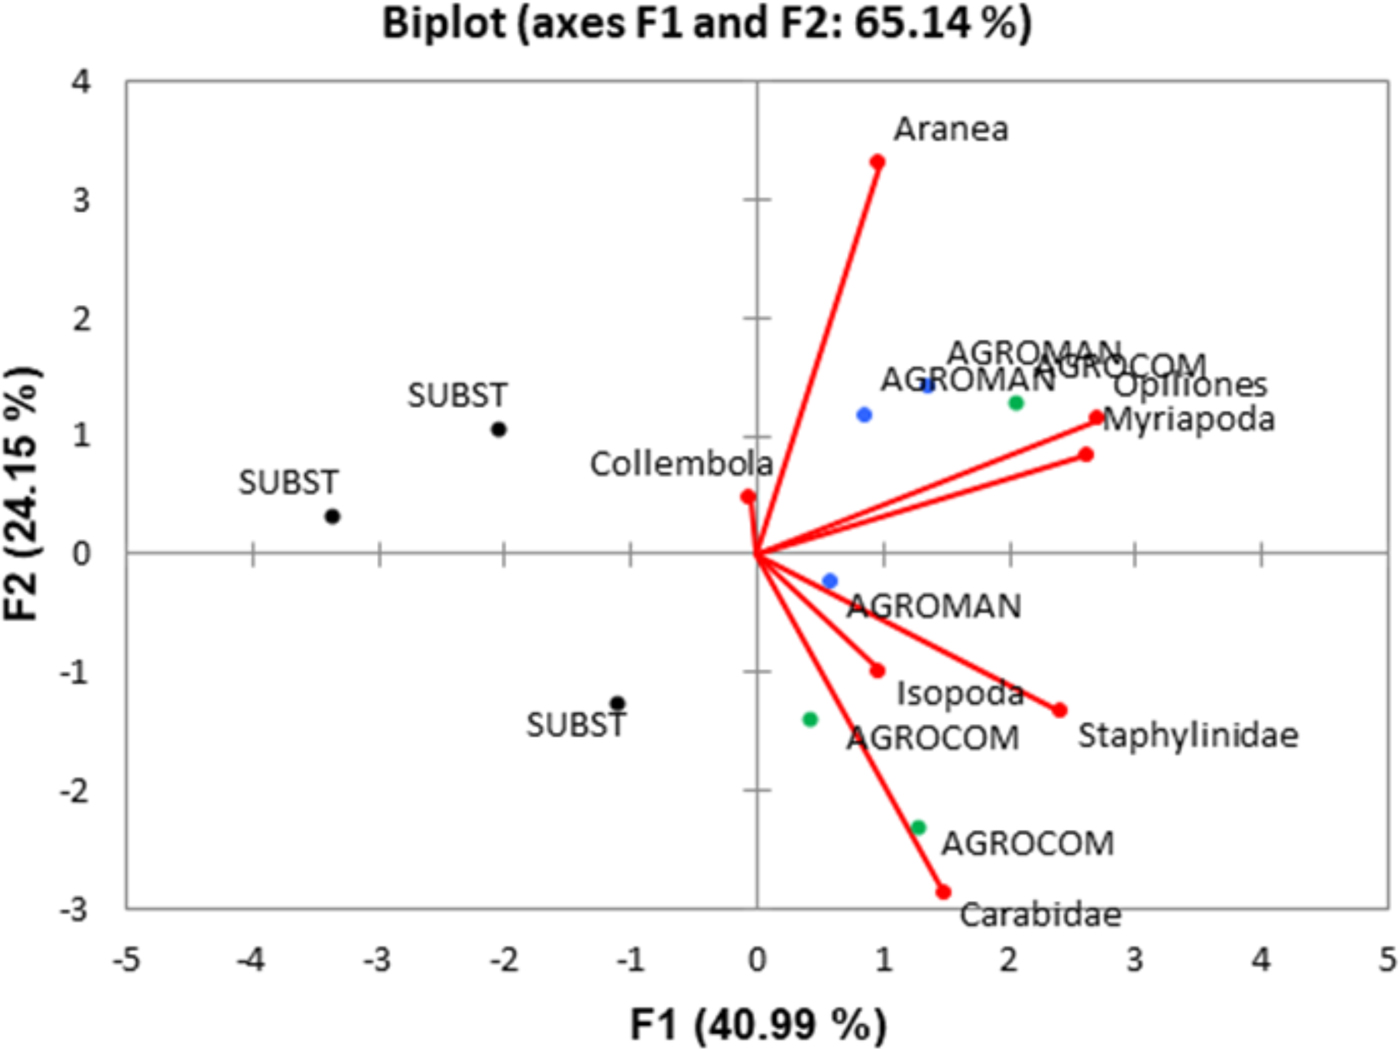
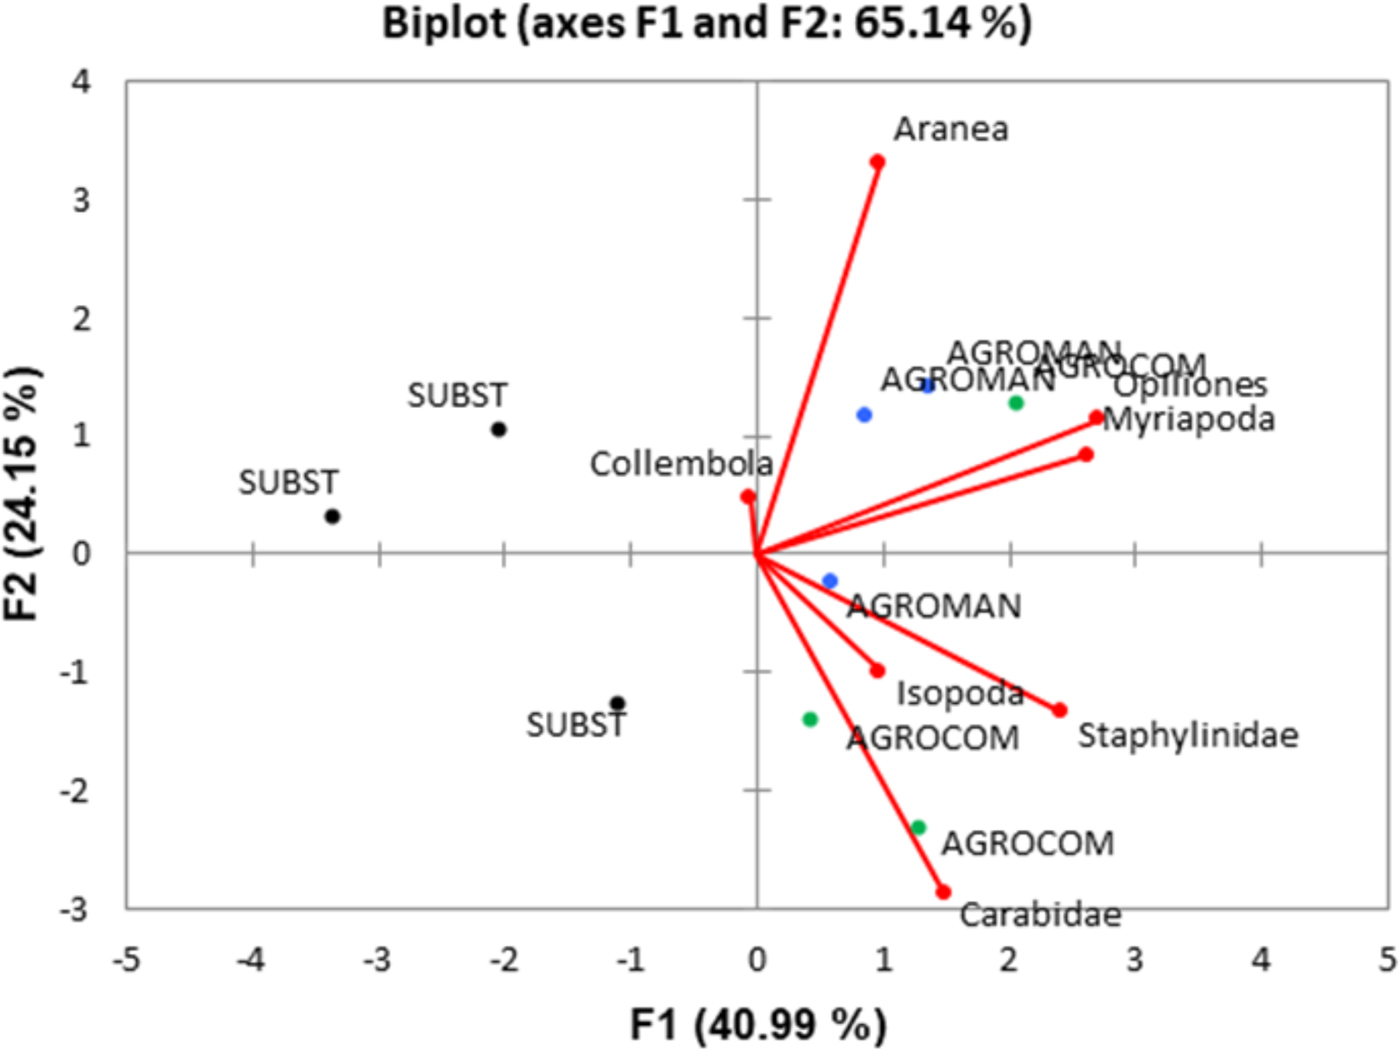
PCA ordination biplot (fig. 5) explained 65.14% of the variance, being the contribution of the first and second axes 40.99% and 24.15%, respectively. The multivariate ordination of soil taxa and systems evinced that AGROCOM and AGROMAN displayed a strong correlation with all soil taxa with the exception of Collembola, which clustered toward SUBST system. Staphylinidae, Carabidae, Isopoda, Opiliones, and Myriapoda were grouped close to the AGROCOM and AGROMAN, while the role of Aranea was less clear.
Principal component analysis (PCA) ordination biplot for the soil arthropod macrogroups as response variables (arrows) and OGH systems (symbols) as explanatory variables for the cumulative monitoring period (345 days).
Discussion
Our results demonstrated a strong dependency of soil arthropod populations on the crop and farming system under investigation, displaying significant differences in the case of ASC, kohlrabi, and lettuce. On the contrary, lamb's lettuce and zucchini did not reveal significant differences in total arthropod abundance among the different systems. In the case of lamb's lettuce, this could be associated with homogeneity of ground cover management (cellulose textile with incorporated seeds in all systems, for weed control as an additional purpose). This is in line with the conclusion of Sanguankeo & León (Reference Sanguankeo and León2011), who demonstrated that weed management practices that promote higher plant diversity and density had potential to increase the abundance of beneficial soil arthropods. For zucchini, where Collembola contributed with more than 85% of relative abundance, the other macrogroups did not demonstrate significant differences among the systems. The effect of the plastic mulch (that was applied in SUBST system during zucchini cultivation) was not pronounced, although we expected the opposite. In general, this type of mulching is not well studied in relation to soil arthropods. Kikas & Luik (Reference Kikas and Luik2002) found that plastic mulch increased the number of beneficial Carabidae species, whereas in the study of Tuovinen et al. (Reference Tuovinen, Kikas, Tolonen and Kivijärvi2006), the effect of plastic mulch on Carabidae was species-dependent, with positive effects for smaller specimens. Both studies were carried out on strawberries, comparing plastic mulch to other plant-originating dead mulches.
Total abundance of Collembola was significantly different among systems only during ASC cultivation. Previous studies demonstrated that high root biomass of grasses increases Collembola abundance (Milcu et al., Reference Milcu, Partsch, Langel and Scheu2006; Endlweber & Scheu, Reference Endlweber and Scheu2007), while our results, especially for 2014, take to different conclusions, having bare soil (SUBST system) the highest Collembola captures. Collembola populations are known to be sensitive to soil disturbance (Kracht & Schrader, Reference Kracht and Schrader1997; Wardle et al., Reference Wardle, Nicholson, Bonner and Yeates1999) and changes in soil moisture (Lensing et al., Reference Lensing, Todd and Wise2005). Tillage was the same in all systems, but AGROMAN and AGROCOM were subjected to sowing and sprinkler irrigation, which represented a possible factor of disturbance to Collembola. The biomass production of ASC mixtures could cause depletion of nutrients in soil, thus reducing fungal growth and finally amount of food resources available for Collembola (Eisenhauer et al., Reference Eisenhauer, Sabais and Scheu2011), which are known to be fungal grazers (Hopkin, Reference Hopkin1997). This interpretation could explain the particular behavior of Collembola population in our experiment.
Collembola macrogroup dominated all systems and crops over the 2-year crop rotation. This trend was more pronounced in SUBST system, while AGROCOM and AGROMAN presented more evenness of other groups, especially during ASC cultivation. In the work of Wang et al. (Reference Wang, Chen, Tan, Fan and Ruan2016), the application of organic fertilizers increased the abundance of soil arthropods, but it did not have an effect on the total taxonomical richness in poplar plantation. On the contrary, application of organic fertilizers in maize promoted diversity of soil arthropod communities (Zhu & Zhu, Reference Zhu and Zhu2015), and in long-term experiment on wheat, organic fertilizers had positive effects on spider abundance (Birkhofer et al., Reference Birkhofer, Bezemer, Bloem, Bonkowski, Christensen, Dubois, Ekelund, Fliessbach, Gunst, Hedlund, Mader, Mikola, Robin, Setala, Tatin-Froux, Van der Putten and Scheu2008). Here, comparison is done in protected conditions and with considerably different agricultural crops and methods of cultivation, due to the lack of studies on horticultural crops.
Staphylinidae taxon was mainly associated with AGROCOM and AGROMAN, except for corn salad. Species of this group are characterized by a rapid response to changes of habitat conditions, and for this reason, they are recognized as bioindicators (Bohac, Reference Bohac1999). Crop type can affect their dynamics (Nasir et al., Reference Nasir, Akram, Zahid, Ahmed, Hussain and Nasir2015) and they are known as generalist predators (Good & Giller, Reference Good and Giller1991; Collins et al., Reference Collins, Boatman, Wilcox, Holland and Chaney2002). Majority of Staphylinidae species can fly and they actively move between natural habitats and agricultural land (Clough et al., Reference Clough, Kruess and Tscharntke2007b). The presence of ecological infrastructure (flowering strips) around the experimental OGH could have promoted arthropod movement to greenhouse crops, which could have provided alternative preys (e.g. aphids) and shelter (dead mulch in AGROMAN during kohlrabi, ASC crops cultivated). The higher presence of Staphylinidae in systems with compost and manure application could be explained also by an enrichment of the food chain in these systems (i.e. incorporation of organic amendments to soil could attract other arthropods that are not harmful for plants), which were able to maintain a high number of Staphylinidae individuals (Bell et al., Reference Bell, Traugott, Sunderland, Skirvin, Mead, Kravar-Garde, Reynolds, Fenlon and Symondson2008).
Beside Collembola and Staphylinidae, the macrogroups with more notable presence in two seasons were Isopoda and Aranea. In both years of ASC cultivation, AGROMAN had significantly higher number of Isopods compared with SUBST. AGROMAN favored Aranea presence as well in both years of ASC cultivation, being significantly higher than in other systems. Isopod abundance is affected by humidity and food availability (Paoletti & Hassall, Reference Paoletti and Hassall1999) and incorporation of biomass produced from ASC cultivation represents a rich source of litter as food for Isopods, while manure application could increase water retention capacity of soil in AGROMAN system. Since ASC are cultivated as well in the AGROCOM system, differences in mean number of Isopods for those two systems could be explained by differences in C/N ratio of ASC mixtures cultivated and soil amendments applied. In previous studies, Aranea demonstrated positive reaction and increased abundance in case of agricultural diversification (e.g. intercropping or cover crop cultivation) (Sunderland & Samu, Reference Sunderland and Samu2000). This is partially confirmed by our results (for AGROMAN system), but in case of Isopods, the higher number of individuals was not persistent in the following cash crops for both years of rotation. For Aranea, results obtained indicate different findings in comparison with those of Cárdenas et al. (Reference Cárdenas, Castro and Campos2012), where cover crop removal did not have any effect on Aranea community dynamics.
The other groups (Carabidae, Opiliones, and Myriapoda) were represented by very low populations, and did not respond to the different OGH production systems, with the exception of Opiliones (on lettuce) and Myriapoda (on ASC 2015): in these cases both macrogroups were more abundant in AGROMAN system. Their activity was higher in spring crops (lettuce and lamb's lettuce), and this behavior could be linked to seasonal changes, rather than crop effects, since the biological peak of their activity is in spring time (Pinto da Rocha et al., Reference Pinto da Rocha, Machado and Giribet2007). Myriapoda play a role in the first step of leaf litter fragmentation (Snyder & Hendrix, Reference Snyder and Hendrix2008). Unfortunately, due to the very low AD, their potential as bioindicators of ecological sustainability in the Mediterranean greenhouse production is questionable. Same consideration can be done for Carabidae, which were very poorly represented in our study.
Effects of each system varied among crops, without clear patterns. Most of the differences among crops could be attributed to seasonal fluctuations, while system effects were evidenced in both years of ASC and for zucchini. Effects of organic farming on AD of some soil arthropods were contrasting in previous studies, where organic production is compared to conventional, accounting no or negative effect (Diekötter et al., Reference Diekötter, Wamser, Wolters and Birkhofer2010; Ekroos et al., Reference Ekroos, Hyvonen, Tiainen and Tiira2010) or positive effect (Burgio et al., Reference Burgio, Campanelli, Leteo, Ramilli, Depalo, Fabbri and Sgolastra2015). In all the cases, the responses were dependent by the crop and taxon considered. Field studies within organic farming demonstrated that some agricultural practices as living mulch promoted different effects on beneficial arthropods, being taxon-dependent (Depalo et al., Reference Depalo, Burgio, Von Fragstein, Kristensen, Bavec, Robačer, Campanelli and Canali2016).
Functional group analysis revealed strong potential of AGROMAN and AGROCOM for pest suppression, leading to a potential for increasing resilience in a long-term evaluation. Functional grouping carried out in this work cannot be strictly compared to other cases, for the reason of having different macrogroups included as bioindicators.
Despite the low number of individuals for some groups (Carabidae, Opiliones, and Myriapoda), PCA displayed their association with AGROMAN and AGROCOM. In general, PCA is useful for studies with several arthropod macrogroups since it can provide more deep perception of ecological interactions, by identifying macrogroups with opposite responses to a given treatment (system) (Frampton et al., Reference Frampton, Van Den Brink and Gould2000). In our study, PCA was able to clearly discriminate SUBST from AGROMAN and AGROCOM, confirming the difference of these systems on the basis of arthropod diversity. The fact is that pitfall catches are a function of the species’ true population size and its AD creates specific statistical problems (Kotze et al., 2011). This is partially solved with square root transformation, but longer and continuous sampling is the best solution to increase data confidentiality, as in the case of our study. Another problem occurs when the AD results for different species are compared. Since each species reacts differently to pitfall traps, their ‘catchability’ will also differ, subsequently with more or less incomparable results between species. Here employment of PCA analysis proved to be a good solution to analyze the data, with clear separation of SUBST system.
As already reported in a recently published paper with the same experimental approach (Tittarelli et al., Reference Tittarelli, Ceglie, Ciaccia, Mimiola, Amodio and Colelli2016), the results obtained showed that organic production systems are not all the same. A ‘conventionalized’ organic production system (based on an input substitution approach) in protected conditions guarantees a different level of environmental sustainability and of resilience respect to organic production systems, where soil fertility management is based not only on organic fertilizers application, but also on organic amendments and green manure incorporation to soil.
Conclusion
The results of our study corroborate the role of soil arthropods as bioindicators in OGH production, in a two-season study, involving four different cash crops and ASC cultivation, including different fertilization strategies and agricultural practices.
Further, our results demonstrate suitability of the selected macrogroups in assessing the ecological sustainability of Mediterranean OGH production. Moreover, the following concluding notes can be made: (i) suitability of Carabidae, in our environmental condition, to be part of indicator set should be revised, since low number of individuals does not allow adequate data processing ; (ii) groups totaling small number of individuals (Myriapoda and Opiliones) should be further explored on the basis of a functional trait approach; (iii) groups like Staphylinidae seem to be responsive as a bioindicator to characterize OFS in greenhouse conditions (in terms of different agricultural practices and crops), and their ecological role should be investigated in future research.
In conclusion, as shown by our experimental design applying agroecological approach, or diversification of agricultural practices, in OGH, production could lead to higher ecological sustainability, biodiversity conservation, and improvement of system resilience. Ecological quality assessment of greenhouse production is a complex procedure and the use of soil indicators could provide a standard way to measure ecological sustainability. Further studies should investigate the role of soil bioindicators in food webs in greenhouses in order to explain the influence of these functional groups on biological control against pests, nutrient cycles, and other ecosystem services.
Acknowledgements
The present research has been carried out in the framework of the project BIOSEMED (MIPAAF DM 24/12/2013 n.63764). The research concerning organic greenhouse production is included in the activities of the COST action FA1105 – ‘Towards a sustainable and productive EU organic greenhouse horticulture’ and it is a part of MORE GREEN Long Term Experiment (RETIBIO Project funded by Mipaaf 25865 01/12/2014). Special thanks to insectarium staff and field workers of MAI-Bari.