Introduction
Perovskite solar cells (PVSCs) have turned to be highly promising solar advancements in recent years. This is owing to their highly economical manufacturing processes[Reference Kim, Lee, Coates, Moses, Nguyen, Dante and Heeger1–Reference Chen, Hou, Zhang, Liang, Yang, Yang, Yu, Wu and Li3] while demonstrating excellent performance.[Reference Ball, Lee, Hey and Snaith4–Reference Jeon, Noh, Kim, Yang, Ryu and Seok8] The challenge to advancement of PVSCs is that the devices are very unstable and efficiency goes down due to photo-degradation.[Reference Guarnera, Abate, Zhang, Foster, Richardson, Petrozza and Snaith9–Reference Li, Bi, Yi, Décoppet, Luo, Zakeeruddin, Hagfeldt and Grätzel11] Several reports have emerged that confirm that a continuous exposure to sunlight leads to reduced performance.[Reference Roose, Baena, Gödel, Graetzel, Hagfeldt, Steiner and Abate12, Reference Leijtens, Eperon, Pathak, Abate, Lee and Snaith13] Reasons for degradation can be due to numerous factors such as degradation of the PVSC itself according to Ito et al.,[Reference Ito, Tanaka, Manabe and Nishino14] which can be caused due to heat and light-induced factors.[Reference Misra, Aharon, Li, Mogilyansky, Visoly-Fisher, Etgar and Katz15] Another reason that has been reported for poor performance is the degradation at the electrode and active region interface or charge transport layers (CTLs).[Reference Wei, Wang, Ji, Li, Cui, Li, Li, Mbengue and Song16] Additionally, other possible causes/mechanisms for degradation are ion migration and formation of trap states.[Reference Misra, Aharon, Li, Mogilyansky, Visoly-Fisher, Etgar and Katz15, Reference Yuan, Debroye, Janssen, Naiki, Steuwe, Lu, Moris, Orgiu, Uji-i, De Schryver, Samorì, Hofkens and Roeffaers17–Reference Nie, Blancon, Neukirch, Appavoo, Tsai, Chhowalla, Alam, Sfeir, Katan, Even, Tretiak, Crochet, Gupta and Mohite19]
Lead iodide commonly forms as a product during the degradation process.[Reference Misra, Aharon, Li, Mogilyansky, Visoly-Fisher, Etgar and Katz15, Reference Dualeh, Tétreault, Moehl, Gao, Nazeeruddin and Grätzel20] Several groups have shown means to improve performance and maintain it by employing compositional engineering and through addition of cross-linking additives and other precursor materials.[Reference Li, Dar, Yi, Luo, Tschumi, Zakeeruddin, Nazeeruddin, Han and Gratzel21–Reference Qiu, Merckx, Jaysankar, Masse de la Huerta, Rakocevic, Zhang, Paetzold, Gehlhaar, Froyen, Poortmans, Cheyns, Snaith and Heremans23] However, the aspects of photo-degradation need a more thorough investigation. As in real-world applications, high performance is expected under constant exposure and hence, degradation is a major reliability issue. In this work we used Pb-acetate as the main precursor and we have fabricated inverted architecture devices with indium-doped tin-oxide as the electrode (ITO), poly(3,4-ethylenedioxythiophene):poly(styrenesulfonate) (PEDOT:PSS) as the hole CTL, phenyl-C61-butyric acid methyl ester (PCBM) as the electron CTL with methyl ammonium lead iodide active layer (MAPBI3), and Ag as the counter electrode (glass/ITO/PEDOT:PSS/MAPbI3/PCBM/Ag). Results show that the addition of an optimal excess lead amount to the precursor solution is beneficial from a stability perspective as well as performance.
Experimental procedure
The recipe used in this investigation was previously reported in our previous paper.[Reference Chen, Yerramilli, Shen, Zhao and Alford24] Methylammonium iodide (MAI) and Pb-acetate trihydrate (Pb(OAc)2·3H2O) were used as received. MAI and PbAc2·3H2O were dissolved in a 3:1 ratio to prepare a 0.9 M solution in DMF. Three solutions were prepared with excessive lead acetate concentrations in the ratios, 3:1.00, 3:1.05, and 3:1.10 for MAI and PbAc2·3H2O which represent 0%, 5%, and 10% weight lead content samples, respectively. Also, the reference sample A, sample B, and sample C were prepared with 0%, 5%, and 10% weight lead content samples, respectively.
Glass substrates with patterned ITO layers were initially washed in a soap and H2O solution followed by a deionized H2O rinse. The final two steps were rinsing in solutions of C3H6O + H2O and C3H8O + H2O. Subsequently, an UV-O3 treatment for 0.25 h followed later. Substrates employed in this study were of the size 25 mm × 25 mm. The approximate size of the active region was 20 mm2. PEDOT:PSS was spin-coated at 4 × 10³ rpm for 30 s after filtering the solution. This was followed by an annealing at 130 °C for 0.25 h under a nitrogen ambient. Subsequently, Pb(OAc)2:MAI solutions were deposited on PEDOT via spin-coating at 4 × 10³ rpm for 60 s. This was followed by an annealing at 80 °C for 0.25 h. PCBM was dissolved in C6H5Cl until a concentration of 20 mg/mL was obtained. Then the solution was spun onto the perovskite layer at 1 × 10³ rpm for 0.5 min. The final processing step was to evaporate 80 nm of Al electrode by thermal evaporation.
Samples prepared were characterized for morphological properties using the XL30 Environmental FEG (FEI) microprobe. Phase identification was performed using x-ray diffraction (XRD) measurements at a tension of 40 kV and filament current of 40 mA to generate the Cu Kα radiation. A Cary 5000 UV/VIS spectrometer was used to collect UV-Vis spectra. A Picosecond Time-Correlated Single Photon Counting (TCSPC) Spectrofluorometer was used for the estimation of life-times of charge carriers. Samples were excited at 425 nm and decay of the signal has been estimated with time.
The photo-conversation capabilities of the devices were determined using J–V measurements to obtain current density characteristics. The actual analysis was performed under illumination (AM 1.5 global solar irradiation of 100 mW/cm2). An additional set of samples were prepared and illuminated with the same power density. However, these samples were removed periodically and measured to obtain J–V parameters [short-circuit current density (J sc), open-circuit voltage (V oc), and fill-factor (FF) values, power conversion efficiency (PCE)]. In an attempt to avoid sullying of the sample by moisture contamination, all devices were secured in desiccators during transferring to the characterization facilities.
Results and discussion
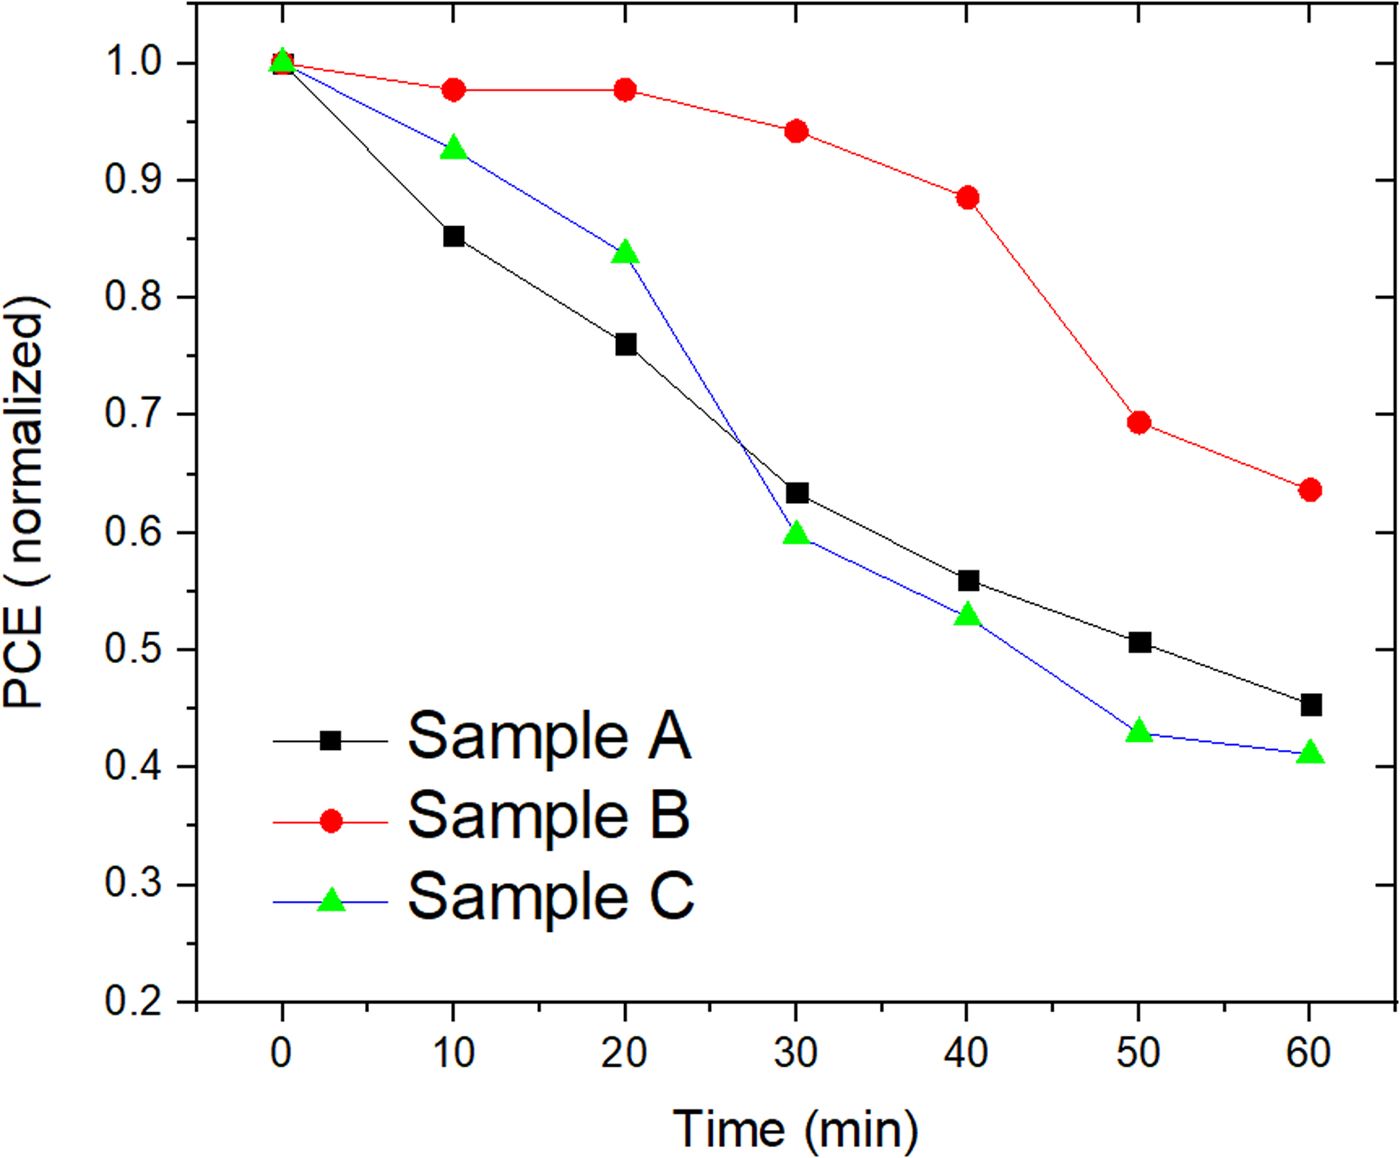
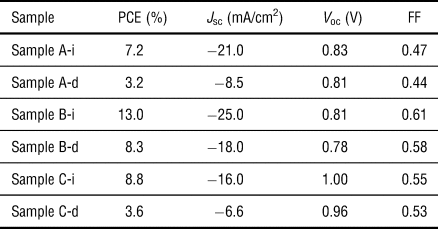
Sample B with 5% excess Pb gave the highest PCE of 13%, initially.[Reference Chen, Yerramilli, Shen, Zhao and Alford24] This was followed by samples C and A which gave 8.8% and 7.2%, respectively. The PCE of the devices follows a trend and degrades over time which is plotted in Fig. 1. The degradation of PCE with respect to time demonstrates that the degradation of PCE of sample B was much slower than other samples. The degradation of the PCE can be attributed to the breaking down of the MAPbI3 complex to form inorganic PbI2 under prolonged illumination and results in reduced PCE, J sc, V oc, and FF values. All the device metrics, before and after the reduction in PCE were measured (see Table I). The V oc and FF, and normalized degradation trends of J sc, after 60 min are shown in Fig. S1. While J sc, V oc, and FF remain constant for all devices during aging, we observe that the V oc remains relatively stable with light illumination. One of the reasons for this could be that since there is no change expected in the bandgap of the material with illumination, voltage remains unchanged.
Normalized PCE degradation as a function time, for samples A, B, and C.

PVSC samples and their corresponding device parameters.

The suffix “i” in for the pristine sample and the suffix “d” is after degradation by AM 1.5 global solar irradiation of 100 mW/cm2 exposure for 1 h.
To further understand the results, absorbance spectra are analyzed for samples before irradiation and after 60 min of irradiation in Fig. S2. The absorbance values do not change significantly from aging. Around 500 nm, a peak can be observed mutually in the devices made from samples B and C. This peak signifies the presence of PbI2 in more amounts in these samples when compared to sample A.[Reference Misra, Aharon, Li, Mogilyansky, Visoly-Fisher, Etgar and Katz15, Reference Dualeh, Tétreault, Moehl, Gao, Nazeeruddin and Grätzel20] The evolution of the MAPbI3 phase can be explained according to Eqs. (1) and (2):[Reference Dualeh, Tétreault, Moehl, Gao, Nazeeruddin and Grätzel20, Reference Chen, Yerramilli, Shen, Zhao and Alford24]
 $$\eqalign{& {\rm Pb}({\rm C}{\rm H}_{\rm 3}{\rm COO})_{\rm 2} + {\rm 3C}{\rm H}_{\rm 3}{\rm N}{\rm H}_{\rm 3}{\rm I} \cr & \qquad \to {\rm C}{\rm H}_{\rm 3}{\rm N}{\rm H}_{\rm 3}{\rm Pb}{\rm I}_{\rm 3} + {\rm 2C}{\rm H}_{\rm 3}{\rm N}{\rm H}_{\rm 3}{\rm C}{\rm H}_{\rm 3}{\rm COO}\uparrow}$$
 $${\rm C}{\rm H}_{\rm 3}{\rm N}{\rm H}_{\rm 3}{\rm Pb}{\rm I}_{\rm 3}\to {\rm Pb}{\rm I}_{\rm 2} + {\rm C}{\rm H}_{\rm 3}{\rm N}{\rm H}_{\rm 2} + {\rm HI}$$
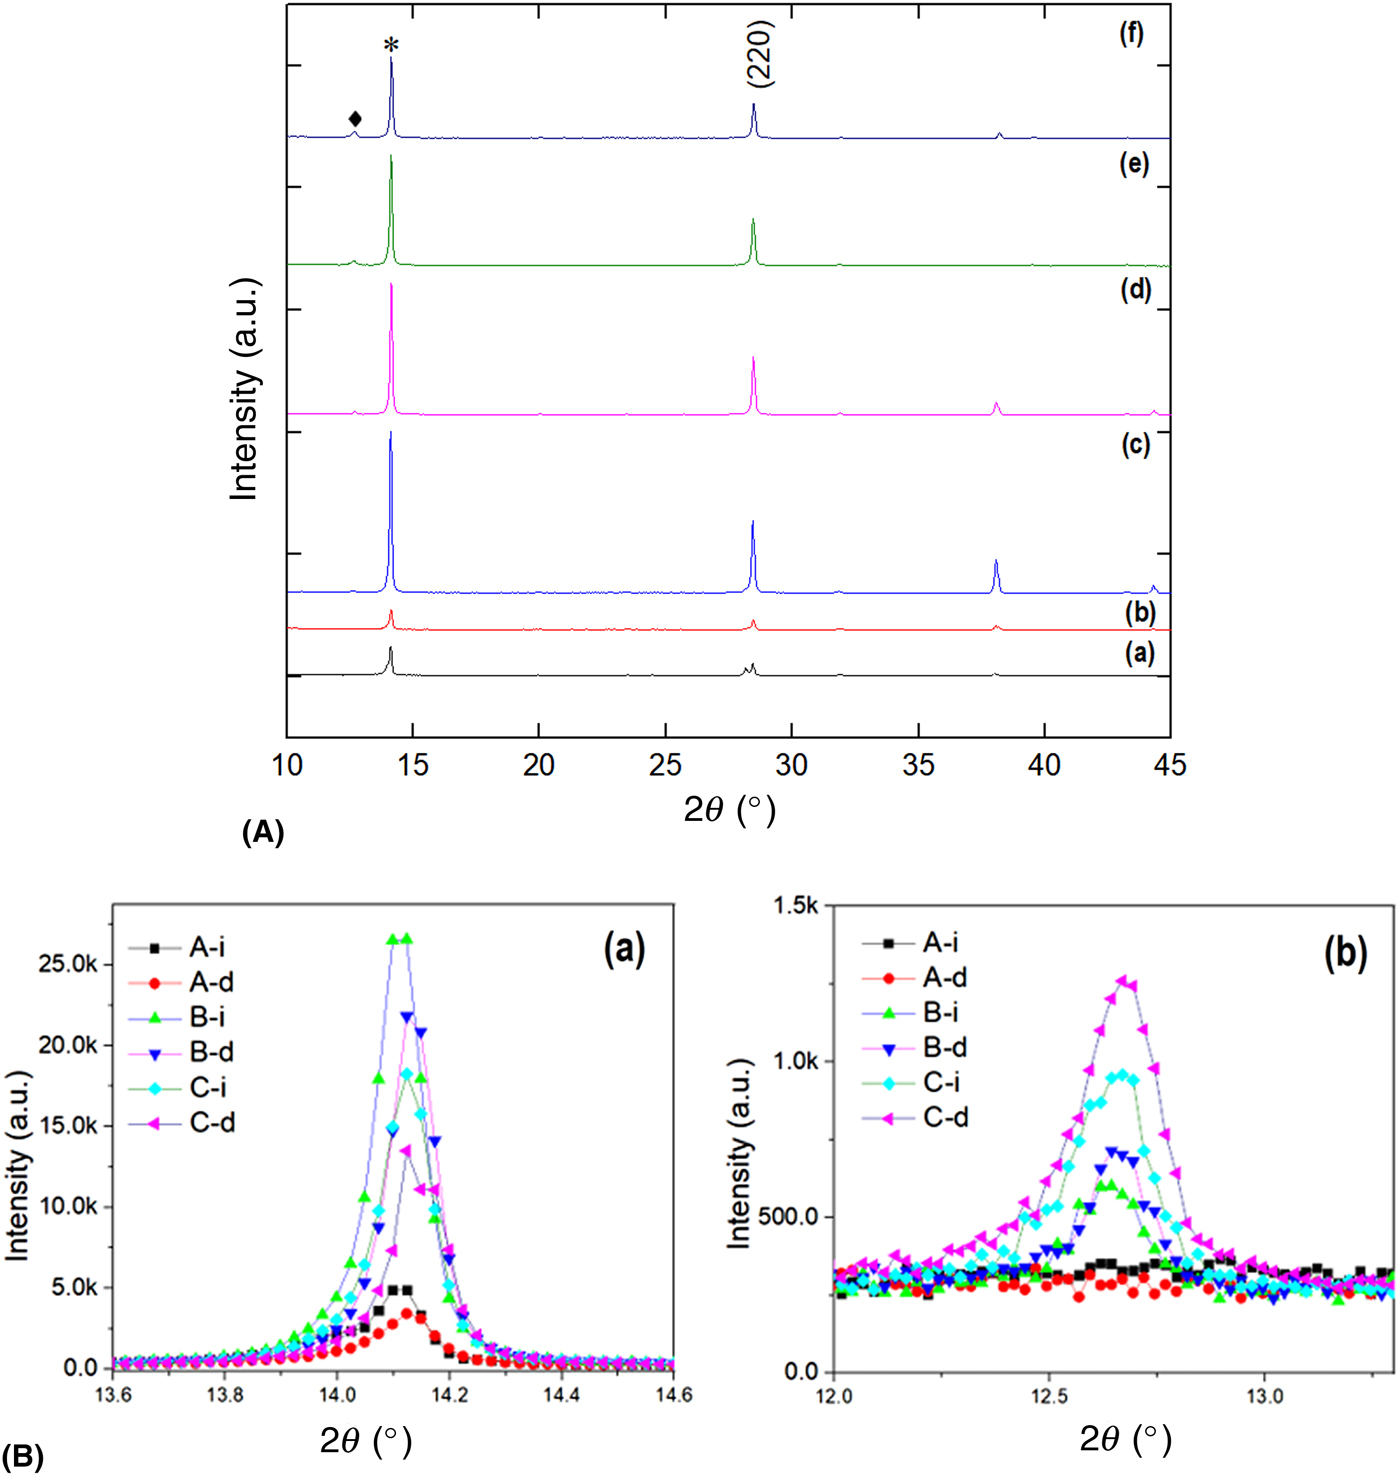
XRD data further show evidence of the formation of lead iodide, PbI2 as shown in Fig. 2(A). The peaks that appear are at 12.67° which is the (001) peak from PbI2 and the MAPbI3 peaks occurring at 14.11° (110) and 28.45° (220). The XRD data initially show that the MAPbI3 reflection is the highest for sample B than samples A and C, comparatively. After prolonged exposure to irradiation, all samples show a notable reduction in the intensities of the MAPbI3 peaks. This is a direct consequence of the reduced crystallinity of the MAPbI3. This confirms that a structural demise of the MAPbI3 phase and generation of the PbI2 phase occurs during the illumination aging. Magnified graphs shown in Fig. 2(B) reveal more phase information. Inspection of the scans reveals a reduction in the peak intensity of the MAPbI3. This occurs with an increase of the (001) PbI2 peak for samples A, B, and C. All of the 0% excess Pb sample, sample A, degrade to form less amounts of PbI2 samples B and C. Hence, the peaks correspondingly show that. To further investigate the structural changes, microprobe images of pristine samples and degraded samples can be seen in the supplementary section (Fig. S3). Inspection reveals the absence of any substantial variations from one image to the other. This leads to the conclusion that the active layer degradation is not significant at the surface level.
(A) XRD results from symmetrical θ–2θ scans from the various samples prior to and after exposure to AM 1.5 global solar irradiation of 100 mW/cm2. The times denote the duration of the exposure. Sample A-i: (a) 0 min and (b) 60 min; sample B: (c) 0 min and (d) 60 min; sample C: (e) 0 min and (f) 60 min. The solid diamond denotes the PbI2 (001) reflection and the asterisk denotes the MAPbI3 (110) reflection. (B) Enhanced portions of the XRD spectra depicting: (a) (110) reflections of MAPbI3 and (b) (001) PbI2 reflections prior to and after exposure to AM 1.5 global solar irradiation of 100 mW/cm2, the suffix “i” in for the pristine sample and the suffix “d” is after degradation for samples A, B and C.

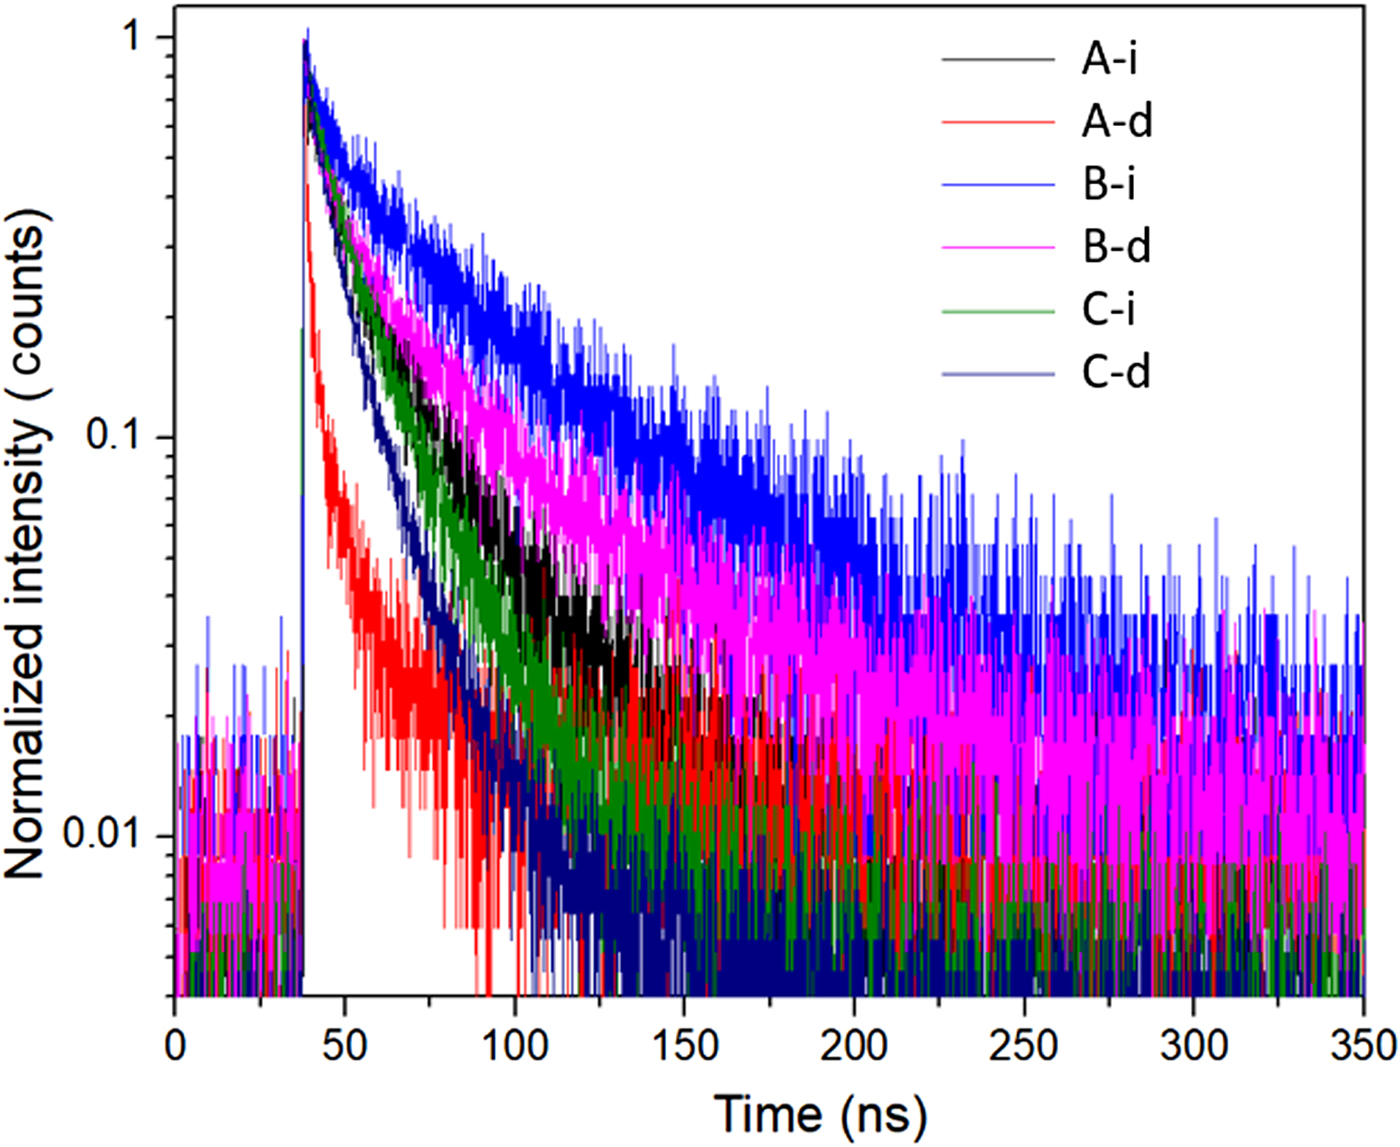
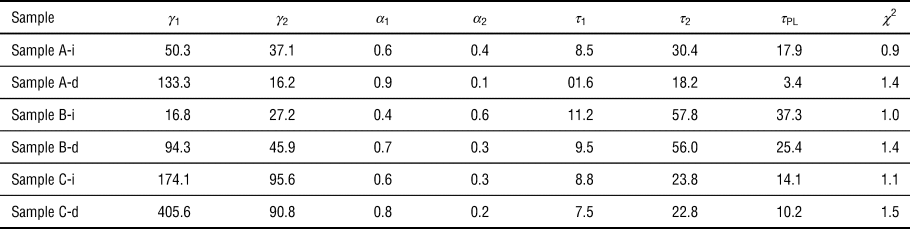
Spectra from the TCPL spectrofluorometer assist in further understand the charge transport dynamics from the formation of PbI2. To be noted is that the laser is incident on the glass side of the samples while the detector is placed opposite of the other side where the active layer is coated. Result of the TCPL analysis of the charge transport, both pristine and degraded, are shown in Fig. 3. The raw intensity versus time data from the photoluminescence analysis is plotted versus a bi-exponential decay function  $I(t) = \gamma _1{\rm e}^{-(t/\tau _1)} + \gamma _2{\rm e}^{-(t/\tau _2)}$. Total life-times τ PL are determined by τ PL = α 1τ 1 + α 2τ 2. Note that α 1 is equal to γ 1/(γ 1 + γ 2) and α 2 is equal to γ 2/(γ 1 + γ 2). Table II provides a listing of the parameters τ 1, τ 2, α 1, and α 2 used to fit the TCPL spectra are provided. Note that corresponding chi-square errors (χ 2) are also listed. These results indicate that sample A devices have a measured life-time value from 30 to 18 ns for the pristine and degraded samples, respectively. This order of change in the magnitude of the life-time is considered significant. Samples B and C devices, on the contrary, show only negligible chance in the values of life-times. These are 58 to 56 ns for sample B and 24 to 23 ns for sample C.
TCPL spectra of the active layer for samples A, B, and C, with suffix “i” in for the pristine sample and the suffix “d” is after degradation.

PVSC samples and their corresponding fitting parameters.

The suffix “i” in for the pristine sample and the suffix “d” is after degradation by AM 1.5 global solar irradiation of 100 mW/cm2 exposure for 1 h.
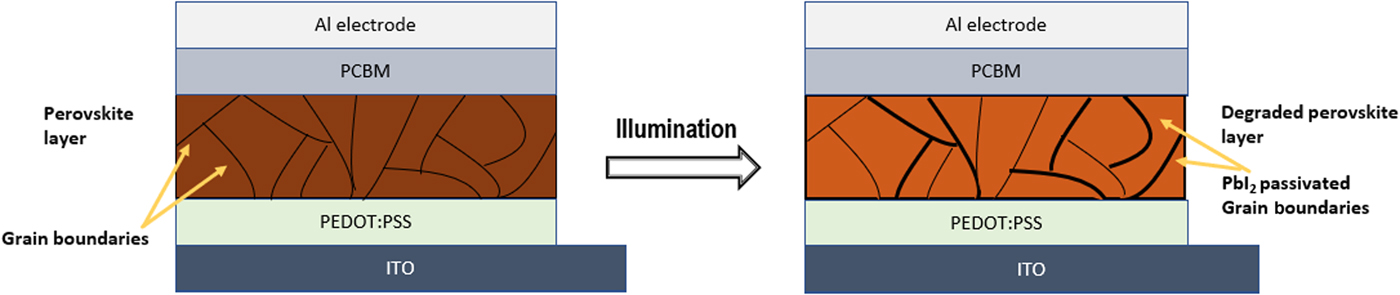
We propose the hypothesis that PbI2 resides along the grain boundaries (GB) as demonstrated in Fig. 4 and functions as a two-dimensional (2-D) defect serves as a charge-recombination center. The presence of this global defect on the PVS grain on the GB results in diminished efficacy of charge partitioning.[Reference Wang, McCleese, Kovalsky, Zhao and Burda25, Reference Chen, Zhou, Bin Song, Luo, Hong, Duan, Dou, Liu and Yang26] However, a fortunate consequence of this 2-D layer is that original life-time values are not diminished as evidence of the TCPL measurements. This finding implies that during sustained illuminations it is beneficial having PbI2 at GBs.
Depiction of the PVSC microstructure. Note that PbI2 resides along GB and functions as a 2-D charges-recombination center and results in diminished PCE values.

A concentration of PbI2 higher than that of 5% (sample B) has demonstrated to negatively affect extraction efficiency. The reason for this can be due to an excessive amount of PbI2 presence, which now acts as a barrier for smooth electron transport between the GBs.[Reference Wang, McCleese, Kovalsky, Zhao and Burda25, Reference Chen, Zhou, Bin Song, Luo, Hong, Duan, Dou, Liu and Yang26] Hence, according to our results, 5% excess Pb in the precursors is the optimum concentration and its degradation of PbI2 is just enough to maintain stability after continuous illumination. The 10% excess lead sample (sample C) results in a significantly higher concentration of PbI2. This result in poor film crystalline structure and higher amounts of PbI2 in the GBs. Their combinatorial effect results in lower PCE values.
Conclusion
Our investigation revealed that the relative magnitude of Pb in precursor significantly impacts the performance and stability of our devices. Those devices fabricated with 5% excess Pb (sample B) exhibit the best stability as shown by the retainment of 50% of the original efficiency and this is due to the occurrence of PbI2 at the GB. XRD analysis and absorbance spectroscopy confirmed the structure and light-induced enhancement in stability. It is the presence of the Pb-halide phase, PbI2, in the GB of the photo-active region was the source of the device's negligible degradation in initial photo-conversion efficiencies. Unfortunately, this took place during the concurrent degradation of the device's photo-conversion efficiency.
Outcomes from this investigation offer insight into the roles of excess Pb and PbI2 in PVSCs for enhanced stability under simulated solar irradiation.
Supplementary material
The supplementary material for this article can be found at https://doi.org/10.1557/mrc.2018.231.
Acknowledgments
This work was conducted in the Macro Technology Works (MTW) Facility at Arizona State University. Financial assistance in part was provided by the Pan African Materials Institute (PAMI) through funding from the World Bank (PAMI Grant ID ASU-NOA). The authors appreciate the support from both PAMI and MTW.