From particles to fields
Standard texts on statistical mechanics discuss building equilibrium models of classical assemblies of molecules in various ensembles.Reference Chandler1 These descriptions generally invoke pair-wise interactions among atoms or atomic sites on molecules, sometimes correcting the classical force field with three-body terms. A less-known fact is that techniques exist for exactly converting such a many-body problem involving interacting particle degrees of freedom into a statistical field-theory description, wherein fluctuating fields become the relevant degrees of freedom.Reference Fredrickson2
Why would re-expressing the partition function of an ensemble of molecules in terms of functional integrals over fields, rather than ordinary integrals over atomic coordinates, be a useful thing to do? First, from the standpoint of numerical simulations, fields can be represented in many different ways (e.g., spectrally or in real space), and on uniform or nonuniform grids. This gives field-based simulations a significant computational advantage, as the degrees of freedom can be easily adapted to the nano-, meso-, and microstructure of the material investigated. For example, interfaces in a multiphase material can be tracked at high resolution, while nearly structureless bulk domains are resolved on a coarse grid. In contrast, a molecular simulation based on a model with ∼106 atomic coordinates is forced to track all of those coordinates throughout the simulation trajectory or risk losing vital information.
Second, field-theory descriptions are more natural for multiscale and coarse-graining strategies, which aim to extend computationally accessible length scales by eliminating degrees of freedom in a thermodynamically consistent way, than particle models. In coarse-graining particle models, one must decide among various complex proceduresReference Noid, Chu, Ayton, Krishna, Izvekov, Voth, Das and Anderson3,Reference Shell4 for eliminating atomic sites in favor of fewer lumped “molecular” coordinates. With fields, simple block averaging, spectral filtering, or interpolation operations affect the desired up- or downscaling. A third, but less obvious, advantage of field-theory descriptions is that statistical field theories admit mean-field solutions, similar to Hartree–Fock theory in quantum chemistry, which uses a single Slater determinant ansatz for the many-body wave function to develop a self-consistent mean-field theory. The availability of mean-field approaches can sometimes permit drastically less expensive simulation options. In the case of interacting polymers, for example, the mean-field (or “self-consistent field-theory” [SCFT]) approximation becomes increasingly accurate as the polymer assembly becomes denser and the polymers are longer. Field-based simulations of polymer melts become computationally less demanding at high molecular weight—exactly the opposite of what occurs in particle simulations.
A variety of techniques are available for transforming a many-body particle model into a field theory. Three are particularly well suited to models of soft materials with polymer components—the auxiliary field (AF) method of S.F. Edwards,Reference Edwards5 the coherent states (CS) formalism of S.F. Edwards and K.F. Freed,Reference Edwards and Freed6 and the n → 0 trick of P.G. de Gennes, where n refers to the so-called n-vector family of statistical mechanical models of n-component classical spins on a lattice, with n = 1 corresponding to the standard Ising model, n = 2 to the XY model, and analytic continuation to n = 0 results in the self-avoiding random walk.Reference de Gennes7 These methods all lead to mathematically different, but formally equivalent, field-theory representations of a given model. Unfortunately, the third method is apparently ill-suited for simulations because it requires analytic continuation to a zero-dimensional field. We do not yet know how to numerically represent a zero-component field.
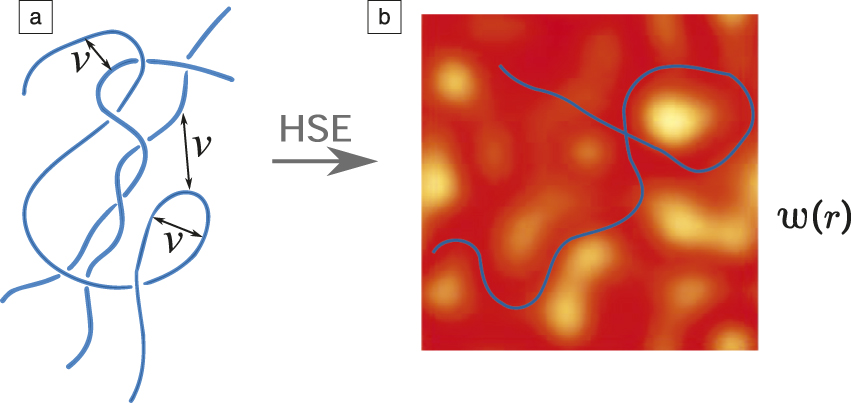
The vast majority of numerical work on molecularly informed (as opposed to phenomenological) field theories of soft matter has been conducted in Edwards’ AF framework. The basic idea is to use Gaussian integral identities known as Hubbard–Stratonovich–Edwards (HSE) transformations to decouple all pairwise interactions in the partition function of a many-particle system.Reference Fredrickson2 As illustrated in Figure 1, this introduces one or more fluctuating “auxiliary” fields, w(r), which interact with the particles, but the particles do not interact with each other. The particle coordinates can be traced out of the partition function, leaving one or more functional integrals over the w fields. This constitutes a statistical field theory with fields, w(r), defined over a d-dimensional domain of spatial positions, r. Table I shows the AF representation of a simple “Edwards’” model of flexible (homo)polymers in a melt or solution state whose segments of size, b, interact via a purely repulsive pair potential, v(r), (expressed in units of the thermal energy, k BT, where k B is the Boltzmann constant and T is the temperature). We have adopted the grand canonical ensemble, although any ensemble is accessible, with grand partition function Ξ(z, V, T) depending on polymer activity, z, and volume, V. The first equation (Table Ia) expresses Ξ as a functional integral over a real auxiliary field, w, within a d-dimensional domain of volume, V. The integration path is along the real axis of w, and H[w] is an effective Hamiltonian functional. The Hamiltonian, given in the second equation (Table Ib), has two contributions. The first contribution is quadratic in w and involves the functional inverse of the pair potential, v. (We have assumed that the inverse exists and that the eigenvalues of v are all positive; generalizations are possible.) The second contribution arises from the eliminated polymer translational and conformational degrees of freedom and involves the configurational partition function Q[iw] of a single polymer experiencing a purely imaginary field iw  $\left( {i = \sqrt { - 1} } \right)$. The factor of i is a mathematical artifact of the HSE transform but is critically important. For a given field configuration, Q and H are thus complex numbers, as is the “Boltzmann-like” statistical weight exp(–H). AF field theories are thus intrinsically complex valued.
Schematic of a particle-to-field transformation. (a) A collection of polymers with segments interacting pairwise through a potential, ν, can be rendered (b) noninteracting through the introduction of an auxiliary field, ω. Each polymer interacts with the field, but not with neighboring polymers. Note: r, spatial position; HSE, Hubbard–Stratonovich–Edwards.

Auxiliary field representation of the Edwards' model of a homopolymer solution or melt in the grand canonical ensemble.

Note: z, polymer activity; V, volume; T, temperature;  ${\cal D}$, functional integral; w, auxiliary fields; d, number of dimensions; r, r′ spatial positions; v, pair potential; Q[iw], configurational partition function; q(r, s), chain propagator; s, contour variable.
The single-chain partition function, Q, (Table Ic) could be computed stochastically (e.g., by Monte Carlo simulation of many replicas of polymer chains in a specified field, iw), but it is more efficient to evaluate Q deterministically. In the simplest case of flexible chains described by a continuous Gaussian chain model,Reference Fredrickson2 which represents polymer chains as 1D elastic filaments with a Gaussian distribution for the end-to-end distance in the absence of nonbonded interactions, we solve a modified diffusion equation (Table Id) for a chain propagator q(r, s), where s is a contour variable denoting position along the polymer. This is done by contour-stepping from s = 0 to s = N, the total length of the chain. The final quadrature in Table Ic evaluates Q as the sum of all field-biased polymer conformations averaged over the polymer end position, r. For bulk simulations, periodic boundary conditions are imposed in space; the s “initial” condition q(r, 0) = 1 expresses the fact that a polymer of zero length is not influenced by the field.
As described in the next section, field-theoretic simulations involve a stochastic procedure for sampling w field configurations with complex weight exp(–H). At each field update step, the chain propagator equation (Table Id) must be numerically resolved in (d + 1)-dimensions to obtain q(r, s). This is the computationally demanding “inner loop” in an AF field theory simulation.
Table II, in contrast, shows a field-theoretic representation of the same Edwards homopolymer model, but now in the CS framework, as first introduced by Edwards and FreedReference Edwards and Freed6 and recently revisited.Reference Man, Delaney, Villet, Orland and Fredrickson8 The CS formalism is based on the “coherent states” representation of second-quantized field theory;Reference Negele and Orland9 but while quantum particles in Feynman’s path integral pictureReference Feynman and Hibbs10 exhibit ring polymer conformations in imaginary time and interact only at equal times, classical polymers are linear, and segments interact at all pairs of contour positions s and s′. Table IIa expresses Ξ(z, V, T) as a functional integral over two complex-conjugate fields φ(r, s) and φ*(r, s) with (d + 1) internal dimensions. Writing φ = g + ih and φ* = g – ih, the integrals are taken over the real-valued fields g and h. The Hamiltonian in Table IIb has terms that reflect chain propagation, pairwise interactions, sink, and source terms, respectively. Specifically, the term zφ*(r, 0) initiates chains at s = 0, while the term φ(r, N) terminates chains after N segments. Finally, Table IIc shows an expression for the segment density operator that enters the interaction term. In spite of being a complex-valued field theory, it is evident that the CS representation is simpler than the AF theory in having its nonlocal terms directly exposed and H being finite polynomial order (fourth) in the φ and φ* fields. The computational cost of evaluating H in the two theories is comparable; however, the fluctuating φ, φ* fields have one higher internal dimension in the CS representation than the w field in the AF form.
Coherent-states representation of the Edwards model of a homopolymer solution or melt in the grand canonical ensemble.
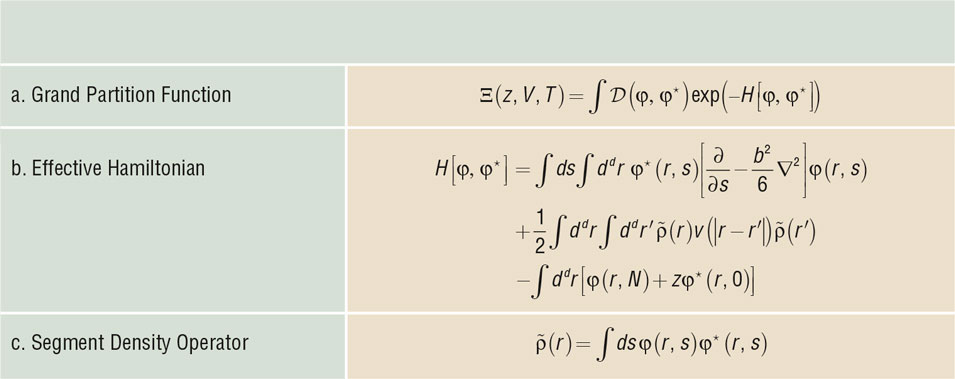
Note: z, polymer activity; V, volume; T, temperature;  ${\cal D}$, functional integral; φ, coherent-states field; φ*, complex-conjugate coherent-states field; d, number of dimensions; r, r′, spatial positions; s, contour variable; N, number of segments; b, segment size.
Tables I and II illustrate the AF and CS theories, respectively, for the simplest of polymer models. Both can be generalized to broad classes of soft materials including branched and block polymers, polyelectrolytes, and multicomponent systems incorporating solvents, small ions, or nanoparticles.Reference Fredrickson2
Numerical treatment and the “sign problem”
In all but the most trivial of situations, numerical solutions to the field-theory models are necessary to deduce structure and thermodynamic properties. There are two options: (1) invoke a mean-field (or SCFT) approximation and conduct a simulation to deduce the relevant mean-field configuration of the system, or (2) perform a “field-theoretic simulation” (FTS)Reference Fredrickson2,Reference Ganesan and Fredrickson11,Reference Fredrickson, Ganesan and Drolet12 to stochastically sample field configurations in the exact model without any simplifying approximations. The former approach of SCFT amounts to developing numerical solutions to the saddle point equations δH/δw = 0 or δH/δφ = δH/δφ* = 0, and has been extensively discussed and exploited in the AF framework for a wide variety of systems, notably block copolymers.Reference Fredrickson2,Reference Matsen and Schick13,Reference Matsen14 SCFT is generally accurate when polymer coils are strongly overlapping; namely, the dimensionless chain concentration  $C = nR_{\rm{g}}^3/V$ is large, where n is the number of polymers and R g is the polymer radius of gyration. However, even when this condition is met, SCFT can fail, especially in the vicinity of critical phase transitions or unbinding transitions that lead to micellar or microemulsion phases.Reference Fredrickson and Helfand15,Reference Bates, Maurer, Lipic, Hillmyer, Almdal, Mortensen, Fredrickson and Lodge16
Our focus here is on the FTS technique that fully accounts for field fluctuations.Reference Fredrickson2,Reference Ganesan and Fredrickson11,Reference Fredrickson, Ganesan and Drolet12 Naively, one might think that a Monte Carlo procedure could be used for generating importance sampled field configurations (i.e., field configurations produced with probability according to their weight in the partition function) of both AF and CS field theories. However, because H is complex and extensive in the system volume V, a wildly oscillating phase factor exp(–iH I), where H I is the imaginary part of H, emerges as a statistical weight in thermodynamic averages—rendering Monte Carlo sampling highly inefficient. This is known as the “sign problem” and is a well-known impediment to simulating quantum chemical dynamics and quantum many-body systems.Reference Kieu and Griffin17,Reference Loh, Gubernatis, Scalettar, White, Scalapino and Sugar18 While no general solution exists, we have found that complex Langevin (CL) dynamics (see next section), originally proposed by Parisi and Klauder in a different quantum field theory context,Reference Parisi19–Reference Klauder and Ezawa21 practically resolves the sign problem for AF-Reference Ganesan and Fredrickson11 and CS-Reference Man, Delaney, Villet, Orland and Fredrickson8type polymer field theories.
Table III shows CL schemes for AF- and CS-type field theories, which amount to stochastic partial differential or integral equations that are integrated in time to a steady state for the purpose of importance sampling the complex distribution of states, exp(–iH). The time evolution in such a simulation is not physically meaningful, but is simply an artifice to sample representative states from the equilibrium distribution. Table IIIa shows a CL scheme for AF field theories that evolves w by a dynamics that relaxes fields down the complex-valued force, δH/δw, with an additive Gaussian-distributed white noise, η, which is strictly real, that has zero mean and a variance consistent with the fluctuation-dissipation theorem and is statistically uncorrelated for all positions and times. The w field configurations so generated are complex-valued even though the original integration path was real. Table IIIb shows a recently identifiedReference Man, Delaney, Villet, Orland and Fredrickson8 CL scheme for CS theories that has an off-diagonal mobility matrix applied to the force terms and complex-conjugate additive noise sources, µ and µ*, which are composed from two real, uncorrelated Gaussian white noises, η1 and η2. If these schemes have a steady state, it can be shown that the CL dynamics samples the proper complex distribution,Reference Fredrickson2,Reference Man, Delaney, Villet, Orland and Fredrickson8,Reference Gausterer and Lee22 but there is no general proof of convergence for arbitrary H.
Complex Langevin dynamics schemes for auxiliary field and coherent-states field theory models.

Note: t, t′, time variables; s, s′, contour variables; w(r, t), auxiliary field; r,r′, spatial positions; H, Hamiltonian; η, η1, η2, Gaussian white noise; φ, coherent-states field; φ*, complex-conjugate coherent-states field; μ, μ*, complex-conjugate additive noise sources; j, k, complex component indices.
A FTS-CL simulation is conducted by discretizing the continuum field equations and then time-stepping the stochastic CL equations to generate a Markov chain of field configurations (i.e., the probability of a field configuration depends only on the previous state) for computing thermodynamic averages. For bulk simulations with periodic boundary conditions, we favor pseudo-spectral approaches to discretization based on collocation with a plane-wave basis, as the relevant operators are diagonal in real or reciprocal space and fast Fourier transform algorithms are highly optimized on modern GPU computing hardware.Reference Delaney and Fredrickson23 The CL equations are nonlocal, nonlinear, and stiff; we have found that a semi-implicitReference Lennon, Mohler, Ceniceros, Garcia-Cervera and Fredrickson24 scheme, which treats linearized force components at the future time, and an exponential time-differencingReference Villet and Fredrickson25 scheme, which takes linearized forces as an integrating factor over a time step, are well-suited for achieving accuracy and stability in the stochastic time integration.
All applications of FTS simulations to date have been pursued with the mature AF framework since CL schemes appropriate for the CS representation were only recently identified.Reference Man, Delaney, Villet, Orland and Fredrickson8 In a direct comparison of FTS-CL simulations for the two representations of the grand canonical Edwards homopolymer model,Reference Man, Delaney, Villet, Orland and Fredrickson8 it was found that simulations in the CS framework were approximately 10–100× less efficient than in the AF representation. This is due to a large population variance of thermodynamic observables in the CS case; the injection of noise in the extra contour dimension (s) is apparently responsible. Research to improve the efficiency of simulations conducted in the CS representation is of high priority in order to pursue applications enabled by the theory’s unique structure (e.g., in supramolecular polymer science) as discussed next.
Application examples
Vast families of soft material systems can be investigated using FTS-CL techniques. Most interesting are dense collections of long polymers with structure on mesoscopic scales ranging from nanometers to micrometers, which are difficult to simulate with traditional particle-based methods, and systems highly susceptible to thermal fluctuations, for which mean-field theory (SCFT) fails. In the first category, it is important to emphasize that the chain length, N, enters only as a parameter in the field theories. Thus, in principle, it is no more expensive in computational cost to conduct an FTS simulation with N = 1 or N = 106, apart from any difference in length scales that would need to be resolved. This is a remarkable result in view of the typical N Reference Fredrickson2 (Rouse-like) to N Reference Noid, Chu, Ayton, Krishna, Izvekov, Voth, Das and Anderson3.Reference Shell4 (entangled) growth in computation time with chain length observed in particle simulations.Reference Doi and Edwards26,Reference Padding and Briels27 In addition, the dimensionless chain concentration, C, is large for high molecular weight melts, scaling as N 1/2, so relevant field configurations are localized near the mean-field saddle point configuration, and FTS-CL simulations become highly efficient.
Block polymer order–disorder transitions
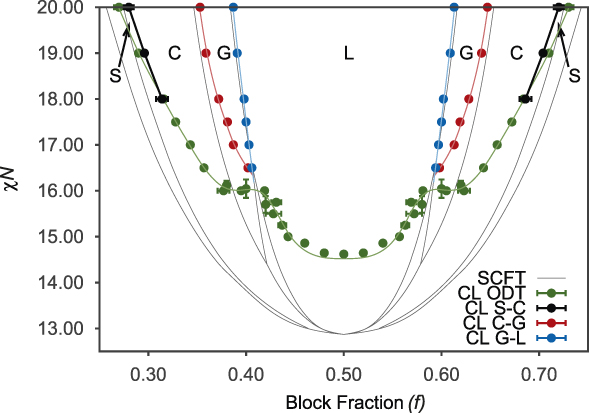
The order–disorder phase boundary of block copolymer melts and solutions is highly susceptible to thermal fluctuations.Reference Bates and Fredrickson28 Using FTS-CL simulations of an AF model, the first comprehensive phase diagrams were obtained for a two-species “AB” diblock copolymer model, in which each chain contains two coherent blocks of chemically distinct monomers, without any simplifying approximations applied.Reference Delaney and Fredrickson29 An example phase diagram, reproduced in Figure 2 for the case of C = 7, which corresponds to a high but experimentally relevant molecular weight, shows order–disorder and order–order phase boundaries located by thermodynamic integration free-energy calculations.Reference Lennon, Katsov and Fredrickson30 The mean-field (SCFT) phase diagram is overlaid in gray in the coordinates of χN versus f, where χ is the Flory interaction parameter characterizing the strength of unfavorable A–B segment contacts, N is the number of statistical segments in a polymer chain, and f is the volume fraction of A segments in the diblock. The diagram shows large fluctuation stabilization of the disordered phase relative to the ordered mesophases L (lamellar), C (hexagonally packed cylinders), S (bcc spheres), and G (double gyroid), resulting in a shift of the order–disorder envelope to higher χN. The second-order (continuous) phase transition predicted at the mean-field critical point at f = 0.5 is further seen to be destroyed, replaced by a fluctuation-induced first-order transition between disordered and lamellar phases. This work confirms earlier theoretical predictions based on asymptotic analysis for large chain concentration C,Reference Fredrickson and Helfand15 but extends our understanding of the model to the experimentally relevant rangeReference Bates, Rosedale, Fredrickson and Glinka31 of C < 10.
Complex Langevin (CL) phase diagram compared against a mean-field (self-consistent field theory, SCFT) phase diagram (gray) for the same model of an AB diblock copolymer melt at C = 7. The fluctuation-corrected (CL) order–disorder transition (ODT), shown in green, is strongly modified by fluctuations. The CL-derived order–order transitions in black (bcc spheres S to hexagonally packed cylinders C), red (cylinders C to double gyroid cubic G), and blue (double gyroid G to lamellae L) are only weakly modified from SCFT, particularly at strong segregation.Reference Delaney and Fredrickson29 Note: χN, segregation strength between dissimilar blocks; f, volume fraction of A segments in a copolymer.

Polyelectrolyte complexes: Complex coacervates
There is considerable current interest in complexes formed from oppositely charged polyelectrolytes in aqueous solution.Reference Veis and Aranyi32 Such complexes are implicated in diseases associated with abnormal protein segregationReference Benedek33 and in wet adhesives produced by organisms such as marine mussels,Reference Zhao, Sun, Stewart and Waite34 and are the basis for various coating and encapsulation technologies.Reference de Kruif, Weinbreck and de Vries35 Fluid complexes formed by mixing separate cationic and anionic polymers are sometimes called “complex coacervates,” while block polyampholytes—polymers containing blocks of both charge—can condense to create a one-component “self-coacervate.” The theoretical literature surrounding the formation of these complexes is considerable,Reference Borue and Erukhimovich36–Reference Sing41 yet until recently,Reference Delaney and Fredrickson42 no exact results on even simple models were available.
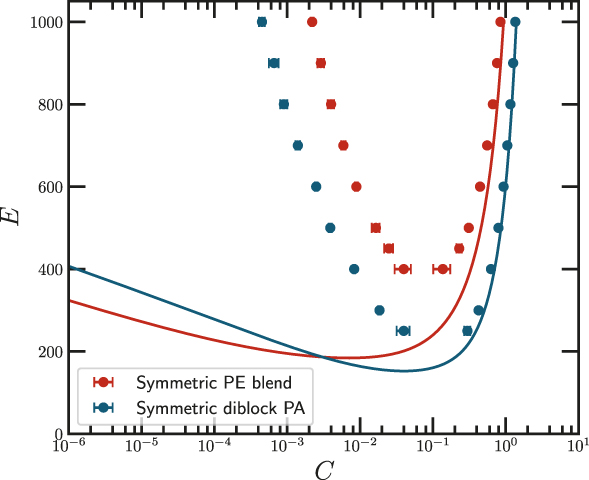
In an AF representation of such a model, a fluctuating electrostatic potential emerges as the auxiliary field necessary to decouple Coulomb interactions. Mean-field theory fails catastrophically, predicting nothing but a homogeneous solution with uniform electrostatic potential, while FTS simulations properly reveal “coacervation” (i.e., liquid–liquid phase separation into a dilute supernatant phase and a dense coacervate phase containing the vast majority of the polymer).Reference Popov, Lee and Fredrickson43,Reference Lee, Popov and Fredrickson44 The first comprehensive phase diagrams without approximation for simple coacervate and self-coacervate (diblock polyampholyte) models were recently generated using FTS-CL simulations,Reference Delaney and Fredrickson42 tracking the dimensionless concentration, C, more than six orders of magnitude. Figure 3 shows how the phase diagrams of blends of oppositely charged polyelectrolytes and diblock polyampholytes are remarkably similar. This is due, in part, to the pairing of oppositely charged polymers in the dilute phase at high electrostatic strength E = l B(σN)Reference Fredrickson2/R g, where l B is the Bjerrum length, which is the separation of two elementary charges resulting in an electrostatic energy equal to k BT (k B is the Boltzmann constant and T is temperature), and σ is the charge density on the chains. The solid curves are the predictions of a commonly invoked analytical theory known as the random phase approximation (RPA),Reference Borue and Erukhimovich36,Reference Delaney and Fredrickson42 which is seen to fail by orders of magnitude in predicting the dilute branches of the coexistence curves.
Phase diagram coexistence curves (binodals) computed with complex Langevin (CL, points), compared against the random phase approximation (RPA, lines) for an equimolar blend of equal length and equal and oppositely charged polymers in implicit solvent (red) and a symmetric diblock polyampholyte of double molecular weight (blue). CL and RPA are in surprisingly close agreement for the composition of the concentrated branch, but differ by orders of magnitude in the predicted concentrations of the dilute branch. Note: C, dimensionless (total) chain concentration; E, dimensionless electrostatic interaction strength; PE, symmetric polyelectrolyte blend; PA, symmetric diblock polyampholyte.Reference Delaney and Fredrickson42

Polymeric emulsions
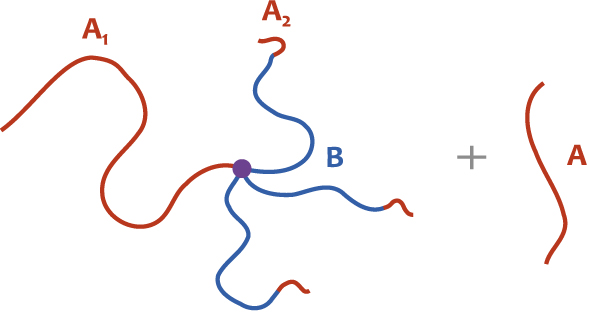
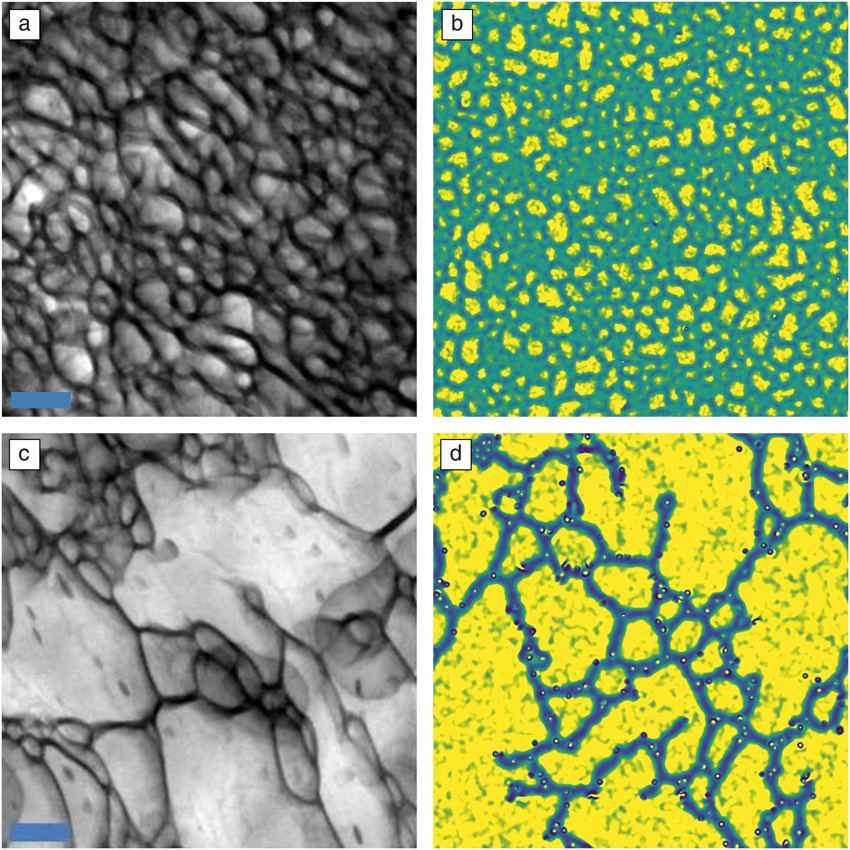
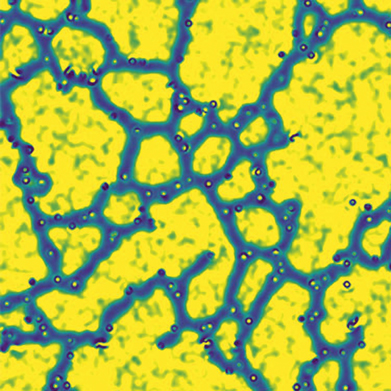
Polymer alloys are ubiquitous in plastic materials and can possess morphologies ranging from homogeneous single phase, to mesophases and complex emulsion structures.Reference Utracki, Weiss and Comstock45 Recent experimental workReference Shi, Hamilton, Delaney, Fredrickson, Kramer, Ntaras, Avgeropoulos, Lynd, Demassieux and Creton46 revealed a fascinating new aperiodic “bricks-and-mortar” (B&M) phase when blending homo-polystyrene (PS) with a “mikto-arm” star block copolymer, a star molecule with chemically different arms, having the architecture PS1-(PI-b-PS2)3 (Figure 4), where PI = polyisoprene and PS1 and PS2 denote PS blocks with an approximately 8:1 length ratio. The B&M phase is remarkable in that it is a cellular disordered phase with no long-range order that sustains the hard PS domains as discrete and soft PI domains as continuous at overall PS volume fractions exceeding 0.7 (Figure 5a). It is further unique in possessing a combination of high elastic modulus (up to 100 MPa), strength, and elastic recovery of greater than 90% out to strains exceeding 100%.Reference Shi, Hamilton, Delaney, Fredrickson, Kramer, Ntaras, Avgeropoulos, Lynd, Demassieux and Creton46 The B&M phase cannot be anticipated by mean-field theory; SCFT predicts either homogeneous disordered phases or a lamellar mesophase throughout its range of stability.Reference Liu, Delaney and Fredrickson47 A recent FTS-CL study, however, showed that the lamellar mesophase is largely destroyed by thermal fluctuations in such alloys and clarified that the structured B&M phase emerges continuously out of a structureless disordered phase upon cooling from high temperature. Figure 5b, d show simulation-derived B&M morphologies that are strikingly similar to the corresponding transmission electron microscope images of the experimental system (Figure 5a, c).Reference Liu, Delaney and Fredrickson47 The simulation cell size used in the FTS-CL simulations that produced Figure 5b exceeds 1.6 μm—likely a record for a molecular simulation of a complex polymer alloy.
Schematic illustration of the mikto-arm star block copolymer A1-(B-b-A2)3 in a binary blend with homopolymer A.

Bricks-and-mortar mesophase in a PS1-(PI-b-PS2)3 mikto-arm block copolymer/PS homopolymer (44 kg/mol) blends observed by (a, c) transmission electron microscope experimentsReference Shi, Hamilton, Delaney, Fredrickson, Kramer, Ntaras, Avgeropoulos, Lynd, Demassieux and Creton46 and (b, d) in complex Langevin simulationsReference Liu, Delaney and Fredrickson47 show remarkable structural similarity. (a) and (b) have a homopolymer volume fraction of 0.4, while (c) and (d) have a homopolymer volume fraction of 0.7. The discrete, bright domains are A-rich (PS-rich) for both experimental and simulation results. Scale bars for the experimental images = 200 nm. The sizes of the (b) and (d) images are 110 × 110 R g and 65.5 × 65.5 R g, respectively. R g is estimated to be approximately 15 nm for the experimental mikto-polymers. (a, c) Adapted with permission from Reference Shi, Hamilton, Delaney, Fredrickson, Kramer, Ntaras, Avgeropoulos, Lynd, Demassieux and CretonReference 46. © 2015 American Chemical Society. Note: PS, polystyrene, PI, polyisoprene; PS1, PS2, PS blocks with different molecular weights; R g, polymer radius of gyration.

Summary and outlook
By the previously discussed application examples, it is clear that field-theoretic simulations have matured to the stage where the technique is a viable alternative to standard particle-based simulation approaches to soft materials. FTS simulations are most advantageous in dense, high molecular weight soft material systems where there is a large separation between the local liquid structure on the 1-nm monomer scale and larger mesoscopic structures, and correlations on 10-nm to 1-μm scales. In such cases, the local structure is modeled crudely (e.g., by soft core potentials or a local harmonic compressibility penalty), and the field degrees of freedom are concentrated on resolving the larger scales that dictate structure and thermodynamics.
While all application work to date has been focused on the AF representation of polymer field theory, we expect that the competing CS representation will become increasingly important as more computationally efficient simulation algorithms become available. Driving this development is the simplicity and semi-local character of the CS Hamiltonian, which should aid the development of systematic multiscale coarse-graining tools for computational field theory, but also the description and simulation of complex systems for which the CS representation is more natural or efficient. An example is supramolecular polymers,Reference Brunsveld, Folmer, Meijer and Sijbesma48 wherein reversible bonds link dissimilar polymers into heterogeneous networks that can exhibit rich combinations of macrophase separation, microphase separation, and gelation phenomena, as well as complex dynamic and self-healing behaviors. In such systems, chemical bonding equilibrium and self-assembly/phase behavior are inextricably linked. A particular challenge is the need to enumerate all possible polymer and network topologies that can result from various bonding motifs; this is problematic in the AF representation,Reference Mester, Mohan and Fredrickson49 but much more natural in the CS framework. We plan to report on such developments in the near future.
Finally, computationally efficient nonequilibrium extensions of the formalism have yet to be identified within a purely field-theoretic representation. In the short term, hybrid schemes that involve both particles and fields would seem most likely to succeed in capturing the complexities of polymer entanglement on single and collective chain dynamics, while advancing microstructure and flow efficiently using fields.
Acknowledgments
The authors gratefully acknowledge support from the CMMT Program of the National Science Foundation (NSF) under Award No. DMR-1506008. Computational resources were provided by the California Nanosystems Institute (CNSI) and Materials Research Laboratory (MRL) at the University of California, Santa Barbara. The CNSI-MRL Computational Facilities are supported by the Materials Research Science and Engineering Centers Program of the NSF under Award No. DMR-1720256, a member of the NSF-funded Materials Research Facilities Network (www.mrfn.org).

Glenn H. Fredrickson is director of the Mitsubishi Chemical Center for Advanced Materials and Distinguished Professor of Chemical Engineering and Materials at the University of California, Santa Barbara (UCSB). He received his BS and PhD degrees in chemical engineering from the University of Florida and Stanford University, respectively. He joined AT&T Bell Labs in 1984, was a distinguished member of the technical staff, and moved to UCSB in 1990. He is a recipient of the Polymer Physics Prize and Dillon Medal of the American Physical Society, the Walker and Alpha Chi Sigma Awards of the American Institute of Chemical Engineers, and was elected to the US National Academy of Engineering and the American Academy of Arts & Sciences. His research interests include polymer and soft materials theory and scientific computation. Fredrickson can be reached by email at ghf@mrl.ucsb.edu.

Kris T. Delaney is an associate project scientist in the Materials Research Laboratory of the University of California, Santa Barbara (UCSB). He received his MPhys and PhD degrees in theoretical physics and physics, respectively, from the University of York, UK. After completing postdoctoral research in physics at the University of Illinois at Urbana-Champaign, he joined the Materials Research Laboratory at UCSB in 2006. His research interests include polymer physics, quantum many-body theory, magnetism, and high-performance computing. Delaney can be reached by email at kdelaney@mrl.ucsb.edu.