INTRODUCTION
Otoliths are crystalline structures of calcium carbonate (CaCO3) located in pairs inside the inner ear of teleost fish that are responsible for balance maintenance in the water column and for hearing (Platt & Popper, Reference Platt, Popper, Tavolga, Popper and Fay1981). These biominerals grow via deposition of CaCO3, becoming a crystalline structure of vaterite, calcite or aragonite, and the latter polymorph is the most common (Campana, Reference Campana1999; Béarez et al., Reference Béarez, Carlier, Lorand and Parodi2005). During the biomineralization process of these polymorphs of CaCO3 the manganese (Mn2+) ion can be incorporated as a substitution impurity at calcium (Ca2+) sites (Angus et al., Reference Angus, Raynor and Robson1979), and other trace elements, such as strontium and barium, can aggregate into the mineral matrix (Campana, Reference Campana1999).
Teleost fish have three pairs of otoliths—sagitta, asterisci and lapilli. In general, the pairs of sagitta are the largest and can be used in taxonomy studies due to their species-specific features (Di Beneditto et al., Reference Di Beneditto, Ramos and Lima2001); original size estimates due to their relation with the fish's length and weight (Di Beneditto & Lima, Reference Di Beneditto and Lima2003; Di Beneditto & Ramos, Reference Di Beneditto and Ramos2004) and fishery stocks discrimination (Monteiro et al., Reference Monteiro, Di Beneditto, Guilhermo and Rivera2005; Tracey et al., Reference Tracey, Lyle and Duhamel2006; Gonzalez-Salas & Lenfant, Reference Gonzalez-Salas and Lenfant2007). Previous studies related to inter-species variations in otolith chemistry showed that incorporation of trace elements into this hard structure, including manganese, is highly species-specific (Dove et al., Reference Dove, Gillanders and Kingsford1996; Geffen et al., Reference Geffen, Jarvis, Thorpe, Leah and Nash2003; Gillanders & Kingford, Reference Gillanders and Kingsford2003; Swearer et al., Reference Swearer, Forrester, Steele, Brooks and Lea2003; Hamer & Jenkins, Reference Hamer and Jenkins2007). The shape and size of sagitta can be influenced by environmental characteristics such as depth, type of substrate, water temperature, salinity and availability of food/nutrients (Lombarte et al., Reference Lombarte, Torres and Morales-Nin2003; Volpedo & Echeverria, Reference Volpedo and Echeverria2003; Cardinale et al., Reference Cardinale, Doering-Arjes, Kastowsky and Mosegaard2004; Oliveira et al., Reference Oliveira, Di Beneditto and Monteiro2009). Moreover, the chemical composition of otoliths can be influenced by both environmental and physiological factors (growth rate, stress, reproductive status) (Campana, Reference Campana1999), and the trace element concentration in these structures has been widely studied to assess fish stocks (e.g. Swearer et al., Reference Swearer, Forrester, Steele, Brooks and Lea2003; Brown, Reference Brown2006; Hamer & Jenkins, Reference Hamer and Jenkins2007; Wang et al., Reference Wang, Lin, Shiao, You and Tzeng2009; Ranaldi & Gagnon, Reference Ranaldi and Gagnon2010).
Sciaenidae is a family of teleost fish very common worldwide, comprising around 280 species known as drums or croakers. They are bottom-dwelling carnivores, feeding on benthic invertebrates and small fish, found mainly in coastal marine waters associated with muddy or sandy bottoms. However, there are estuarine and freshwater species, and even those that live in both marine and estuarine environments (Froese & Pauly, Reference Froese and Pauly2011). In Brazilian waters, these fish are important as fisheries resources (Geo Brasil, Reference Geo2002) and components of coastal food webs (Di Beneditto & Ramos, Reference Di Beneditto and Ramos2004; Bittar & Di Beneditto, Reference Bittar and Di Beneditto2009; Di Beneditto et al., Reference Di Beneditto, Souza, Kehrig and Rezende2011). This family has large sagitta otoliths, and the species are known for sound production (Luczkovich et al., Reference Luczkovich, Sprague, Johnson and Pullinger1999). Therefore, the otoliths are structures that allow investigation on ontogenetic, inter-species and geographic differences among these fish species (Monteiro et al., Reference Monteiro, Di Beneditto, Guilhermo and Rivera2005; Oliveira et al., Reference Oliveira, Di Beneditto and Monteiro2009).
The electron paramagnetic resonance (EPR), a sensitive spectroscopic technique, should be appropriate to investigate otoliths because it detects non-paired electrons like manganese (Mn2+), a transition metal ion (Abragam & Bleaney, Reference Abragam and Bleaney1970). It is a non-destructive technique that preserves the otolith integrity and can be used when the available samples are limited, as in the case of scientific collections. However, only paramagnetic species of chemical elements can be studied by this technique (Abragam & Bleaney, Reference Abragam and Bleaney1970).
The structure of the EPR spectrum of Mn2+ is related to the chemical and physical properties of CaCO3, indicating EPR as a potential technique for probing the crystallization conditions (Montegrossi et al., Reference Montegrossi, Di Benedetto, Minissale, Paladini, Pardi, Romanelli and Romei2006). In polymorphs of CaCO3, the Mn2+ is coordinated by oxygen atoms. The position and distance of oxygen atoms around the Mn2+ define the shape of spectrum, so that each polymorph of CaCO3 has different Mn2+ spectrum. An EPR line has a shape of the first derivate of an absorption line. The double integration of an EPR line corresponds to the spectrum area, which is directly proportional to the concentration of paramagnetic species detected. So, this technique can also be used in a quantitative analysis of the paramagnetic elements present in a given structure up to a limit of 10−9 M (Eaton et al., Reference Eaton, Eaton, Barr and Weber2010).
In this study, the EPR spectroscopy is applied for the first time to analyse the sagitta otolith of fish species and to describe its biocrystallization process. We raise the hypotheses that the presence of Mn2+ in the sagitta otolith of Sciaenidae fish species in northern Rio de Janeiro State, south-eastern Brazil, can be species-specific, and that Sciaenidae fish stocks under different environmental influences (salinity and temperature) probably present different Mn2+concentrations in their otoliths.
MATERIALS AND METHODS
Sampling
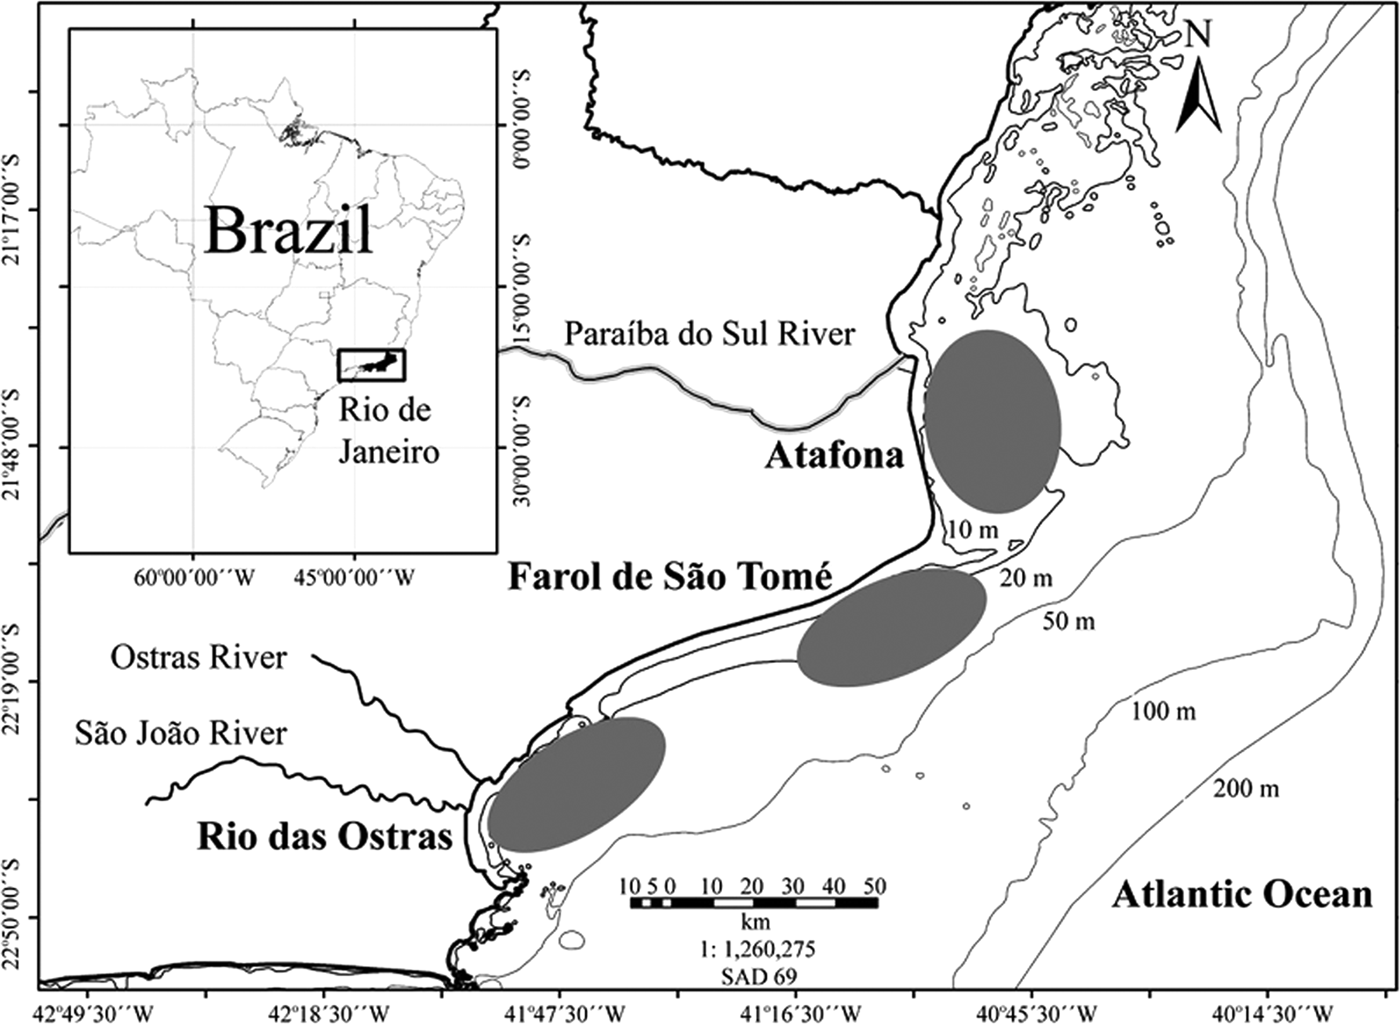
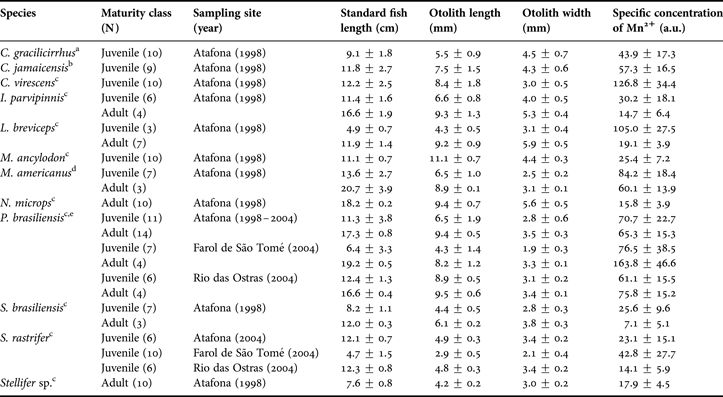
Twelve species of Sciaenidae fish: bardel drum Ctenosciaena gracilicirrhus Metzelaar 1919; Jamaica weakfish Cynoscion jamaicensis Vaillant & Bocourt, 1883; green weakfish Cynoscion virescens Cuvier, 1830; bigtooth corvina Isopisthus parvipinnis Cuvier, 1830; shorthead drum Larimus breviceps Cuvier, 1830; king weakfish Macrodon ancylodon Bloch & Schneider, 1801; southern kingcroaker Menticirrhus americanus L., 1758; smalleye croaker Nebris microps Cuvier, 1830; Paralonchurus brasiliensis Steindachner, 1875; Brazilian stardrum Stellifer brasiliensis Schultz, 1945; S. rastrifer Jordan, 1889 and Stellifer sp. were obtained in 1998 and 2004 by local fishermen through the artisanal fisheries with bottom trawl nets (Table 1). The analysed specimens were taken in three sampling sites in northern Rio de Janeiro State, south-eastern Brazil: Atafona (21°35′S), Farol de São Tomé (22°05′S) and Rio das Ostras (22°30′S) (Table 1; Figure 1). The study area comprised waters from less than one to 20 nautical miles (around 1.5–36.6 km) from shore and depths varying from 10 m to 30 m (Figure 1).
Map of Brazil, indicating the Rio de Janeiro State and its northern coast, where the sampling sites (Atafona, Farol de São Tomé and Rio das Ostras) are located (grey ellipses).

Sample size characteristics: maturity class, sampling site and year, standard fish length (cm), otolith length and width (mm) and specific concentration of Mn2+ (a.u.) of Sciaenidae fish from northern Rio de Janeiro State, Brazil (mean ± standard deviation).
References about size at first maturity to separate the Sciaenidae fish specimens as juvenile or adult: a, Vianna et al. (Reference Vianna, Costa and Ferreira2004); b, Márcano et al. (Reference Márcano, Alió and Altuve2002); c, Menezes & Figueiredo (1980); d, Braun & Fontoura (Reference Braun and Fontoura2004); e, Robert et al. (Reference Robert, Michels-Souza and Chaves2007); a.u., arbitrary units.
After sampling, each fish was measured (standard length in 0.1 cm). The sagitta otoliths were extracted, cleaned of adhering tissue, rinsed in flowing water and dried at room temperature. Otoliths (left and right) were measured using a stereomicroscope with an ocular micrometer (in 0.1 mm) and weighed (in 0.0001 g). The otolith length was the distance between the anterior and posterior edges of the otolith; the width was the longest distance between the dorsal and ventral edges of the otolith, perpendicular to its length. These samples belong to the otoliths reference collection from Laboratório de Ciências Ambientais, Universidade Estadual do Norte Fluminense. The fish were categorized as juveniles or adults according to length, considering the approximate size at first maturity (Table 1).
The sampling sites are relatively close, but they are under distinct environmental influences. At Atafona, the Paraíba do Sul River, is the main river run-off for south-eastern Brazil, with a mean freshwater discharge of 796 m3s−1 (Nicolite et al., Reference Nicolite, Truccolo, Schettini and Carvalho2009). At Farol de São Tome there is no freshwater influence, but the effects of the Central Water of South Atlantic (CWSA) up-welling are present, especially during spring–summer months (December to March), when the coastal waters become colder (less than 20°C) and the salinity increases (more than 35) (Valentin & Monteiro-Ribas, Reference Valentin and Monteiro-Ribas1993). At Rio das Ostras there is influence of two rivers, Ostras and São João, whose discharges are smaller compared to the Paraíba do Sul River (around 0.12 m3s−1 and 3.03 m3s−1, respectively) (Muehe & Valentini, Reference Muehe and Valentini1998) (Figure 1).
EPR measurements
Electron paramagnetic resonance spectra of whole sagitta otoliths were obtained using a Bruker E500 spectrometer with a high sensitive cylindrical cavity, operating at X-band (9 GHz) at room temperature (300 K). The samples were previously cleaned with pure acetone. The following experimental settings were used: central magnetic field 360 mT; sweep width 120 mT; microwave power 20 mW; modulation frequency 100 kHz; modulation amplitude 0.5 mT; receiver gain 66 dB; sweep time 180 s; time constant 20.48 ms; number of scans 1.
The areas of Mn2+ EPR spectra, in arbitrary units (a.u.), were obtained by double integration of the set of six lines. This intensity is directly proportional to the number of spins in resonance and therefore, directly proportional to the concentration of the paramagnetic species. To all fish specimens, the manganese concentration was normalized by otolith mass, and this parameter was named specific concentration of Mn2+ (ratio: area of Mn2+ spectrum (a.u.)/otolith mass (g). This parameter is the amount of Mn2+ per otolith, independent of the otolith dimension (size and weight).
X-ray measurements
The CaCO3 can precipitate to form otoliths in two major forms: aragonite and vaterite. The vateritic otoliths contain a central region, and even sometimes a considerable portion of the otolith, which is in turn surrounded by an aragonite phase, the large proportion of the organics (Campana, Reference Campana1999). Regarding Sciaenidae fish, the vaterite is usually observed in anomalous otoliths (Béarez et al., Reference Béarez, Carlier, Lorand and Parodi2005). Another polymorphic CaCO3 phase likely to be found in nature is calcite, the most stable at ambient conditions.
The X-ray diffraction was used to prove the phase identification of crystalline materials in the studied otoliths, since only via this technique is it possible to be sure of the crystal structure itself. This technique, applied on one otolith of each examined species, was useful to validate the identification of the crystalline structure done via EPR. The investigated samples had their X-ray diffraction patterns analysed by using the Rietvel s powder diffraction profile-fitting method (Pecharsky & Zavalij, Reference Pecharsky and Zavalij2009) to determine the crystalline structural parameters, and thus the crystal phase present. The X-ray diffraction patterns were collected by a Bruker diffractometer, model D8 Advanced, with parallel beam geometry generated by Göbel Mirrors, using Cu Kα (λ = 1.5406 Å) at 40 kV and 40 mA. The scanning step of 0.009°/s from 20° < 2θ < 90° was used. Before each measurement the samples were powdered in a mortar with pestle and shifted in a 38 µm sieve.
Data analysis
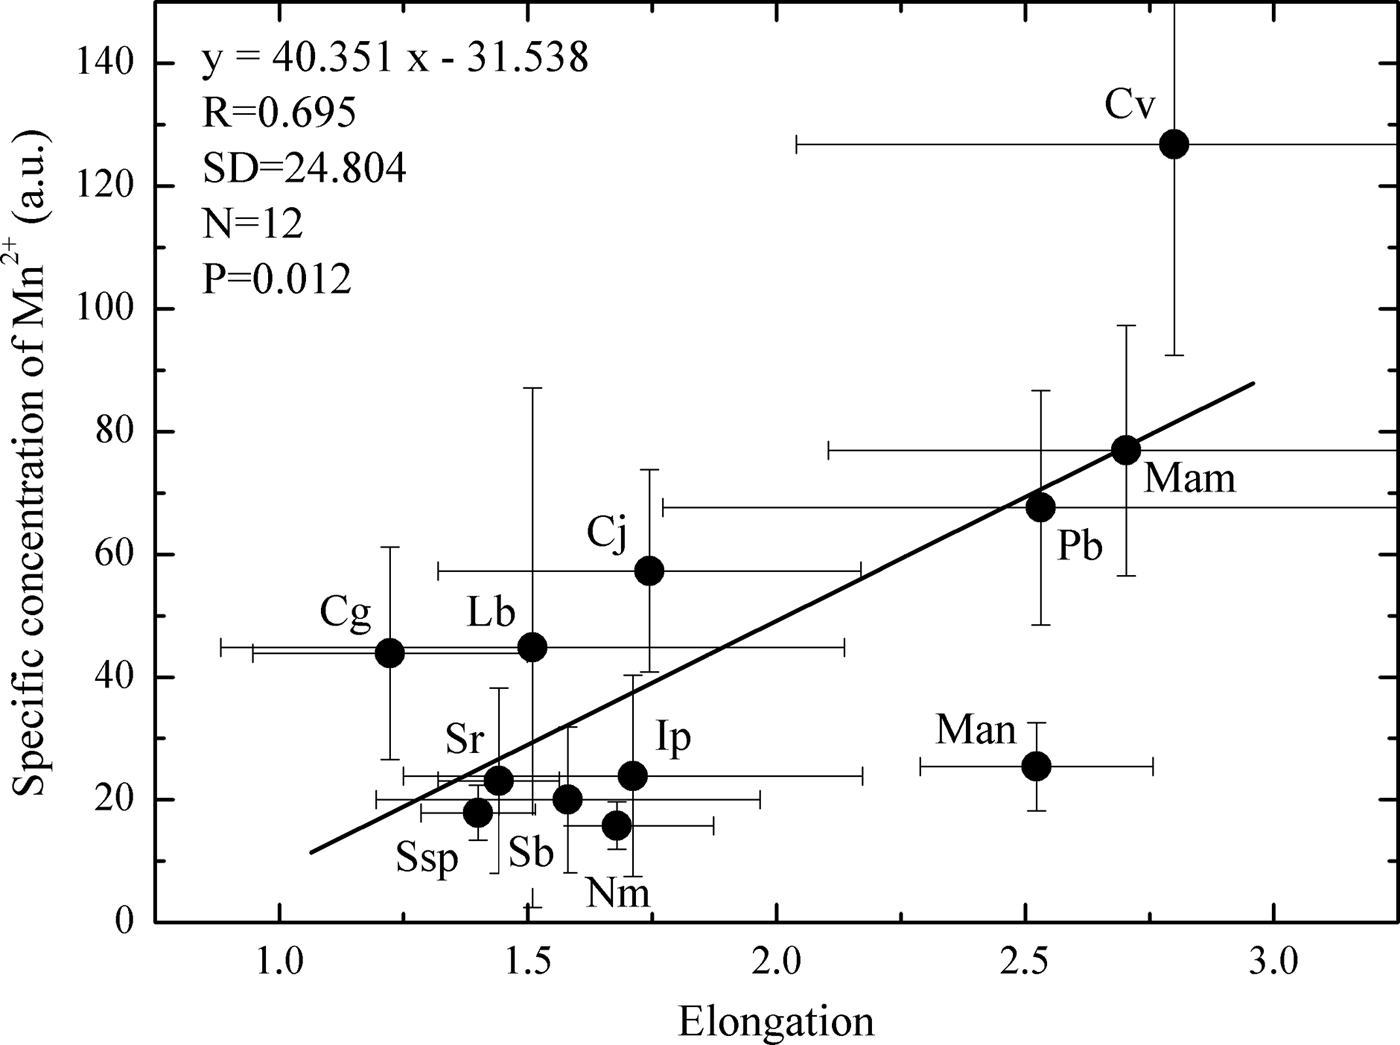
Pearson product-moment correlation was applied to verify the relation between specific concentration of Mn2+ (a.u.) and otolith shape, here referred as ‘elongation’ (ratio: length/width), considering the 12 Sciaenidae fish species collected from the Atafona sampling site, to check if there is an interspecific pattern regarding this trace element bioaccumulation. The analysis of variance (ANOVA), followed by a post hoc Tukey HSD test, was conducted to test possible geographic differences among the three sampling sites (Atafona, Farol de São Tomé and Rio das Ostras) where the species P. brasiliensis and S. rastrifer were collected. The statistical analysis used Statistica 7.0 for Windows (StatSoft, Inc 1984–2004, USA); a P value ≤ 0.05 indicated statistical significance.
RESULTS
Preliminary spectra were obtained in the left and right otoliths of some fish specimens to verify the differences between the sides. Preliminary spectra of Paralonchurus brasiliensis sampled at Atafona in 1998 and 2004 were also conducted to verify temporal variations in manganese presence. As the left and right otoliths produced similar spectra, the left otolith of each fish specimen was selected for the EPR analysis. The sampling years were gathered to the data analysis.
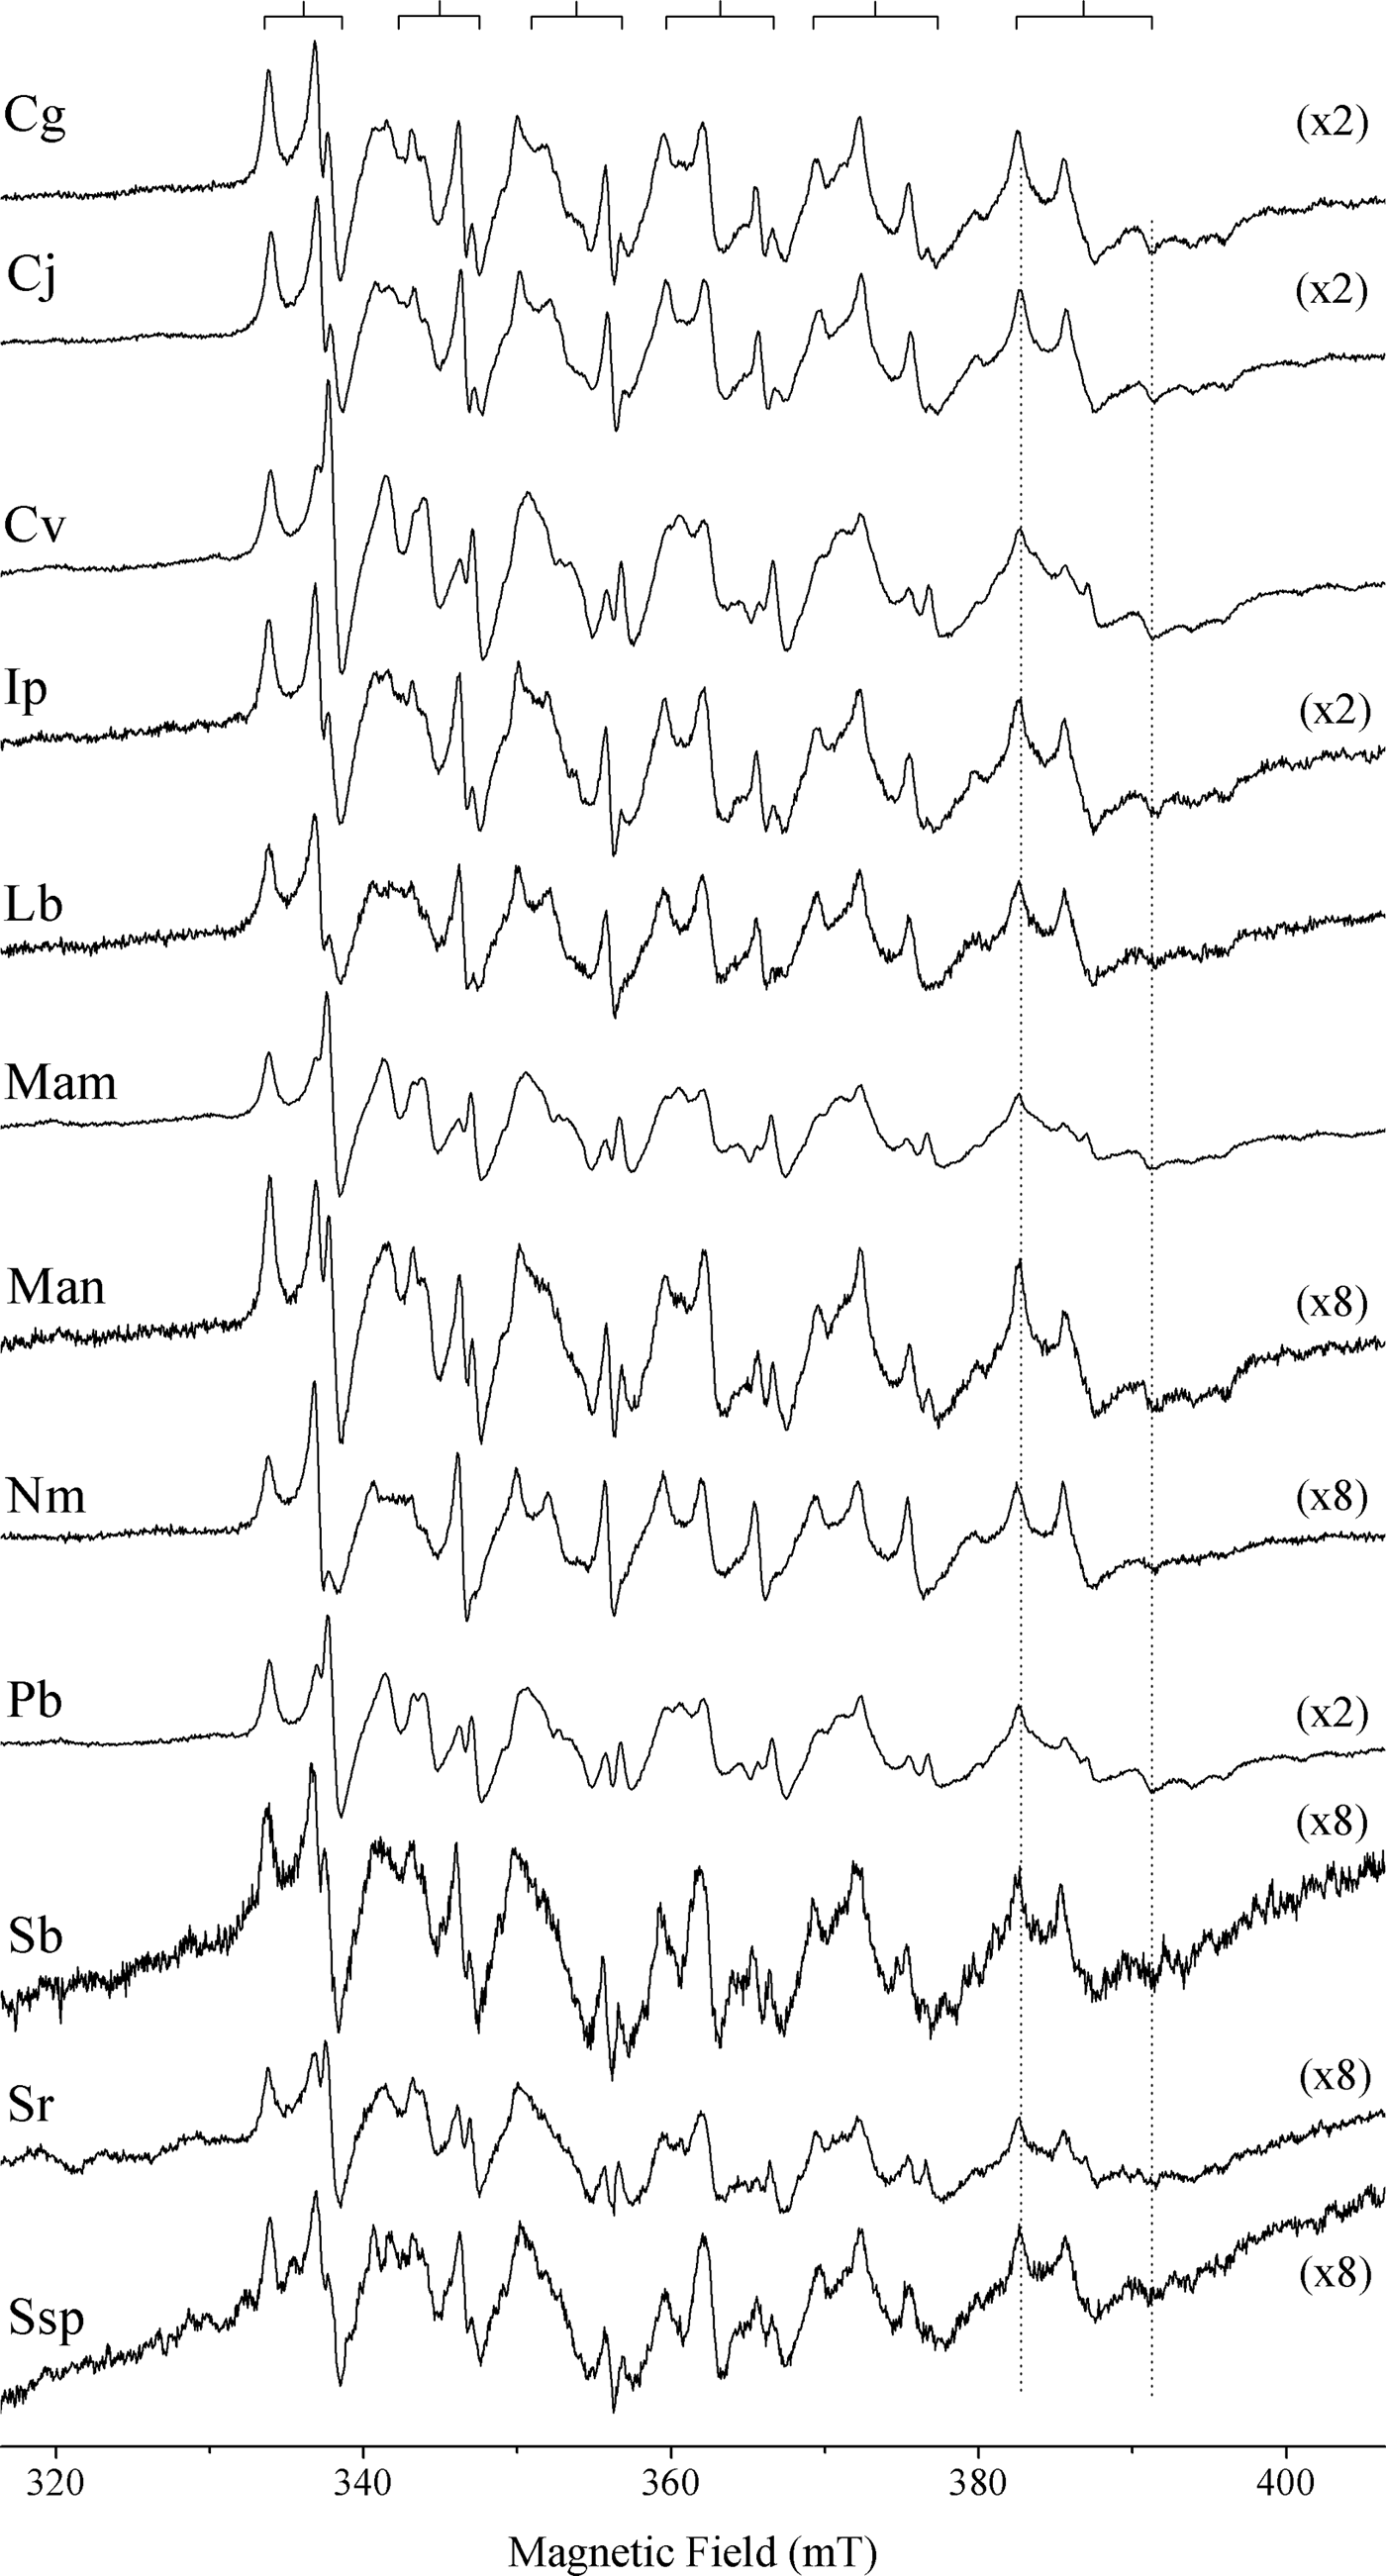
All otoliths spectra of Sciaenidae species were similar, regardless of species, stage of development and environmental conditions, characterized by a sextet typical of the Mn2+ hyperfine structure, which is the interaction between the electronic spin and the nuclear spin I = 5/2 of the Mn, resulting in (2*I + 1) lines (2*5/2 + 1 = 6) in the spectrum. In Figure 2 are shown the spectra of the Sciaenidae species collected from Atafona sampling site, exemplifying this similarity. EPR spectra are typical of Mn2+ in aragonite powder, associated with an occupation of Ca2+ site with nine nearest neighbour oxygen atoms (Angus et al., Reference Angus, Raynor and Robson1979). The lines of the sextet are not equally spaced, as can be seen at the top of Figure 2. The separation of hyperfine lines increases from the low field (330–340 mT) towards the high field (380–390 mT) side of the spectrum, and the line width also increases with the magnetic field.
Electron paramagnetic resonance spectra of Sciaenidae fish otoliths from the Atafona sampling site: Cg, Ctenosciaena gracilicirrhus; Cj, Cynoscion jamaicensis; Cv, Cynoscion virescens; Ip, Isopisthus parvipinnis; Lb, Larimus breviceps; Mam, Menticirrhus americanus; Man, Macrodon ancylodon; Nm, Nebris microps; Pb, Paralonchurus brasiliensis; Sb, Stellifer brasiliensis; Sr, Stellifer rastrifer; Ssp, Stellifer sp. The numbers in parentheses represent the magnification factors on axis intensity. The splitting of dotted vertical lines is correlated to zero field splitting of Mn2+ in the aragonite structure.
The EPR spectra of transition metal ions with electronic spin S > 1/2, like Mn2+ (S = 5/2), generally effects zero field splitting (ZFS). This additional interaction originates from both strong dipole–dipole and spin–orbit coupling between the electron spins and their orbital angular momentum. The ZFS causes a splitting of the electronic energy states even in the absence of an external magnetic field. This effect can be observed as the distortion of the lines of the Mn2+ sextet, especially in the last line (higher magnetic field), which can be used to obtain the ZFS parameter D, as proposed by Montegrossi et al. (Reference Montegrossi, Di Benedetto, Minissale, Paladini, Pardi, Romanelli and Romei2006). This distortion is indicated in Figure 2 by distance (in miliTesla) of the two dotted vertical lines, and shows that all specimens have the same parameter D, estimated in 22.4 mT.
The average values of specific concentration of Mn2+ (a.u.) were correlated with otolith shape (elongation), and a positive and significant correlation (Pearson product-moment correlation: r = 0.695, N = 12, P = 0.01) was verified (Figure 3). In general, in Sciaenidae fish species whose otolith is elongated (length is more than two times greater in relation to its width), such as Cynoscion virescens, Macrodon ancylodon, Menticirrhus americanus and P. brasiliensis, the concentration of Mn2+ is higher (Figure 3; Table 1).
Relationship between specific concentration of Mn2+ and otolith elongation in Sciaenidae fish from the Atafona sampling site: Cg, Ctenosciaena gracilicirrhus; Cj, Cynoscion jamaicensis; Cv, Cynoscion virescens; Ip, Isopisthus parvipinnis; Lb, Larimus breviceps; Mam, Menticirrhus americanus; Man, Macrodon ancylodon; Nm, Nebris microps; Pb, Paralonchurus brasiliensis; Sb, Stellifer brasiliensis; Sr, Stellifer rastrifer; cg, Chenosciaene; Ssp, Stellifer sp.
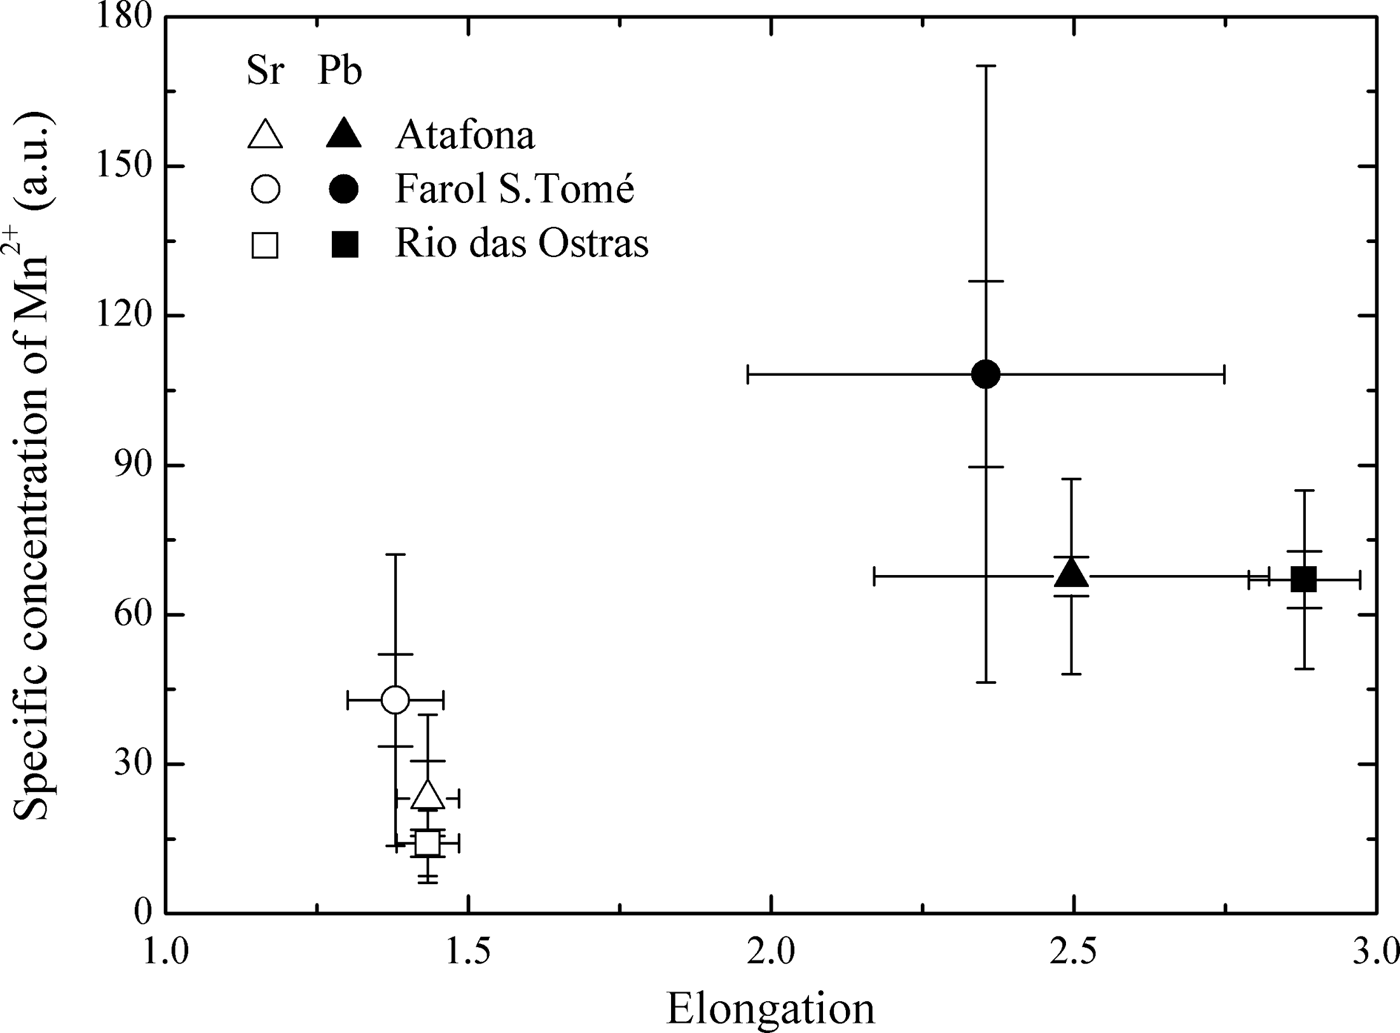
Comparisons among the three sampling sites (Atafona, Farol de São Tomé and Rio das Ostras) of the specific concentration of Mn2+ (a.u.) in otoliths of Stellifer rastrifer and P. brasiliensis showed significant differences for both species (S. rastrifer ANOVA: df treatment = 2, df residual = 18, F3.39, P = 0.05 and P. brasiliensis ANOVA: df treatment = 2, df residual = 43, F5.94, P = 0.01). The specific concentration of Mn2+ regarding the otoliths from Farol de São Tomé was significantly higher (P > 0.05) than Atafona and Rio das Ostras (Figure 4).
Relationship between specific concentration of Mn2+ and otolith elongation in Stellifer rastrifer (Sr, empty signals) and Paralonchurus brasiliensis (Pb, covered signals) otoliths from Atafona (triangles), Farol de São Tomé (circles) and Rio das Ostras (squares) sampling sites. The percentile corresponds to 95%.
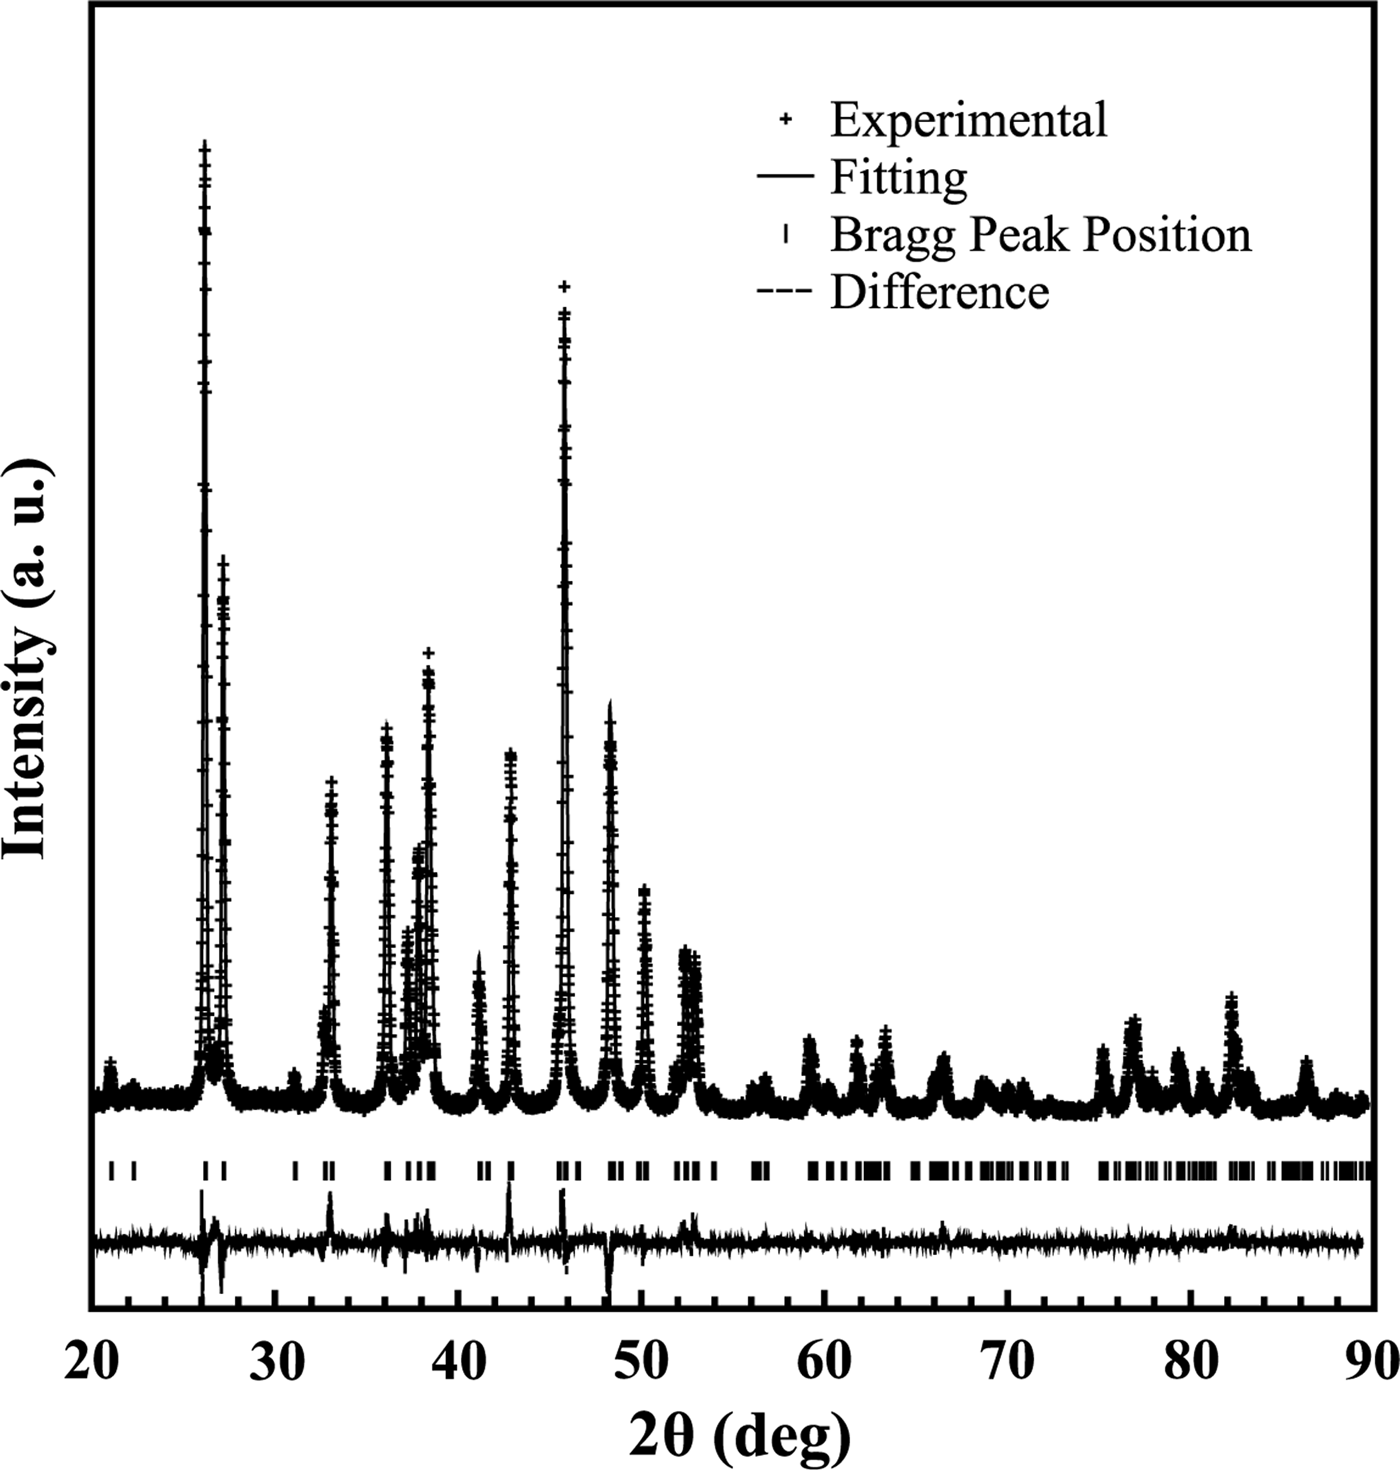
The three possible crystal structures that could be presented in the Sciaenidae fish sagitta otolith (calcite, aragonite and vaterite) were tested when performing Rietveld's refinement. The best match was only obtained by choosing the orthorhombic crystal structure (space group Pmnc) that corresponds to aragonite phase (see Dal Negro & Ungaretti, Reference Dal Negro and Ungaretti1971). The lattice parameters were a = 4.9652(2) Å, b = 7.9722(3) Å, c = 5.7514(2) Å.
In Figure 5, the refined diffraction powder pattern is shown for a S. rastrifer sample from Farol de São Tomé. As can be noted, the calculated X-ray profile had a good agreement with experimental data. The figure of merit used to characterize the Rietveld refinement had good reliability. Similar results were recorded for all species (and specimens) investigated in this study, which is within the expected margin of error (less than 1%). Therefore, calcite and vaterite phases are not present in our samples.
The X-ray diffraction pattern collected using Cu Kα for a Stellifer rastrifer sample from Farol de São Tomé. The black crosses represent the experimental data, and the solid line the calculated pattern. The vertical bars set indicate the calculated Bragg peak positions. The line at the bottom shows the difference between the observed and calculated profiles.
DISCUSSION
For the first time, the biocrystallization process and the presence of manganese in the sagitta otoliths of teleost fish have been described via the EPR spectroscopy technique. The spectra of Mn2+ in the otoliths of the 12 Sciaenidae species have the typical shape of this ion presence in the crystalline structure of aragonite. It has been established in the literature that the otolith core is constituted by calcite, which is covered by aragonite during fish growth (Campana, Reference Campana1999; Brophy et al., Reference Brophy, Jeffries and Danilowicz2004). However, Melancon et al. (Reference Melancon, Fryer, Gagnon and Ludsin2008) ruled out this statement, showing through a mineralogical approach that the strong manganese enrichment in the primordia within the core could be associated with the large amount of organic matrix present at the beginning of aragonite biomineralization, or perhaps the initial formation of a separate mineral phase in the primordia, with no relation to a calcite precursor. The EPR spectra were obtained from intact otoliths and the core portion was not considered separately, so a predominance of Mn2+ signs in the aragonite was expected in the samples. In fact, X-ray diffraction validated the EPR results, indicating that the unique phase present in the otoliths samples is aragonite.
Similar shape and zero-field splitting D equal to 22.4 mT was recorded in EPR spectra of all studied fish. This indicates that the growth of the otoliths is related to the same biocrystallization process, resulting in the same local order in the crystal structure of aragonite occupied by Mn2+ in the Ca2+ site. Parameter D is associated with changes in axial distortion in the crystal lattice. The value of this parameter (22.4 mT) is consistent with the values described in the literature for aragonite biomineral (shells), 12.53–25.0 mT, (White et al., Reference White, Szab, Carkne and Chastee1977; Raju et al., Reference Raju, Narasimhulu, Gopal, Rao and Reddy2002) and aragonite synthetic and mineral, 23.2–25.0 mT (Angus et al., Reference Angus, Raynor and Robson1979; Slezak et al., Reference Slezak, Lech and Bojko1979). However, these values are higher than those obtained in calcites, 8.1–10.6 mT (Angus et al., Reference Angus, Raynor and Robson1979; Montegrossi et al., Reference Montegrossi, Di Benedetto, Minissale, Paladini, Pardi, Romanelli and Romei2006; Vongsavat et al., Reference Vongsavat, Winotai and Meejoo2006; Angiolillo & Graneto, Reference Angiolillo and Graneto2008), because the incorporation of Mn2+ in aragonite is related to a greater distortion of the axial site of Ca2+, resulting in lower symmetry of this site and causing the split of each line of the sextet of Mn2+ into three (Angus et al., Reference Angus, Raynor and Robson1979).
Inter-species differences were detected in the concentration of Mn2+ among the 12 Sciaenidae species collected at the Atafona sampling site, regardless if co-occurring species were being exposed to the same environmental conditions (see Material and Methods above) and similar dietary habits (Froese & Pauly, Reference Froese and Pauly2011). This corroborates the hypothesis raised in the present study, and it is in accordance with previous studies conducted in other regions (Dove et al., Reference Dove, Gillanders and Kingsford1996; Geffen et al., Reference Geffen, Jarvis, Thorpe, Leah and Nash2003; Gillanders & Kingford, Reference Gillanders and Kingsford2003; Swearer et al., Reference Swearer, Forrester, Steele, Brooks and Lea2003; Hamer & Jenkins, Reference Hamer and Jenkins2007). Once more, the results pointed out that a specific otolith shape is influencing the trace element concentration; the elongated otoliths have higher manganese concentrations compared to rounded otoliths (Figure 3).
Otolith chemistry is considered to be significantly influenced by water chemistry and oceanography conditions (temperature and salinity) in which the fish is found, which influence trace element assimilation via gills and blood (Campana, Reference Campana1999). Trace elements in sediment could potentially enter fish eggs placed on the bottom and be incorporated into otolith cores (Hori & Iwasaki, Reference Hori and Iwasaki1976). However, there is still no consensus about this matter. In relation to manganese, for example, some authors argued that the relationship between water chemistry or oceanography parameters and its incorporation into otoliths is still unclear (Elsdon & Gillanders, Reference Elsdon and Gillanders2003; Hamer & Jenkins, Reference Hamer and Jenkins2007), while Arai & Hirata (Reference Araia and Hirata2006) demonstrated the high potential of this element in distinguishing fish habitats. Brophy et al. (Reference Brophy, Jeffries and Danilowicz2004) verified that otoliths from both pelagic and demersally spawning fish species can contain elevated manganese concentrations, and their results do not support the assumption that elevated concentrations of this element at the otolith originate from the substrate on which the eggs are incubated.
There is also the assumption that fish can accumulate trace elements through their food items (Limburg, Reference Limburg1995), which was confirmed for manganese by Sanchez-Jerez et al. (Reference Sanchez-Jerez, Gillanders and Kingsford2002) in relation to a tropical estuarine fish. So, consuming different prey with different element concentrations could influence their accumulation in soft tissues and hard structures, such as otoliths. Additionally, it is likely that inter-species variation in physiological regulatory processes will have an important role in explaining the differences in manganese incorporation between fish species (Geffen et al., Reference Geffen, Jarvis, Thorpe, Leah and Nash2003; Hamer & Jenkins, Reference Hamer and Jenkins2007).
The inter-species analysis considered species that inhabit the same environment and have similar feeding preferences. In this sense, these factors might not influence the manganese bioaccumulation in their otoliths. Metabolic rate differences related to otolith accretion controlled by physiological processes seem to be a plausible explanation for the different concentrations of Mn2+ among the studied Sciaenidae species.
Geographic variation among the three stocks of Paralonchurus brasiliensis and Stellifer rastrifer from northern Rio de Janeiro State was detected by EPR spectra of Mn2+, showing a consistent pattern for both species. The specific concentrations of Mn2+ (a.u.) in the otoliths from Farol de São Tomé were higher than other areas (Figure 4). In this region there is absence of freshwater discharges and the marine influence is remarkable, with high salinity and low water temperature. The concentration of manganese is relatively high in river water compared to seawater (Broecker & Peng, Reference Broecker and Peng1982). Then, one would expect that the fish otoliths collected near the Paraíba do Sul River's discharge had higher concentrations of this element. However, as mentioned above, the relationships between environmental conditions and otoliths chemistry are variable. Although our hypothesis has been confirmed, as the manganese concentration in water mass was not measured, we cannot make more inferences about it.
Oliveira (Reference Oliveira2008) and Oliveira et al. (Reference Oliveira, Di Beneditto and Monteiro2009) analysed the same samples of sagitta otoliths of P. brasiliensis and S. rastrifer to investigate differences in shape through morphometric analysis. Their results showed significant differences, which were explained by the presence of São Tomé Cape (22°00′S), which could possible form a natural barrier to fishes' movement, and by environmental differences among the sampling sites (water temperature, food/nutrients available). Considering the shape differences for both fish, the otoliths from Farol de São Tome differed from those from Atafona and Rio das Ostras, with higher allometric coefficients. The shape differences may be related to manganese accretion rates in the otolith margin or sulcus. In this case, the specific concentrations of Mn2+ (a.u.) determinated by the EPR analysis can be used as a tag for these fish stocks.
Electron paramagnetic resonance spectroscopy is a new tool for understanding the biocrystallization process in Sciaenidae fish otoliths. Further analyses should include other fish families to extend the comparisons and to better understand the process as a whole. This approach is a non-destructive technique that can be useful when the available samples are limited or cannot be damaged, as in the case of otoliths from scientific collections.
ACKNOWLEDGEMENTS
We thank the fishermen from Atafona, Farol de São Tomé and Rio das Ostras harbours who provided us with the Sciaenidae specimens, and the COMCAP (Complexo de Centrais de Apoio à Pesquisa) from Universidade Estadual de Maringá for the X-ray diffraction facility.
FINANCIAL SUPPORT
This study was supported by Conselho Nacional de Desenvolvimento Científico e Tecnológico—CNPq (grant no. 300241/09-7) and Fundação Carlos Chagas Filho de Amparo à Pesquisa do Estado do Rio de Janeiro—FAPERJ (grant no. E-26/102.915/2011). The EPR spectrometer was supported by FAPERJ (grant no. E-26/112.219/2008). A.P.M. Di Beneditto is a member of CNPq INCT Material Transference from the Continent to the Ocean (grant no. 573601/08-9).