

Introduction
The main focus of this article is on the interactive effect of a team’s knowledge diversity and network density on the emergence of high team innovativeness (hereafter referred to as team innovation). To explore this effect, we employ a machine-learning inductive method to depict their curvilinearFootnote 1 interactive relationship. Specifically, these factors sometimes positively and sometimes negatively moderate each other’s impact on team innovation.
In this study, we seek to address our research interest from the perspective of ‘knowledge networks’ (Contractor & Monge, Reference Contractor and Monge2002; Phelps, Heidl, & Wadhwa, Reference Phelps, Heidl and Wadhwa2012). While previous literature has documented the ‘too-much-of-a-good-thing’ effects of knowledge diversity and network density separately (e.g., Zhou, Shin, Brass, Choi, & Zhang, Reference Zhou, Shin, Brass, Choi and Zhang2009), an integrated perspective of knowledge networks combines social networks and knowledge diversity to illustrate their joint effects on team innovation. Specifically, this perspective suggests that networks of interpersonal relationships influence the processes of knowledge creation, diffusion, absorption, and utilization (Phelps et al., Reference Phelps, Heidl and Wadhwa2012).
Knowledge diversity, which encompasses the varied types of knowledge, skills, and competencies possessed by team members (Hogg & Terry, Reference Hogg and Terry2000), fosters team innovation by increasing opportunities for novel recombination (Nahapiet & Ghoshal, Reference Nahapiet and Ghoshal1998; Raisch, Birkinshaw, Probst, & Tushman, Reference Raisch, Birkinshaw, Probst and Tushman2009). Despite its potential, extensive knowledge diversity often leads to ineffective communication and coordination (Reagans & Zuckerman, Reference Reagans and Zuckerman2001), making it challenging to combine and transform into innovative outcomes (Tsai, Reference Tsai2002; Venkataramani & Tang, Reference Venkataramani and Tang2024). To address these complexities, an emerging body of research on knowledge networks has burgeoned, investigating how team networks can facilitate the positive effects of knowledge diversity on team innovation while mitigating its inhibiting impact (Ter Wal, Alexy, Block, & Sandner, Reference Ter Wal, Alexy, Block and Sandner2016; Vestal & Danneels, Reference Vestal and Danneels2024). In particular, the positive effects of knowledge diversity on team innovation can be enhanced by the increased knowledge flow generated through the social cohesion fostered by network density (Fleming, Mingo, & Chen, Reference Fleming, Mingo and Chen2007). Furthermore, teams with dense internal networks can effectively leverage knowledge diversity without succumbing to internal communication conflicts (Reagans & Zuckerman, Reference Reagans and Zuckerman2001; Tzabbar & Vestal, Reference Tzabbar and Vestal2015).
From a theoretical standpoint, previous research on knowledge networks has postulated that the interactive effect of knowledge diversity and network density follows a positive linear trajectory in predicting team innovation (Tortoriello, McEvily, & Krackhardt, Reference Tortoriello, McEvily and Krackhardt2015). However, the interplay between these factors reveals a paradoxical relationship, as competing claims also highlight the costs associated with collaborative networks. Specifically, as network density increases, intimate relationships may lead to the circulation of redundant information and rigidity within teams (Granovetter, Reference Granovetter1973; Zhou et al., Reference Zhou, Shin, Brass, Choi and Zhang2009). Consequently, the advantages of knowledge diversity can be offset by the increased costs associated with dense communication and collaboration (Reagans & Zuckerman, Reference Reagans and Zuckerman2001; Tzabbar & Vestal, Reference Tzabbar and Vestal2015).
This complexity gives rise to a dilemma: the beneficial effects of knowledge diversity and network density may counteract each other in influencing team innovation. To effectively navigate the complexities of this paradoxical relationship, a deeper and more nuanced understanding is needed of the potential curvilinear interactive effect of knowledge diversity and network structure within teams. This necessitates an inductive analysis that explores the interaction of these factors and their influence on the innovation process. Such an approach holds important theoretical implications for optimizing these factors to foster team innovation.
From a methodological standpoint, the aforementioned empirical evidence is predominantly confined to survey methods and a narrow spectrum of cases. Consequently, numerous nuanced facets of team knowledge diversity (e.g., diversity from training, new hiring, team members’ socio-economic, educational, or functional background) and network structure (e.g., network density, small-world Q, group centralization) remain unsystematically examined in existing research due to the constraints of small case sizes and regression analysis methodology. As highlighted in the targeted MOR special issue, the application of new technologies, such as artificial intelligence (AI), has greatly modified and changed Human Resource Management (HRM) systems. This transformation has resulted in the accumulation of a large amount of employee-generated data, including the digital traces of team collaboration, organizational training, project management progress, etc. The accumulated big data, therefore, presents promising opportunities to address the inconclusive outcomes of knowledge networks. Furthermore, the pre-existing norms for quantitative studies mainly focus on deductive reasoning in theory examination, sometimes neglecting the crucial role of inductive thinking in theory-building. Some scholars have recently advocated the use of algorithm-supported induction to facilitate theory-building to work with large samples and big data (Choudhury, Allen, & Endres, Reference Choudhury, Allen and Endres2021; Shrestha, He, Puranam, & von Krogh, Reference Shrestha, He, Puranam and von Krogh2021; von Krogh, Reference von Krogh2018).
In line with this trend, our research motivation is to conduct a systematic and rigorous machine-learning (ML) inductive study. This includes developing the best predictive model and using interpretable AI to explain the findings from the optimal model, thereby addressing the research gap concerning the potential curvilinear relationship between knowledge diversity, network structure, and team innovation. To achieve this, we adopt a two-stage approach that combines exploratory data analysis and inductive theory-building (Bamberger & Ang, Reference Bamberger and Ang2016; Shepherd & Sutcliffe, Reference Shepherd and Sutcliffe2011; Shrestha et al., Reference Shrestha, He, Puranam and von Krogh2021).
This approach involves leveraging ML and interpretable AI models to identify the most strongly associated predictors within a system of features in the best-performing prediction model. It also aims to uncover relationship patterns among these key predictors and their interactive effects on team innovation. The findings are then interpreted to bridge the robust inductive results with novel theory-building (Sen & Puranam, Reference Sen and Puranam2022).
Based on this, we can harness the power of the ML inductive method to assess the following questions: (1) Among different types of knowledge diversity and network structure, which emerge as the most important predictors of team innovation? This endeavor will allow us to explore their main effects first. (2) How do their interactions impact team innovation? This exploration will help us discern unnoticed interactive patterns between knowledge diversity and network structure. (3) Can we build a prediction model using the ML method? Such a model may guide us in combining knowledge diversity and network structure to achieve better performance. This endeavor not only seeks to unravel complex relationships but also aims to uncover potential novel links between knowledge diversity and network structure, which may contribute to theory-building in knowledge networks and team innovation studies.
By analyzing multi-source longitudinal data from 1,883 teams, the findings addressing the first question reveal that team knowledge diversity shaped by an organization’s training programs (referred to as training knowledge diversity) is one of the most critical factors among different types of knowledge diversity in relation to team innovation. The findings for the second question show that team network density has a moderating effect on the link between knowledge diversity and team innovation (i.e., team network density and knowledge diversity positively reinforce each other with a joint positive effect on team innovation) in the initial phase. However, when both team network density and knowledge diversity reach a medium-to-high level, they constrain each other. In addressing the third question regarding the ML method, we used the ‘L-BFGS-B’ optimizer to find the optimal combination of knowledge diversity and network density to achieve better team innovation.
Our main contributions are twofold. First, this study contributes to knowledge network research by examining the curvilinear interactive effect of knowledge diversity and network structure on team innovation. Unlike the linear interactive effect depicted in previous studies, we reveal a curvilinear interactive effect between knowledge diversity and network density on team innovation. These two factors paradoxically reinforce and restrain each other in improving team innovation.
Second, in the methods section, we employ the ML inductive method – a form of reasoning that allows us to draw plausible conclusions from incomplete information and develop potential theories. We address several unresolved questions about ML-based inductive theory-building (Shrestha et al., Reference Shrestha, He, Puranam and von Krogh2021; Tidhar & Eisenhardt, Reference Tidhar and Eisenhardt2020), including when and how to use ML, how to split data, and how to employ various interpretable AI models to make theoretical development more plausible. Additionally, our study utilizes an interpretable AI model called SHAP (SHapley Additive exPlanations, Lundberg & Lee, Reference Lundberg and Lee2017) to visualize the relationship patterns of variables and the interactive effects of knowledge diversity and network density. By controlling for other critical factors, this method provides a detailed representation of the mutually reinforcing and mutually restraining links between these two variables.
Literature Review
The Knowledge Networks Perspective
A growing body of research on ‘knowledge networks’ (Contractor & Monge, Reference Contractor and Monge2002; Phelps et al., Reference Phelps, Heidl and Wadhwa2012) has been introduced, emphasizing an integrated perspective that combines social networks and knowledge to illustrate their joint effects on innovation. According to Tsui and Farh (Reference Tsui and Farh1997), considering team composition, knowledge, and network together can help us better understand outcomes at individual, team, and organizational levels (Kijkuit & Van Den Ende, Reference Kijkuit and Van Den Ende2007; Tzabbar & Vestal, Reference Tzabbar and Vestal2015). In general, the knowledge networks perspective can help unravel the complex interplay between knowledge and network in fostering team innovation.
First, the knowledge networks perspective, converging social network theory and knowledge-based view (KBV), is intriguing as it illustrates how team members interact with each other to achieve shared goals, including knowledge development and innovation (Pereira & Bamel, Reference Pereira and Bamel2021; Uzzi & Spiro, Reference Uzzi and Spiro2005). While social network theory concentrates on how connections facilitate the accomplishment of joint tasks (Uzzi, Reference Uzzi1997), KBV scrutinizes how collective knowledge undergoes transformation into innovation (Grant, Reference Grant1996; Kogut & Zander, Reference Kogut and Zander1992). The integration of these two perspectives offers insights into how team networks and knowledge collaboratively contribute to the pursuit of innovation.
Second, research on the knowledge networks perspective suggests that knowledge diversity within a dense network can be beneficial to teams, allowing them to access richer information and ideas (Cummings, Reference Cummings2004; Kirby, Tellegen, & Steindl, Reference Kirby, Tellegen and Steindl2017). Uzzi and Spiro (Reference Uzzi and Spiro2005) find that having diverse backgrounds within the same network can lead to higher creativity due to access to diverse perspectives. Additionally, Hwang, Singh, and Argote (Reference Hwang, Singh and Argote2019) demonstrate that when members have diverse backgrounds in education or experience but share similar values, they can work effectively together to produce creative solutions. In sum, empirical research indicates that when knowledge diversity is complemented by a dense collaborative network among team members, the conditions for fostering innovation are significantly enhanced.
Third, it is crucial to recognize the dual impact of both knowledge diversity and network structure. Notably, prevailing research has conventionally assumed a linear interactive effect of knowledge diversity and network structure in predicting team innovation. When coupled with a collaborative network among team members, the seamless potential of team knowledge diversity appears to be unlocked. However, the benefits of knowledge diversity can be tempered by increased expenses in internal communication and collaboration (Reagans & Zuckerman, Reference Reagans and Zuckerman2001; Tzabbar & Vestal, Reference Tzabbar and Vestal2015). Meanwhile, dense networks and intimate relationships may inadvertently lead to redundancy, forming a non-diverse closed group (Granovetter, Reference Granovetter1973). This complexity presents a dilemma: the positive effects of knowledge diversity and network density may counteract each other in influencing team innovation.
Hence, there is a possibility of a curvilinear interactive effect between knowledge diversity and network structure. Despite being theoretically assumed, this curvilinear interaction has not yet been thoroughly investigated, partially due to the constraints of a small sample and the limitations of regression analysis. The advent of new technologies in modern organizations has generated substantial amounts of data, providing opportunities to address the inconclusive outcomes of knowledge networks.
Consequently, this article will employ ML inductive methods to explore the potential curvilinear interactive effects underlying this dilemma and to understand the intricate interactions among knowledge diversity, network structure, and team innovation.
Machine Learning in Managerial Studies
In the field of management studies, big data analytics, such as ML models, are increasingly used to uncover patterns and explore quantitative data (Shrestha et al., Reference Shrestha, He, Puranam and von Krogh2021; Tidhar & Eisenhardt, Reference Tidhar and Eisenhardt2020). Shrestha et al. (Reference Shrestha, He, Puranam and von Krogh2021) have acknowledged the value of ML techniques in theory building from data. They have shown that robust findings derived from data can serve as a foundation for inductive research outcomes, which can then be employed to formulate theories, develop hypotheses, be confirmed, and be generalized to explain related phenomena.
However, debate still exists regarding how to effectively integrate ML models and interpretable AI methods. Many studies have only looked at the exploratory stage and have not attempted to draw causal conclusions (Choudhury et al., Reference Choudhury, Allen and Endres2021). The challenge is to use exploratory findings and interpretations to develop meaningful hypotheses (Lincoln & Guba, Reference Lincoln and Guba1985; Ragin, Reference Ragin2000; Ragin & Becker, Reference Ragin and Becker1992). This requires a dialogue between the findings and existing theories in order to develop an understanding of how they can be used together.
Therefore, Shrestha et al. (Reference Shrestha, He, Puranam and von Krogh2021) propose a methodology known as ‘Algorithm-Supported Induction for Building Theory’, which utilizes prediction models to propose hypotheses and subsequently validate them. This article follows the method of algorithm-supported induction to mine data, extract findings, and facilitate the development of theories based on the interpretation of findings in the following steps:
1. Defining the research focus: Proposing general research questions, such as the relationship among knowledge diversity, social network structure, and team innovation, discussed in this paper.
2. Clarifying theoretical puzzles: Identifying the puzzle of related theories, such as the insufficiency of the knowledge networks theory as shown earlier.
3. Selecting and computing predictors: Proposing reasonable predictors for research focus.
4. Building prediction models: Using an ML model to obtain the prediction model with the best prediction power.
5. Interpreting the model: Using interpretable AI to find the best predictors.
6. Operationalizing variables: Employing 10-fold cross-validation to select the most relevant predictors as key variables, while including other important predictors as controls where theory permits.
7. Exploring relationships: Using SHAP analysis to examine the interactions among knowledge diversity, network structure, and team innovation, visualized in a 3D representation.
8. Theorizing from results: Engaging with existing theory to refine or extend it by developing new propositions.
9. Testing theoretical implications: Exploring potential outcomes guided by new propositions, using the L-BFGS-B optimizer to identify local and possible global peaks of team innovation.
Data and Measurements
Collecting and Splitting Datasets
We collected data from 2,202 teams within a large high-technology company named Alpha between 2014 and 2017. Alpha has a diverse, fine-grained, and chronological portfolio of: 1) employees’ participation in joint projects, 2) training projects with thousands of courses (including title, duration, and training course participants), 3) employees’ demographic data, and 4) multiple methods of evaluation. These enable us to capture a comprehensive overview of the company’s HR activities on how knowledge is transferred within and between different work units via different relational types.
Alpha is an ideal setting for analyzing team innovation from a knowledge networks perspective for several reasons. First, Alpha is one of China’s largest high-technology and innovation-driven companies, which has an intense demand for novel ideas in technology. Second, teams in Alpha play important roles in accelerating innovation, getting closer to customers, and increasing productivity. Finally, the available data from Alpha allows us to construct a comprehensive network- and knowledge-based predictors system, making it possible to employ a split-sample strategy to develop theories. Team composition, duration, and correlation table for the 2,202 teams are included in Appendix A.
The split-sample strategy is a method used to develop theories using large-scale data. In this study, we first excluded teams with fewer than three members and those with more than 30 members, as excessively small or large team sizes could be outliers in network and interaction metrics, reducing their meaningfulness. After this refinement, we divided the data into two samples (as shown in Table 1). The 1,881 teams generated 2,881 observations over the four-year period.
Observations of the dataset

Sample 1 uses two-thirds of the cases as the exploration dataset for building the best prediction model, while the remaining one-third is used as the robustness checking dataset, referred to as Sample 2. The exploration dataset is divided into two parts: randomly sampled halves, one used as the training dataset and the other as the testing dataset. The training dataset is used to conduct exploratory analyses, in which patterns or stylized facts that emerge from the ML model serve as guides for theoretical development.
We also employ 10-fold cross-validation to select the most important features while preventing overfitting, and use SHAP values to create a 3D graph of interactive effects. The testing dataset is then combined with the training dataset to evaluate and confirm the overall maximum interactive effects of two variables, providing robust insights into their combined influence. Subsequently, we use the data from Sample 2 to validate the findings from the exploration phase by conducting LASSO regression. This approach is particularly well-suited for identifying high-order interactive effects and assessing the relative importance of features (as shown in Appendix B).
The team unit, in this context, refers to the official work unit within the business division. It is the basic unit within which members are appraised for innovative awards. An appraisal is undertaken by the company at the end of each calendar year, with awards such as the Patent Innovation Award being bestowed on teams that have demonstrated exemplary innovation. Taking appraisals as a reference enables us to identify which teams have been particularly innovative.
Measurements
The variable for prediction
In this article, team innovation is assessed based on the average innovative ability of team members, enabling significant breakthroughs. The measure is derived from the company’s annual innovation awards, which are classified into nine levels. Based on interviews with company experts, we define teams as highly innovative if they receive awards at level 5 (‘excellent patent award,’ which recognizes significant breakthroughs at the national or provincial level) or higher (levels 6–9). Conversely, awards below this threshold (levels 1–4) indicate low-innovative teams. This classification ensures an objective distinction between high and low team innovativeness.
Our approach to predicting awards is designed to utilize previous project collaboration networks for forecasting subsequent team innovation. With project durations limited to one year or less and awards recognized annually, we leverage the training experiences of team members within each year to forecast year-end awards, ensuring the relevance of our data. Considering the high turnover among team members, annual predictions prove more pragmatic than accumulating data over multiple years. While we incorporate accumulated variables in predicting team innovation using a cross-sectional panel approach, our analysis underscores the superiority of yearly assessments in achieving more accurate predictions.
The variables of our main concern
To commence this prediction exercise, we first create a universal set of variables that we can measure in the datasets. Most variables are suggested by the existing theories concerning the effects of knowledge diversity and networks on team innovation. However, because of the availability of big data, we can also conceptualize and explore the potential significance of some previously undetected but interpretable variables. The correlation table is also included in Appendix A.
Different Types of Knowledge Diversity
Research related to knowledge diversity has found that teams with a higher level of knowledge diversity tend to be more innovative (Jehn & Mannix, Reference Jehn and Mannix2001; van Knippenberg, De Dreu, & Homan, Reference van Knippenberg, De Dreu and Homan2004). While most studies concentrate on demographic knowledge diversity, such as gender, age, and education, others delve into knowledge diversity derived from working experiences, encompassing functional, hierarchical, and task-specific knowledge (van Knippenberg & Schippers, Reference van Knippenberg and Schippers2007). These diverse demographic backgrounds endow team members with distinct perspectives, subsequently impacting the outcomes of collective intelligence (Sobkowicz, Reference Sobkowicz2017).
Two dimensions are used to measure knowledge diversity: training knowledge diversity and demographic knowledge diversity. Training knowledge diversity is measured by the training courses that team members participate in. These training programs can include a variety of technical skills (e.g., Python, C++, iCloud), interpersonal skills, daily living skills, and other soft skills. By participating in these training programs, team members are exposed to different types of knowledge and are more likely to possess various types of expertise. Additionally, demographic knowledge diversity can be gained through the socio-demographic, educational, and functional backgrounds of the individual members, which can help to capture and manifest the acquired knowledge.
In our study, we posit that training diversity represents another dimension of knowledge diversity worthy of consideration. Through both predictive and explanatory AI models, we systematically rank various dimensions of knowledge diversity, revealing that training diversity emerges as one of the most significant factors among them. This finding underscores the value of employing AI models to identify crucial factors amidst diverse dimensions of knowledge and to further explore their interactions with network structure.
Moreover, within the domain of HRM, research highlights the malleability of knowledge diversity through the strategic selection of different training courses for team members. The acquisition of new knowledge and skills through organizational training courses significantly impacts team innovation (Kozlowski, Gully, Brown, Salas, Smith, & Nason, Reference Kozlowski, Gully, Brown, Salas, Smith and Nason2001; Tortoriello ett al., Reference Tortoriello, McEvily and Krackhardt2015; van der Haar, Segers, & Jehn, Reference van der Haar, Segers and Jehn2013). On the one hand, the choice of training courses may align with the requirements of ongoing tasks, serving as a crucial component in achieving innovative accomplishments. On the other hand, by participating in training courses collectively within groups, teams have the opportunity to enhance their collective working memory, thereby benefiting team innovation. This is supported by research from Pelled (Reference Pelled1996) and Webber and Donahue (Reference Webber and Donahue2001), who argue that diverse knowledge gained from training courses contributes significantly to improving team innovation. Therefore, training knowledge diversity stands out as another critical source for nurturing team innovation.
To supplement the incomplete measurements, we further divide training knowledge diversity into two categories: 1) knowledge variation between different team members (denoted as team training diversity); and 2) the span of knowledge for an average team member (denoted as personal training diversity). Team training diversity refers to the difference between the skills, competencies, and experiences of different members in a given team, which allows them to come up with more creative solutions (Jehn & Mannix, Reference Jehn and Mannix2001). Personal training diversity is about leveraging one’s own various types of knowledge learned from training programs so one can bring new knowledge into current endeavors (Kostova & Roth, Reference Kostova and Roth2003).
Both team training diversity and personal training diversity have been demonstrated as essential components for fostering successful innovation (Subramaniam & Youndt, Reference Subramaniam and Youndt2005; Taylor & Greve, Reference Taylor and Greve2006). Therefore, we need to further examine the relative importance of different types of training, knowledge diversity for innovation using an ML inductive method.
The following is a detailed description of each measure.
Team training diversity: Inspired by Balch’s (Reference Balch2000) framework on hierarchic social entropy, our method evaluates both the breadth of course categories attended and the proportional allocation of participation among team members. This dual-layer evaluation not only captures the extent of knowledge variety within the team but also highlights interpersonal differences in specialization and learning trajectories. Teams with highly diverse training profiles exhibit greater entropy, indicative of differentiated knowledge contributions, while lower entropy suggests homogeneity in training experiences, reflecting potential redundancy in knowledge acquisition.
Training courses are grouped into four categories: technical skills, interpersonal and leadership skills, self-awareness and personal growth, and general skills encompassing finance, culture, and problem-solving. This classification reflects the multifaceted nature of professional development and facilitates a richer assessment of diversity in knowledge acquisition. Each team member’s participation across these categories is recorded, generating a matrix of training experiences that forms the basis for subsequent entropy calculations.
Member-level category participation: For each team member i in team t, the proportion of courses attended in each category j is computed as:
 \begin{equation*}{{\text{p}}_{{\text{ij}}}}{\text{ = }}{{\text{n}}_{{\text{ij}}}}/\mathop {\mathop \sum \limits^{\text{m}} }\limits_{{\text{j = 1}}} {{\text{n}}_{{\text{ij}}}}\end{equation*}
Where  ${n_{ij}}$ is the number of courses in category
 $j{\text{ }}$taken by member
 $i$
Individual entropy: Using the normalized proportions, we compute the entropy for each member, which reflects the spread of their training across categories:
 \begin{equation*}{{\text{E}}_{{\text{it}}}} = - \sum\limits_{\text{j}} {{\text{p}}_{{\text{ij}}}}{\text{log(}}{{\text{p}}_{{\text{ij}}}}{\text{)}}\end{equation*}
A higher entropy score signifies that the member participated in a more diverse set of training categories, while a lower entropy score reflects concentrated participation in a few categories.
Team-level training diversity: To obtain an aggregate measure of team training diversity, individual entropy scores are weighted by each member’s overall training participation relative to the team. Specifically, each member’s entropy score is weighted by their proportional contribution to the team’s overall training activities:
 \begin{equation*}{{\text{D}}_{\text{t}}}{\text{ = }}\mathop {{\text{ }}\mathop \sum \limits^{\text{n}} }\limits_{{\text{i = 1}}} \Big(\sum \limits_{\text{j}} {{\text{n}}_{{\text{ij}}}} \Big/\sum\limits_{{\text{i,j}}} {{\text{n}}_{{\text{ij}}}}\Big){{\text{E}}_{{\text{it}}}}\end{equation*}
The weighting factor ensures that members with higher training participation contribute more significantly to the team’s overall diversity score.
Teams with high training diversity exhibit minimal overlap in members’ course participation, fostering specialized knowledge that supports innovation. Conversely, teams with low diversity have homogeneous training experiences, resulting in limited differentiation of expertise. Intermediate diversity reflects a balance between shared foundational skills and individual specialization.
By incorporating entropy into the assessment of training diversity, this method overcomes the limitations of simple participation counts, which tend to underestimate the complexity of knowledge distribution. The refined metric not only provides a more nuanced understanding of team composition but also enhances the robustness of analyses exploring the relationship between diversity and innovation.
Personal training diversity assesses the breadth of the average individual’s expertise across multiple skill sets and is therefore measured by the average number of different types of training courses that team members participate in. This is calculated based on the four categories of training courses mentioned earlier. By calculating the average number of training course types, we can get an indication of how much different knowledge a team member has obtained from participating in training programs.
Demographic knowledge diversity is measured by how diverse a team is in terms of team members’ educational background, functional background, graduated school status, job grade, and gender. This can be measured using the information entropy algorithm for categorical variables, which looks at the different categories of knowledge that team members possess. This helps to understand the breadth and depth of knowledge that the different backgrounds of team members bring to the team, which can be useful in understanding how the team can best tackle different tasks.
Different Types of Network Structures
All network structures are computed from team collaboration networks constructed based on cooperative relations in projects. The projects were conducted by members recruited from several different teams, and the specific methods of organizing these projects vary. Some projects follow a top-down organizational approach, wherein high-level managers reach agreements and organize employees from different teams into project teams. Conversely, other projects adopt a bottom-up approach. For instance, based on our interviews with employees within the company, some individuals initiate project formation through personal connections or training courses, driven by their own ideas. Despite the diversity in organizational approaches, both methods share the commonality that once project teams are formed, they are guided by clear objectives. Furthermore, not all team members from every team are included in every project; inclusion depends on whether the employee’s knowledge and skills are deemed necessary for the project’s success.
Network density is measured by how connected a team is in terms of collaborating on projects. It is generated by the number of times that two employees have been part of the same project. The higher the network density, the more connected the team is and the more likely they are to communicate, share information, and trust each other.
We also compute other network indices that are used to quantify the compactness and fragmentation of an internal network structure. Examples of such metrics include average path length (the number of steps it takes for one node in a graph to reach another), small world Q (a measure of how connected nodes are clustered within a given distance in comparison with random networks) (Newman, Reference Newman2003), numbers of cliques (groups or clusters where all members have direct connections between each other) and average degree of centrality (Wasserman & Faust, Reference Wasserman and Faust1994). These measures can help us understand the overall connectivity patterns within a team.
We have further analyzed our dataset to explore the temporal dynamics of team membership, focusing particularly on the continuity and turnover of team members across different years. Our analysis reveals significant insights into the fluidity of team composition, which we believe adds depth to our understanding of team innovation in project settings.
Team continuity is calculated as the continuity ratio by identifying pairs of consecutive years (e.g., 2014–2015, 2015–2016, etc.) and assessing whether team members remained within the same organizational unit during these periods. Our data show an average continuity ratio of 0.532, ranging from a minimum of 0.0 (complete turnover) to a maximum of 0.965 (nearly complete stability), with a variance of 0.0702.
The new staff ratios across teams further complement these findings. The mean new staff ratio is 0.274, indicating that, on average, about 27.4% of team members in a given team are new each year. This ratio reaches a maximum of 1.0 in some teams, where the entire team composition may be replaced in a given year, and a minimum of 0.0, where no new members were added. The variance (0.0725) across teams underscores the varying degrees of team fluidity, ranging from highly stable to completely dynamic.
In this study, each team-year observation is treated as independent due to the high turnover rates observed across the sample. Specifically, out of a total of 1,883 teams, 1,013 teams (53.8%) had a continuity ratio of 0.2 or lower over four years, indicating very low overlap in team members across consecutive years. Additionally, 126 teams (6.7%) had a new staff ratio of 0.8 or higher, meaning the majority of team members in these 126 teams were replaced within a given year.
Together, these cases account for a significant portion of all teams, demonstrating that most teams in our dataset are subject to frequent restructuring. This reflects an organizational context where team compositions are fluid, making it inappropriate to assume fixed or stable team memberships over time.
Other variables for controlling
Team composition includes team size and demographic composition. Demographic composition is a measure of how well team members’ backgrounds are aligned with the team’s collective character (Lubatkin, Simsek, Ling, & Veiga, Reference Lubatkin, Simsek, Ling and Veiga2006). This is measured by looking at the team members’ composition of functional background, educational background, graduate school status, and gender. One example is looking at the proportion of technical employees in a team.
The level of team satisfaction among team members is also taken into consideration to gain a better understanding of how well the team works together (Bell & Kozlowski, Reference Bell and Kozlowski2002; Mathieu, Maynard, Rapp, & Gilson, Reference Mathieu, Maynard, Rapp and Gilson2008). This helps to identify any potential areas of conflict and allows teams to adjust their composition and character in order to better align with the team’s goals and objectives.
Features List
Before building the prediction models, we first conduct a primary correlation analysis of all the variables to eliminate any variables that are highly correlated. A high correlation coefficient indicates a strong correlation, and we keep some of the variables that are more generally used in previous research. Additionally, we delete the average path length of the intra-team collaborative networks since it correlates highly with network density. We also delete the variable ‘number of cliques’ since more than 80 percent of its values are 0. This process helps us to reduce the number of variables and create more accurate models. Finally, 19 features are put into ML models, as shown in Table 2.
Features affecting team innovation

Systematic Exploration and Interpretation
Machine-Learning Models and Interpretable AI Methods
The following exploratory study mainly fulfills two purposes: selecting the most important features for predicting team innovation and finding the correlation patterns between the features and team innovation.
We first build a prediction model concerning knowledge diversity and network structures to predict team innovation. This helps avoid the weaknesses of survey data in that it relies on an insufficient amount of data and sometimes equates testing datasets with training datasets. ML is used to establish a benchmark for a good-fitting prediction model, and this can provide insights into what possible theories might be out there waiting to be explored.
The ML method helps us understand various elements. These include the variables that are most strongly positively or negatively related to team innovation, any possible nonlinear relationships between team innovation and these variables, and the possibility of linear and nonlinear interactions between these variables for predicting team innovation. This helps us to better understand influential factors of team innovation and develop a more comprehensive model.
Prediction Model
We use the XGBoost model to construct a prediction model. XGBoost is an ML algorithm that is widely used to fit and investigate complex polynomials and interactions. This study uses this model to identify the strongest predictors of highly innovative teams from a universal set of predictors. The best-performing XGBoost model is selected based on the cross-validated F1-score specifically for predicting high-innovation teams, which constitute the positive class. Given that our primary objective is to identify such teams, we emphasize class-specific performance metrics (e.g., precision, recall, F1-score for the positive class) over aggregate metrics like overall accuracy. The model with the highest F1-score for innovative teams is then selected for the use of interpretation.
The rates of F1, Accuracy, and AUC are employed to measure the performance of the prediction models. The F1 score is computed from precision and recall rates. Precision measures the fraction of relevant instances among the retrieved instances, while recall measures the fraction of relevant instances that have been retrieved. The F1 score, which is the harmonic mean of precision and recall, is prioritized to ensure balanced performance across both metrics, especially for minority classes such as innovative teams. This comprehensive approach allows the prediction model to account for both false positives and false negatives, providing a robust evaluation of team innovation.
Accuracy measures the proportion of correct predictions made by the model, reflecting its overall performance in classifying outcomes. It is calculated as the number of correct predictions divided by the total number of observations. AUC (Area Under the ROC Curve) evaluates the model’s ability to distinguish between classes by assessing the trade-off between true positive rates and false positive rates across different thresholds. A higher AUC indicates better discrimination, meaning the model can effectively separate positive and negative classes.
The XGBoost model was optimized using grid search with 10-fold cross-validation, refining hyperparameters such as learning rate, tree depth, gamma, and colsample_bytree. The parameter grid included a learning rate range of 0.01 to 0.2 (in increments of 0.05) to balance training speed and generalization; tree depths from 5 to 11 to explore model complexity; colsample_bytree values of 0.3, 0.5, and 0.7 to regulate feature sampling; and gamma values of 0.1, 0.3, and 0.5 to control tree node splitting. This comprehensive search ensured the model was tuned to balance complexity, performance, and generalization, avoiding overfitting while capturing relevant patterns in the data.
The optimal parameters identified were: ‘colsample_bytree’: 0.7, ‘gamma’: 0.1, ‘learning_rate’: 0.160, and ‘max_depth’: 7. These settings effectively balance model complexity and generalization by controlling the learning rate, tree depth, feature sampling, and regularization, thereby preventing overfitting.
The evaluation metrics for the XGBoost model reveal an overall accuracy of 66.2%, an F1-score of 44.56% for predicting high-innovation teams, and an AUC of 62.78%, indicating a moderate ability to differentiate between innovative and non-innovative teams. The model effectively captures the distinction between the two groups while maintaining reliability and avoiding overfitting.
The best-performing XGBoost model, selected based on the cross-validated F1-score specifically for predicting high-innovation teams, achieved an overall accuracy of 65.4%, a macro-average F1-score of 61%, and an F1-score of 48.77% for predicting high-innovation teams. The model’s AUC was 64.76%.
Although model performance metrics such as F1 score and AUC indicate moderate discriminative ability (below 70%), we retained this model for its balance between predictive performance and interpretability. Alternative resampling strategies (e.g., over-sampling, under-sampling) yielded only marginal improvements or trade-offs across metrics. The original model thus provided a more stable foundation for explanation and inference.
Using an Interpretable AI Model to Detect the Most Important Features
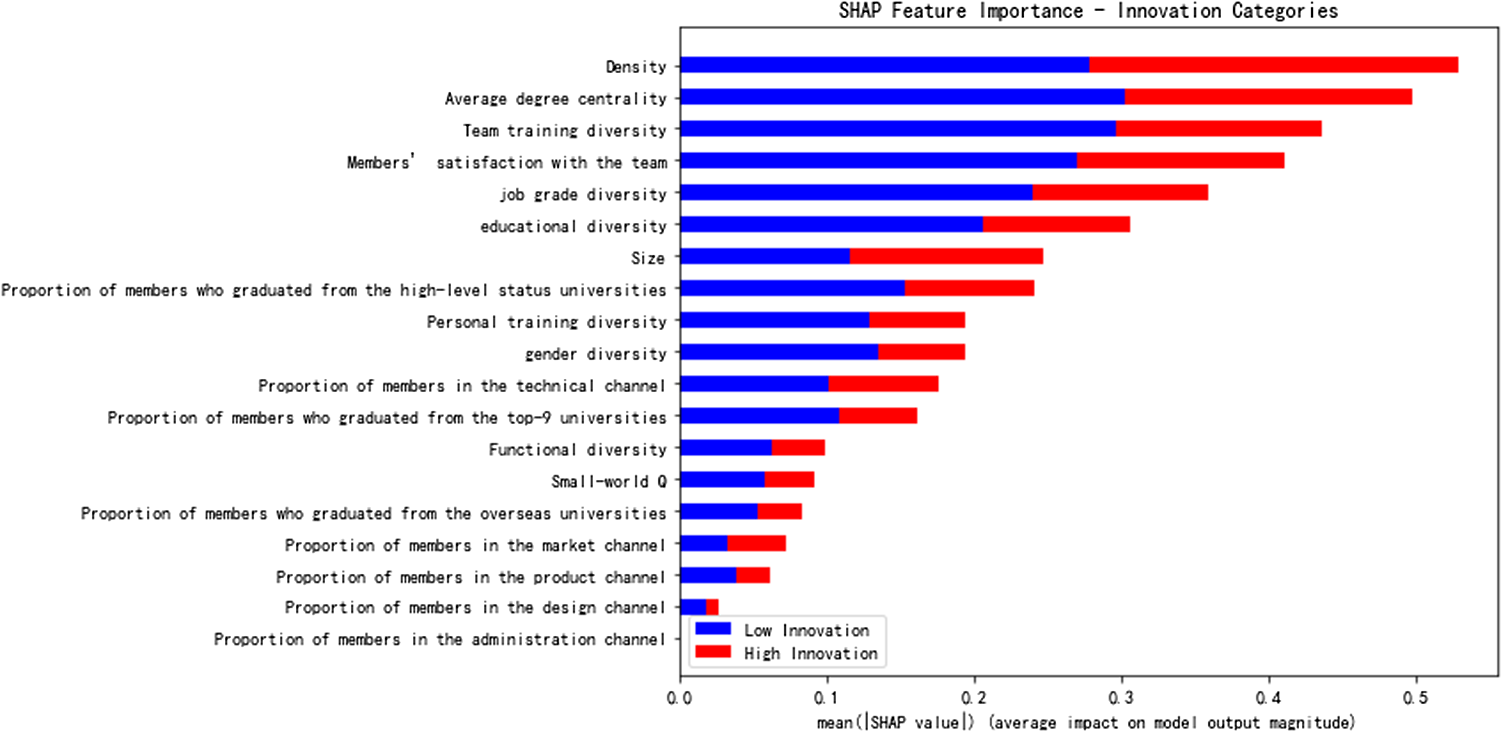
To enhance interpretability, we applied SHAP analysis, which offers insights into the key drivers of team innovation and provides actionable recommendations. We begin by analyzing feature importance using a 10-fold cross-validation method with the best-performing model. Among the various variables related to training knowledge diversity listed in Table 2, team training diversity stands out as the most important feature among all diversity-related indicators (ranked first among diversity metrics; see Fig. 1).
The analysis of the feature importance of the best-performing model

However, it is worth noting that team training diversity represents just one aspect of knowledge diversity. To assess its relationship with other diversity dimensions, we conducted a Pearson correlation analysis between team training diversity and four additional dimensions: job grade diversity, educational diversity, functional diversity, and gender diversity. The results revealed weak positive correlations with job grade diversity (coefficient = 0.085), educational diversity (coefficient = 0.033), functional diversity (coefficient = 0.053), and gender diversity (coefficient = 0.082), suggesting limited interconnectedness between these dimensions.
In the category of network structure, the analytical result highlights the importance of collaborative network density. It is found that network density can play an important role in driving team innovation (please refer to Fig. 1). The most important features in the other categories will be chosen as the controls in the following models. They are educational diversity brought about from demographic knowledge diversity, members’ satisfaction with the team from the team atmosphere, and team size from team composition.
In addition to ranking the most important features, conducting an exploratory study also helps us find the relationship patterns among the features and team innovation. SHAP (Lundberg & Lee, Reference Lundberg and Lee2017) is an interpretable AI model that uses game theory to distribute ‘credit’ fairly among features based on efficiency and symmetry. The SHAP values can be used to confidently interpret tree models like XGBoost and to better visualize linear and nonlinear relationships.
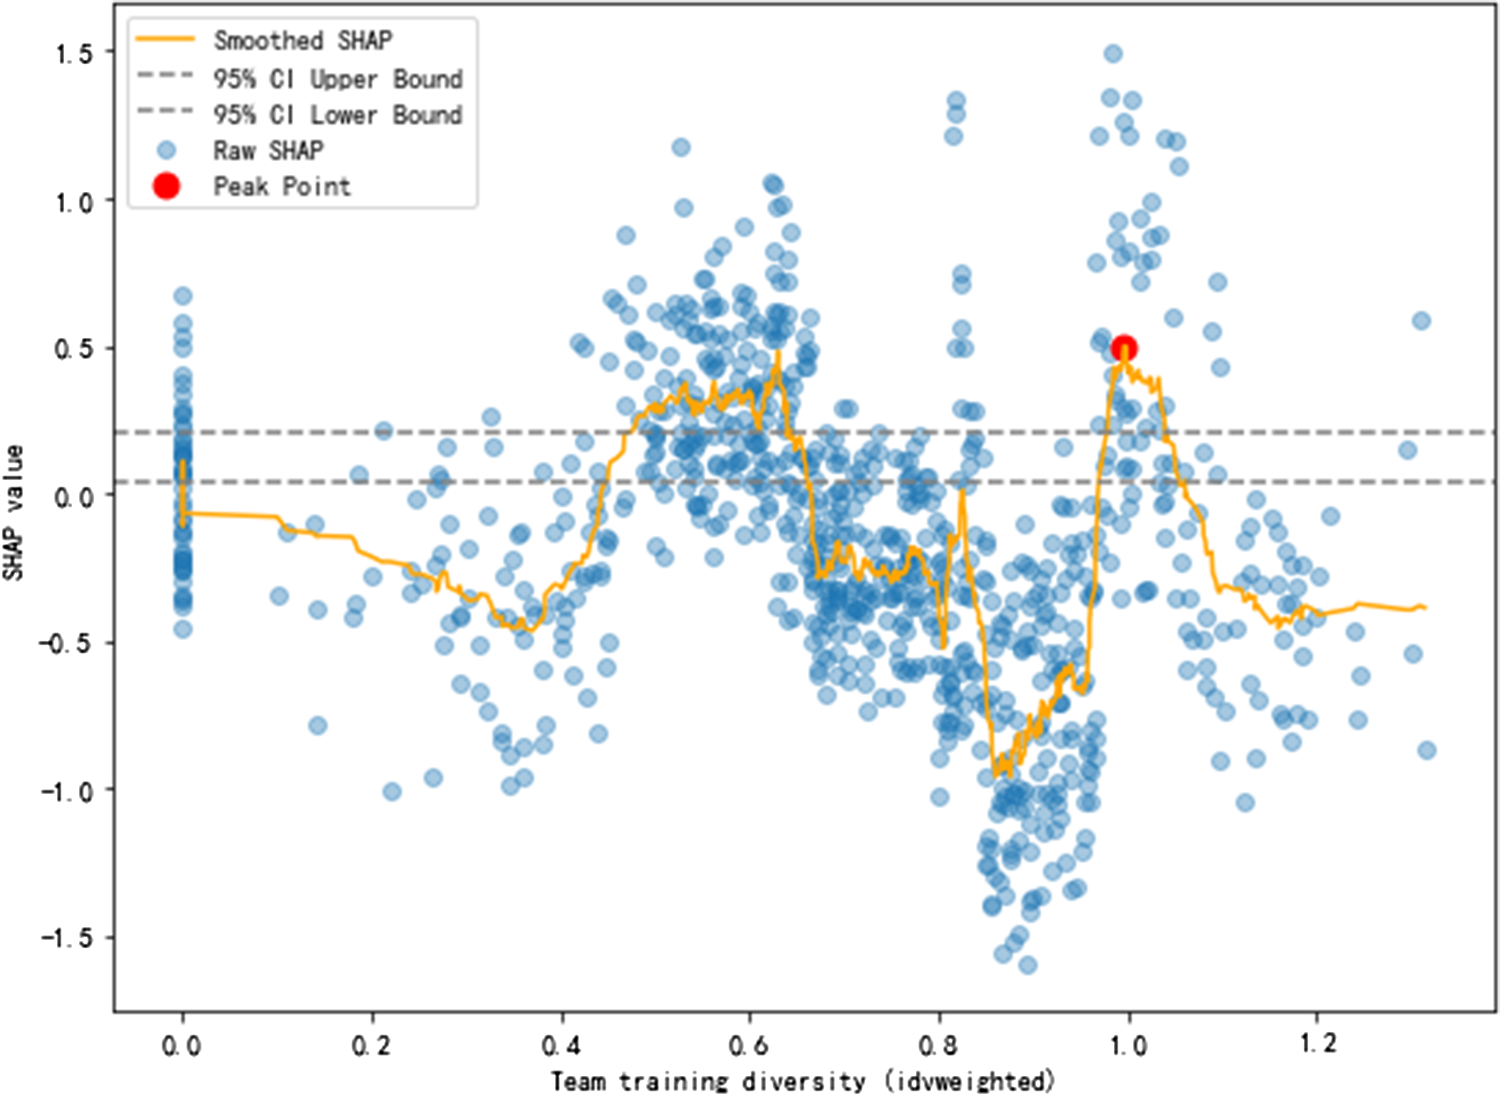
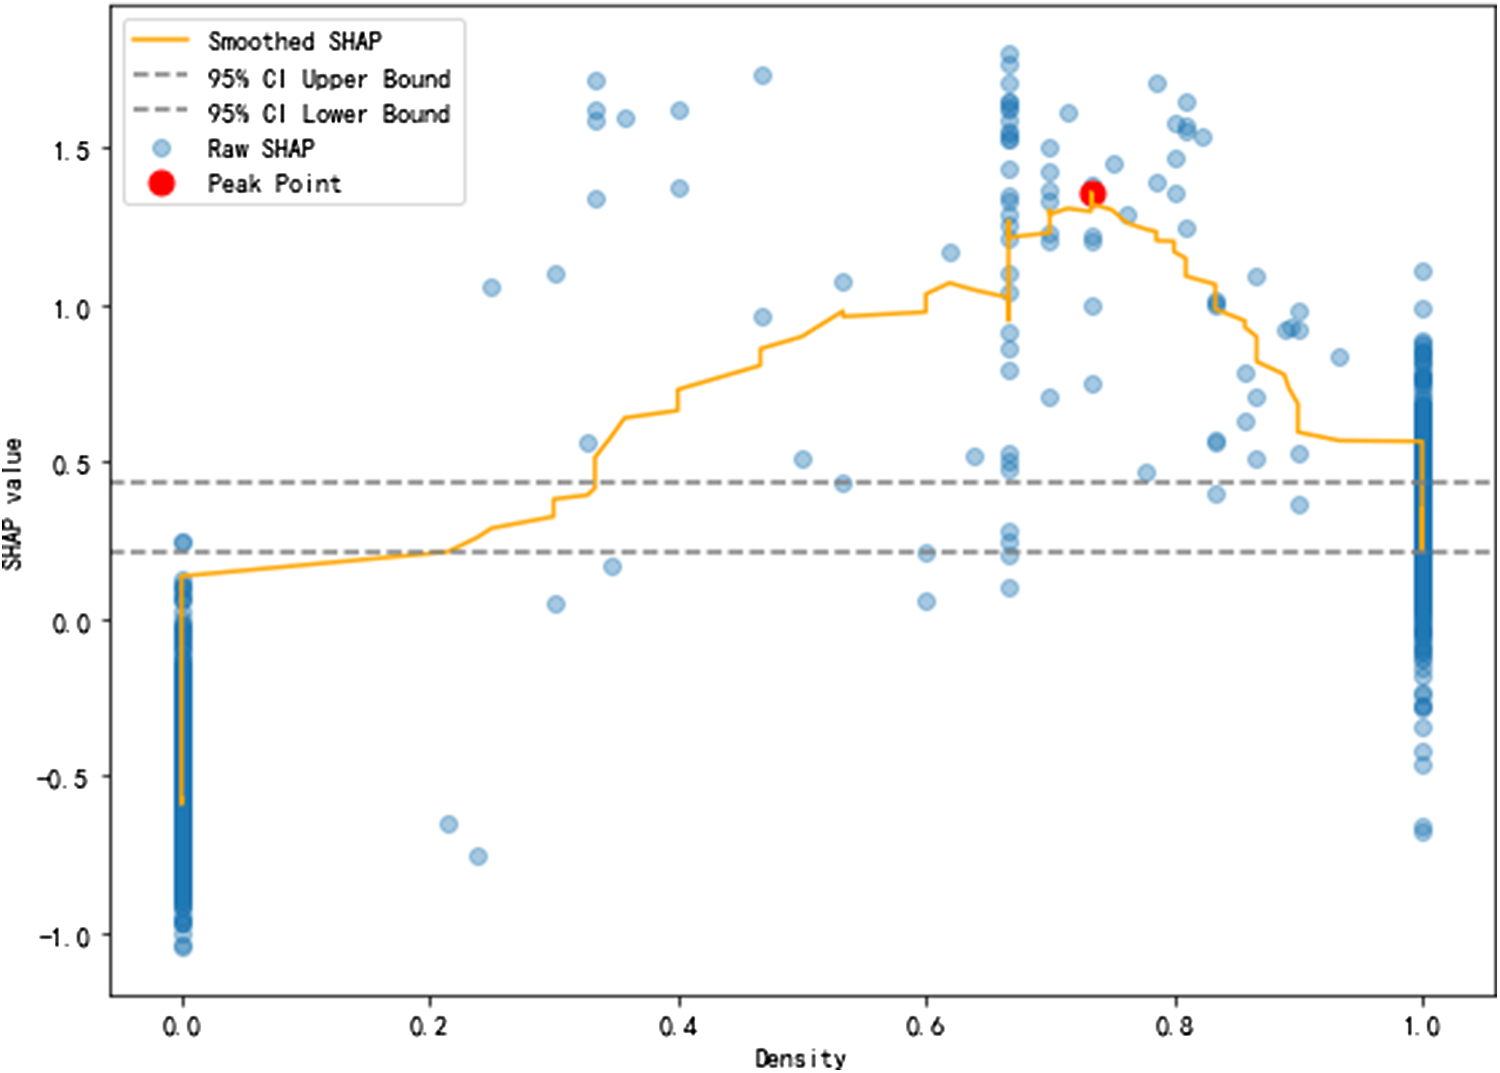
Team training diversity and network density are two variables that have been found to be highly important in predicting team innovation. The partial dependence plot of the SHAP value shows that these two variables have an inverted curvilinear association (SHAP values often follow an inverted U-shaped curve with one or more fluctuations, and local peaks tend to occur around medium to moderately high levels of the factor) with team innovation, as shown by Figures 2 and 3, meaning that as the level of network density and team training diversity increases, the level of team innovation rises at first but then falls.
The curvilinear effect of team training diversity on team innovation with permutation-based confidence bands

The curvilinear effect of density on team innovation with permutation-based confidence bands

The Findings Concerning the Interactive Effect
We use the entire exploration dataset to plot the SHAP values of the interactive effect of the chosen variables, namely team training diversity and network density, on team innovation to uncover unknown or novel patterns. By leveraging the full dataset to compute SHAP interaction values, the analysis provides a comprehensive explanation of the model’s predictions and interactive effects across all samples. This approach is valuable for interpreting global feature importance and interactions, as it accounts for the complete feature distribution of the dataset.
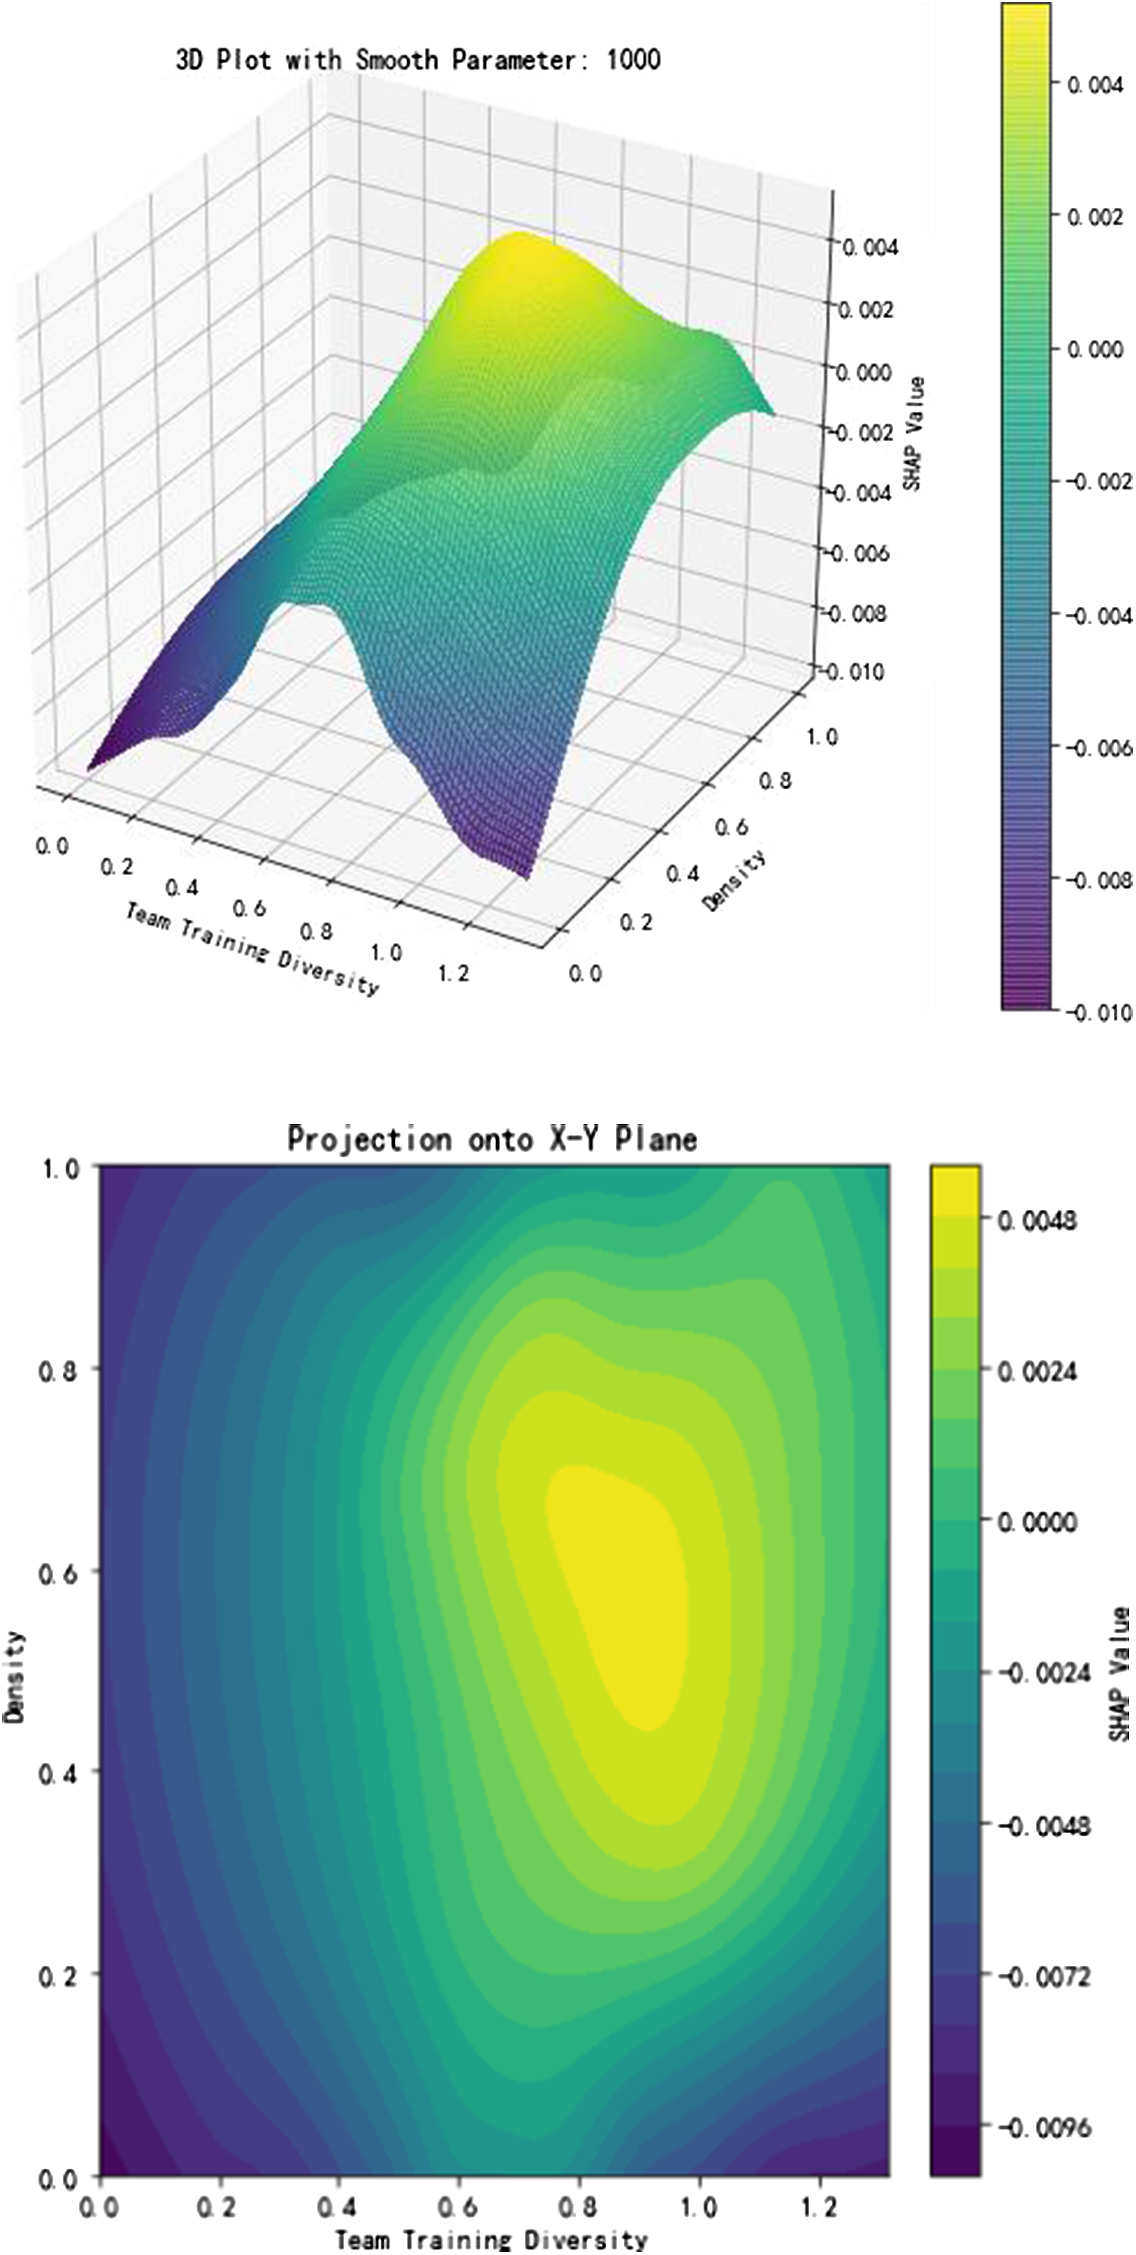
The partial dependence 3D plot of the SHAP values is shown in Figure 4, where the vertical axis illustrates the interactive effects of the two variables on team innovation after controlling for all other variables.
SHAP values of the interaction between team training diversity and network density, and projection onto the team training diversity-network density plane

In this plot, SHAP values reveal a curvilinear interaction pattern between the variables across various levels of network density. As shown in the contour map of the 3D SHAP plot, the highest peaks of interactive effects occur when network density and team training diversity reach medium to moderately high levels of their respective maximum values.
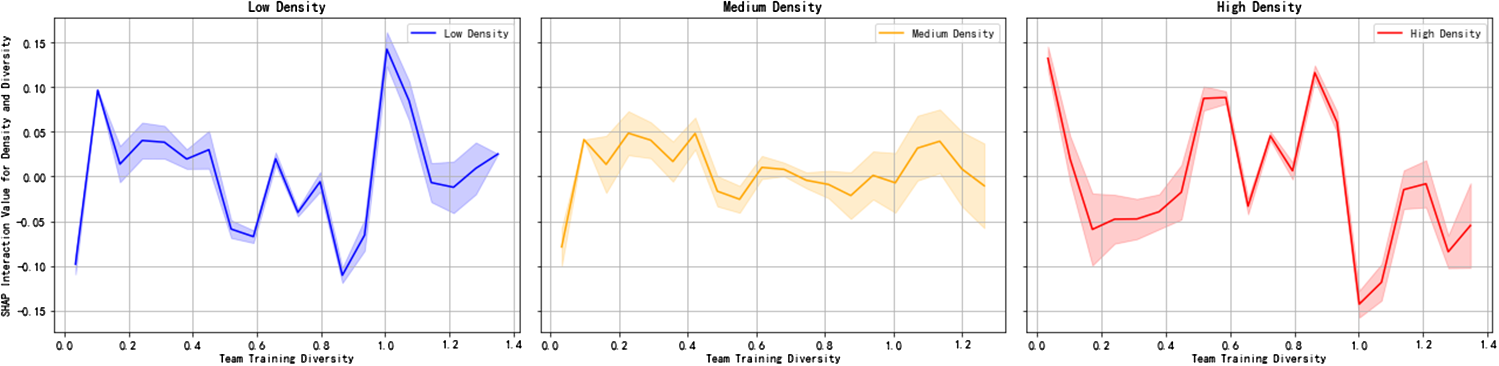
We then transform the 3D plot into 2D plots to more easily visualize the interactive effects. In Figure 5, when network density is low, the interactive effect on team innovation initially rises sharply, then declines, increases again at moderate diversity, and reaches a local peak toward the end. Overall, the interactive effects are significantly positive. With moderate network density, low to moderately high levels of team training diversity exhibit a positive interactive effect on team innovation, but high levels of team training diversity show a diminishing effect. This indicates that the local peak occurs at a moderately low level of diversity, although the curve remains relatively flat overall. When network density is high, the SHAP values of team training diversity initially decrease, followed by an M-shaped curve with a generally downward trend.
The non-linear interactive effect of team training diversity on team innovation, at low, medium, and high levels of density

These findings suggest that network density indeed moderates the interactive effect of team training diversity on team innovation, but this moderating effect is not linear across various levels of network density. Specifically, when network density is low, SHAP values of interactive effects are significantly positive. At medium density, the effects are moderately positive, while at high density, the effects exhibit a generally downward trend.
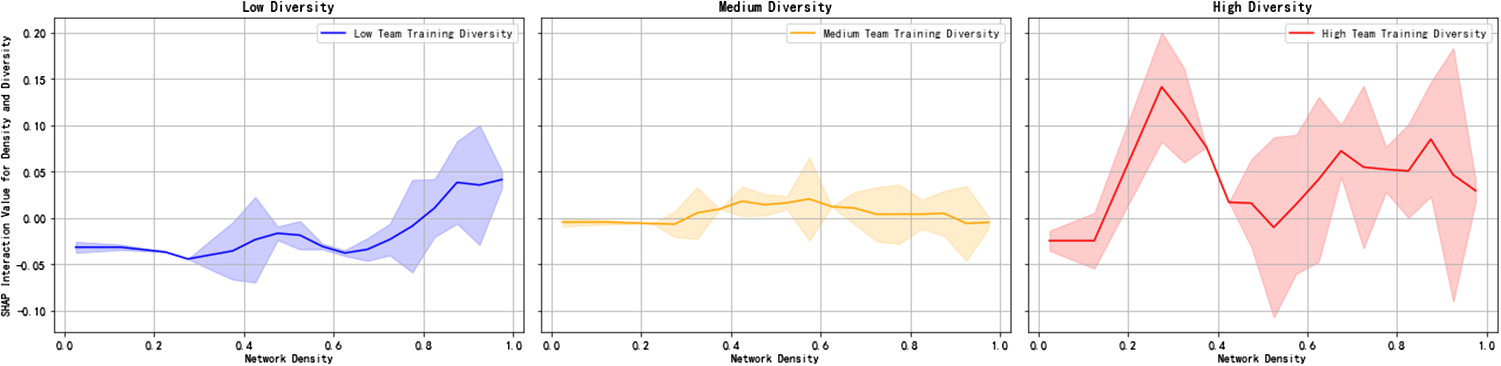
From another perspective, team training diversity also moderates the effects of different levels of network density on team innovation in a curvilinear manner. At low diversity levels, the interactive effects exhibit an M-shaped curve with a general upward trend. At moderate diversity levels, the interactive effect is almost flat and appears insignificant. At high diversity levels, the local peak appears at a low level of density, after which the curve reverses into a comparatively sharper decline. In other words, high diversity combined with medium to high levels of density generally has a decreasing impact on innovation.
All the findings stated earlier demonstrate that team training diversity and network density moderate each other’s impact on team innovation in a curvilinear pattern.
Interpretation and Discussion
Previous studies have suggested that the combination of knowledge diversity and network structure can have a positive effect on team innovation (van Knippenberg & Schippers, Reference van Knippenberg and Schippers2007). However, the paradoxical relationship between knowledge diversity and network structure has yet to be fully explored. This research paper seeks to investigate this relationship and determine how knowledge diversity and network density moderate each other, and together impact team innovation, both theoretically and empirically.
Theoretical Contribution and Proposition
Our main contributions are twofold. First, our work contributes to the understanding of the hidden tensions between knowledge diversity and network density. Existing research has predominantly examined the independent and separate effects of network density or knowledge diversity on team innovation, often highlighting a curvilinear relationship for each factor (e.g., the single-factor studies, including the one on network density by Ahuja, Reference Ahuja2000; the one on knowledge diversity by Cummings, Reference Cummings2004; diversity and network ties by Lungeanu & Contractor, Reference Lungeanu and Contractor2015).
Most explanations point to intuitive ‘too-much-of-a-good-thing’ effects resulting from the two separate factors. Network density fosters team cohesiveness and coordination. Up to a certain level, network density positively influences the process of knowledge combination, which is essential for team innovation (Koskinen, Jones, Medeuov, Antonyuk, Puzyreva, & Basov, Reference Koskinen, Jones, Medeuov, Antonyuk, Puzyreva and Basov2020; Xiao, Makhija, & Karim, Reference Xiao, Makhija and Karim2022). However, beyond a certain threshold, knowledge diversity may lead to conflicts and hinder knowledge combination (Gerwin & Ferris, Reference Gerwin and Ferris2004). As shown in Figure 2, the effect of knowledge diversity on team innovation follows a curvilinear curve: it initially increases, then fluctuates, but eventually experiences a decline. To evaluate whether this local maximum is meaningful or merely an artifact of noise, we applied permutation-based significance testing, following the rationale of Altmann, Toloşi, Sander, and Lengauer (Reference Altmann, Toloşi, Sander and Lengauer2010). This nonparametric method simulates the null hypothesis by randomly permuting the SHAP values, thereby disrupting the association between input features and model outputs. Unlike bootstrapping – which resamples the observed data but retains its internal structure – permutation testing generates a conservative null distribution that better reflects the assumption of no effect. This is especially suitable in our exploratory setting, where peak interpretation is conducted on a subsample rather than the full dataset. The results confirmed that the observed peak is statistically significant, as it lies outside the 95% confidence interval of the null distribution. The results confirmed that the observed peak is statistically significant: the peak SHAP value for Team Training Diversity (0.4994 at a value of 0.996) exceeded the 95% confidence interval of the null distribution [0.0333,0.2096], yielding a p-value of 0.0000. This result was obtained by permuting SHAP values 1,000 times, recalculating smoothed dependence curves for each permutation, and forming a null distribution of peak values – demonstrating that the observed peak is highly unlikely to have occurred by chance.
Similarly, for a given level of knowledge diversity, higher network density can promote more communication and brainstorming. However, extremely high density may lead to cognitive rigidity and group pressure. In such cases, teams are likely to overlook or forgo opportunities to recombine different knowledge components to achieve novel outcomes. As shown in Figure 3, the effect of network density on innovation generally increases at first, flattens at moderate levels, and finally sharply decreases when density is high. The permutation test again confirmed the statistical significance of the observed peak, reinforcing the robustness of the curvilinear effect: the peak SHAP value for Network Density (1.3561 at a value of 0.7333) is far outside the 95% confidence interval of the null distribution [0.2072, 0.4343], yielding a p-value of 0.0000.
Concerning the focus of our interest – the interaction between knowledge diversity and network density – some theories have identified only positive effects (e.g., Hwang et al., Reference Hwang, Singh and Argote2019; Kirby et al., Reference Kirby, Tellegen and Steindl2017; van Knippenberg & Schippers, Reference van Knippenberg and Schippers2007) or only negative effects (e.g., Williams & O’Reilly, Reference Williams and O’Reilly1998), often framed as linear relationships, thus failing to identify a possible curvilinear pattern.
Our findings differ from these studies by revealing inverted U-shaped patterns for the interactive effect of diversity and density on team innovation. Figures 4–6 illustrate the SHAP value of this interactive effect, which is evidenced by a curvilinear curve. The exploratory results identify a double-edged sword pattern, demonstrating both conflicting and complementary relationships between team knowledge diversity and network features (cf. Zhou & Li, Reference Zhou and Li2024).
The non-linear interactive effect of network density on team innovation, at low, medium, and high levels of team training diversity

A possible interpretation points to the ‘too-much-of-a-good-thing’ effect. The key question is when the diversity of new knowledge learned through training, coupled with team network density, facilitates collective innovation and when it becomes detrimental. From the perspective of information elaboration, diverse ideas and knowledge enhance information processing and foster creative problem-solving (Harrison, Price, Gavin, & Florey, Reference Harrison, Price, Gavin and Florey2002). Some theorize that acquiring and absorbing external knowledge can generate new internal knowledge (Zahra, Nielsen, & Bogner, Reference Zahra, Nielsen and Bogner1999). Within an appropriately dense network, training team members with diverse knowledge can facilitate learning among current employees and enable teams to explore new niches of activity, preventing inflexibility and inspiring creativity (Jain, Reference Jain2016).
On the other hand, some theorize that differences introduced by new knowledge in a tightly knit network may impede team communication and cooperation, thereby harming team innovation (van Knippenberg et al., Reference van Knippenberg, De Dreu and Homan2004). This theoretical interpretation aligns with the view of social categorization processes, which suggests that established ‘we-group’ cognitions in a dense clique of employees hinder in-depth communication between dissimilar individuals, leading to decreased satisfaction and reduced innovative motivation (Jehn, Reference Jehn1999; van Knippenberg et al., Reference van Knippenberg, De Dreu and Homan2004).
The information elaboration/social categorization model (van Knippenberg et al., Reference van Knippenberg, De Dreu and Homan2004) integrates these two theories, highlighting the benefits of diverse information elaboration in networks with appropriate density on the one hand and the intra-organizational conflicts arising from social categorization processes caused by excessive diversity on the other. Previous studies classify diversity in functional and educational backgrounds as conducive to information elaboration (Bunderson & Van der Vegt, Reference Bunderson and Van der Vegt2018), whereas disparities in sex, ethnicity, and age are more closely linked to social categorization processes. van Knippenberg et al. (Reference van Knippenberg, De Dreu and Homan2004) demonstrate that each dimension of diversity may trigger both information elaboration and social categorization processes. Consequently, they advocate for considering a broader context in which diversity yields both advantages and challenges for team performance.
We thus obtain the following proposition:
Proposition: Network density and knowledge diversity have a curvilinear interactive effect on team innovation.
Another possible interpretation of our finding addresses the joint influence of two paradoxical functions rather than the isolated impact of a single function (Haans, Pieters, & He, Reference Haans, Pieters and He2016). While Haans and colleagues (Reference Haans, Pieters and He2016) primarily discuss the curvilinear relationship from the perspective of a single variable – albeit one exhibiting two opposing effects or functions – our study extends this framework by examining the curvilinear relationship between two variables through their interactive effect (cf. Li, Liu, Li, & Wang, Reference Li, Liu, Li and Wang2023).
Specifically, we propose that two opposing functions are at play: diversity and density. When a team leverages the benefits of combining diverse knowledge for innovation (van Knippenberg & Schippers, Reference van Knippenberg and Schippers2007), these benefits are typically accompanied by a sparse network structure (Granovetter, Reference Granovetter1985). However, this also interacts with the costs of knowledge diversity, which are associated with intra-team conflict (Jehn & Mannix, Reference Jehn and Mannix2001; Reagans & Zuckerman, Reference Reagans and Zuckerman2001; Tzabbar & Vestal, Reference Tzabbar and Vestal2015). These costs are often mitigated by the similarity and familiarity among network members fostered by a dense network (Granovetter, Reference Granovetter1973). Thus, both sparse and dense network structures exhibit both positive and negative effects on knowledge diversity.
Our exploratory results reveal that, at low to moderate levels of interaction between these two opposing forces, the positive benefits of combining diverse knowledge become more prominent, outweighing the inherent negative costs with the support of a mixed network structure (neither entirely sparse nor entirely dense). This process enhances team innovation by facilitating the assimilation of moderately diverse insights and expertise. During this phase, diversity and density reinforce each other’s effects on innovation. However, at moderate to high levels of interaction, the negative costs of knowledge diversity, such as intra-team conflict, become more salient, outweighing the positive benefits. This is exacerbated by a dense network structure, where intense intra-team conflict due to high knowledge diversity reduces team innovation. In this phase, diversity and density restrain each other.
This paradoxical perspective aligns closely with the concept of yin-yang balancing, which emphasizes the coexistence of conflicting yet complementary interrelations between paradoxical opposites. These opposites are both partially conflicting and partially complementary, thereby enriching and extending the paradox view (Li, Reference Li2014, Reference Li2016). The dual functions of knowledge diversity and network structure encapsulate both positive and negative features. In the initial phase, as knowledge diversity increases from low to moderate levels, the benefits of knowledge integration outweigh the costs of intra-team interplay. This effect is supported by a mixed network structure that is neither too sparse nor too dense, but moderately balanced. Conversely, in the latter phase, as knowledge diversity increases from moderate to high levels, the costs of intra-team interplay outweigh the benefits of knowledge integration. This is further exacerbated by a dense network structure, where high knowledge diversity leads to intense intra-team conflict.
These dual functions underscore the nuanced interplay between knowledge diversity and network density at the team level, offering a richer and more holistic understanding of their combined impact on team innovation. Accordingly, network density can enhance the positive effect of knowledge diversity on innovation up to a threshold. Beyond this threshold, however, the positive relationship between team knowledge diversity and network density turns negative. The perspective of yin-yang balancing helps explain our findings in SHAP values of the interactive effects of these two variables on team innovation, sometimes more reinforcing and other times more restraining. This is achieved through the mechanism of curvilinear balancing, which is one of three core mechanisms in the yin-yang balancing framework (Li et al., Reference Li, Liu, Li and Wang2023; Lin, Lu, Li, & Liu, Reference Lin, Lu, Li and Liu2015).
Methodological Contribution
Second, our work employs the ML inductive method – a combination of big data analysis and ML-based methods for robust induction (Shrestha et al., Reference Shrestha, He, Puranam and von Krogh2021; Wang & Li, Reference Wang, Li, (Edward) Wen and Ahmadian2019). This approach aids in exploring the most influential factors of training knowledge diversity and network structure, as well as their interplay in impacting team innovation. Subsequently, an interpretable AI method is employed to illustrate the curvilinear pattern of the interaction between these two variables.
Additionally, we visualize these effects in our exploration dataset using SHAP values, which illustrate the interactive effects of knowledge diversity and network structure as a 3D surface plot. This visualization makes it evident that network density positively moderates the impact of training diversity on collective outcomes when diversity is at a low level. However, when diversity is moderately high and combines effectively with medium network density, a team can achieve its highest level of innovation. Beyond this threshold, the two factors begin to restrain each other.
To optimize and quantify these interactive effects, we applied 3D surface fitting using Radial Basis Function (RBF) interpolation to smooth the SHAP interaction values. This technique generates a continuous surface, enabling the identification of peak points. To determine the exact combination of team training diversity and network density that maximizes innovation, we employed three optimization algorithms:
L-BFGS-B – A gradient-based method effective for bounded problems, capable of identifying local maxima on smooth surfaces.
Differential Evolution – A global optimization technique robust to non-convex and rugged landscapes, minimizing the risk of being trapped in local optima.
Basin Hopping – Combines global jumps with local optimization, enabling the discovery of multiple peaks across complex surfaces.
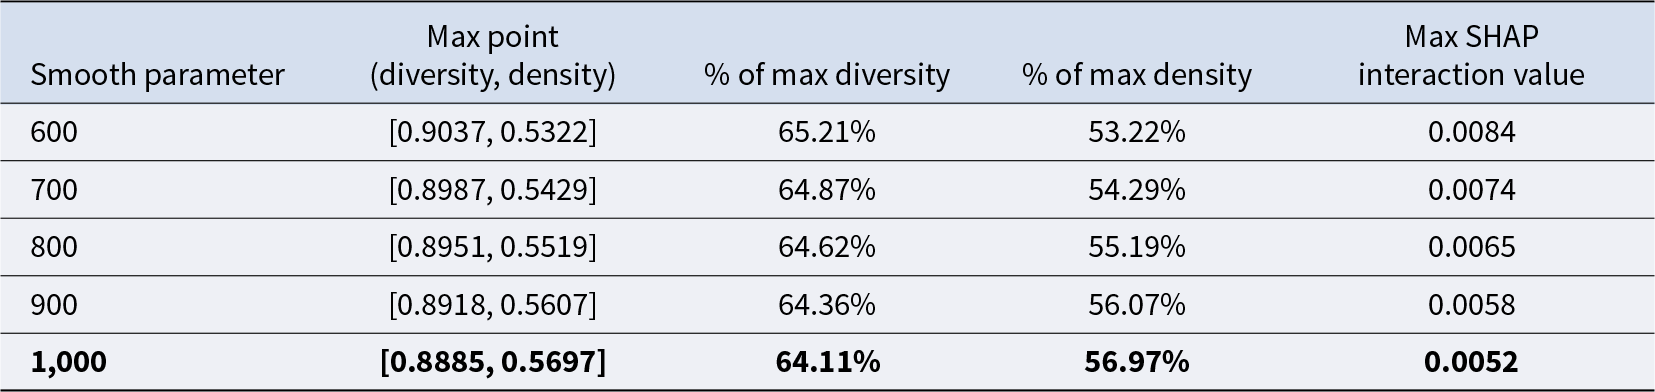
Through these experiments, we found that a smoothing parameter of 1,000 strikes an optimal balance between overfitting and underfitting. This parameter produced a sufficiently smooth surface to capture the underlying trend without being overly sensitive to noise in the data. At this smoothing level, our findings consistently indicate that moderately high levels of diversity (approximately 64% of the maximum, i.e., at the upper boundary of the middle one-third level) and medium density (57% of the maximum, i.e., near the midpoint) yield the highest innovation outcomes. This robust analysis underscores the importance of balancing diversity and density to maximize team performance in organizational contexts (refer to Table 3).
Robustness check results and distances from the original point

Notes: Distributions of Density (Mean = 0.441; SD = 0.476; Max = 1.0) and Team Training Diversity (Mean = 0.699; SD = 0.273; Max = 1.386).
To statistically validate the observed local maximum on the SHAP interaction surface (Team Training Diversity × Network Density), we also conducted a permutation-based significance test. Specifically, we permuted the SHAP interaction values 1,000 times and interpolated the SHAP value at the original peak location using RBF interpolation to form a null distribution. The observed peak interaction SHAP value significantly exceeded the 95% confidence interval of this null distribution [−0.0091,0.0038], resulting in a p-value of 0.01, thereby confirming the statistical validity of the observed local maximum.
This method aligns with the perspective of yin-yang balancing, as research can only explore local peaks under constrained information when two opposite forces sometimes reinforce more and other times restrain more (Li et al., Reference Li, Liu, Li and Wang2023; Lin et al., Reference Lin, Lu, Li and Liu2015). We can find the global peak by searching for and comparing local peaks under some boundary conditions.
Practical Implications
The findings of the research article suggest three key insights for management practices. First, the development of tools to evaluate and assess the impact of training programs on team innovation is imperative. When creating training programs to diversify knowledge, the influence of the network structure must be taken into account.
Second, the research suggests that the optimal point for team innovation is achieved with a medium level of density combined with a moderately high level of training diversity. These two opposite factors should be well-coordinated to reinforce each other and reach the highest level of innovativeness. When striving for the pinnacle of team innovation, it is crucial to note that an extremely high combination of diversity and density may lead to a mutual restraining effect, resulting in a less favorable overall outcome.
Third, the utilization of SHAP-value 3D plots and the L-BFGS-B method helps us identify the global peak of team innovation, which can be seen as a threshold for addressing the imbalance between team knowledge diversity and network density. In other words, from any given point, these two tools can indicate both the distance and the direction we need to pursue to enhance innovative performance. However, once this threshold is reached, the ‘too-much-of-a-good-thing’ effect occurs, and further efforts to increase either team knowledge diversity or network density become redundant.
In essence, our findings recommend that organizations aim for a balance, creating an environment conducive to fostering different perspectives while building intimate collaboration ties among members. By adjusting the combination of these two factors, organizations can effectively work together, remaining open-minded enough to explore external opportunities when necessary (Kirby et al., Reference Kirby, Tellegen and Steindl2017; Venkataramani & Tang, Reference Venkataramani and Tang2024).
Limitations and Future Research Directions
This research has several limitations. First, our sample is a representative knowledge-intensive technology firm in China, which emphasizes project-based innovation and knowledge learning from training programs. Because our study is based on a large-scale sample of organizational teams, the conclusions are likely generalizable to a wide range of similar organizations. However, future research is needed to examine whether these conclusions can be applied to different organizations in non-technology firms or various cultural contexts.
Second, some dynamic processes of innovation generation need to be considered. For example, different idea phases matter (Perry-Smith & Mannucci, Reference Perry-Smith and Mannucci2017). In the initial phase, more diversity and brainstorming are beneficial, but in the phase of reaching a conclusion, dense interaction and tight coordination are appreciated. To address this issue, we need project diaries to trace the development of innovative ideas, which poses a significant challenge for our future study.
Third, the temporal pace of receiving training courses matters too. In different idea phases, a team may absorb diversified knowledge from training programs for specific needs. However, our training diversity is computed from the texts of training programs, while our team knowledge diversity is a combined computation of members’ various backgrounds. Integrating these two data sources remains a challenge for us.
The fourth limitation is that we only consider training knowledge diversity with other types of team diversity as the control. Research on team training knowledge diversity is comparatively rare, and our study complements this shortcoming. Employee training-related policies are useful tools to promote team diversity. However, cognitive diversity from demographic and educational backgrounds as well as working experience, is also important for team innovation. The effect of diversity caused by new hires should also be taken into account. Only considering training knowledge diversity is not enough. Future studies should combine the diversities caused by training, new hiring, and team members’ various backgrounds together to investigate the emergence of team innovation.
The fifth limitation comes from our SHAP value plot in Figure 4. This interpretable AI method allows us to find the optimal combination of team training diversity and network density, but the mechanisms behind their optimal combination are not explored. Thus, further investigation into existing theories and more exploration of the dynamic process of the effects on team innovation is necessary. Particularly, a dynamic model, such as an agent-based model, may be very useful to delineate the optimal combination in more detail and give us a better prediction of the dynamic balance between these two opposing forces.
Furthermore, while our model integrates knowledge diversity and network density as structural predictors of team innovation, its moderate predictive performance (e.g., F1, AUC) may reflect the absence of key psychological and relational factors. Future research should incorporate variables such as team members’ attitudes, beliefs, and behavioral coordination, which likely mediate or moderate the effects of networks and diversity. In addition, modeling the transformation of individual inputs into collective innovation outcomes may benefit from agent-based or process-oriented approaches that capture the dynamic interplay between team learning mechanisms and organizational context.
This article is only the beginning of research into the mutually reinforcing and restraining effects of knowledge diversity and network density – two opposing forces – on team innovation. We hope that future related research continues to explore how micro-level elements can affect team outcomes, which is a valuable complement to our research.
Acknowledgments
We are grateful for the financial support of Tencent Research Institute Project ‘Research on identification of opinion leaders based on QQ big data,’ project number: 20182001706.
Data Availability Statement
The data that support the findings of this study are available on request from the corresponding author, Jar-der Luo (jdluo@mail.tsinghua.edu.cn). The data are not publicly available due to restrictions, as they contain information that could compromise the privacy of research participants and proprietary information from the participating company.
Appendix A
Team composition and duration summary for the original 2,202 teams

Team Size and Age Distribution: The teams exhibit moderate variation in size and age, with a maximum size of 51 and an average age of approximately 31 years.
Functional Roles: The distribution highlights the predominance of technical roles (68.25%), while production and design roles account for smaller proportions. Management and support roles remain limited.
Team Duration: Analysis of team longevity (starting from 2000) indicates an average duration of 3.69 years, with a maximum of nearly 6 years. This reflects team stability over time, with minimal variance across the dataset.
Pearson correlation table of all variables

*** Notes: ***: p < 0.001, **: 0.001 ≤ p < 0.01, *: 0.01 ≤ p < 0.05.
Appendix B
The robustness test includes the following steps:
1. Data Selection: We select data from the robustness-checking dataset, Sample 2.
2. Model Validation: The data is first used to compute accuracy measurements to test the validity of the best-predicted model. Then, the 10-fold cross-validation method is employed to assess the importance of all predictors in the model, verifying the use of explanatory variables and controls.
3. LASSO Regression: We conducted LASSO regression using the robustness-testing dataset (Sample 2, one-third of the full sample) to address potential multicollinearity and enhance model interpretability. This method focuses on feature selection and shrinkage, allowing us to identify the most influential predictors in the presence of high-dimensional data.
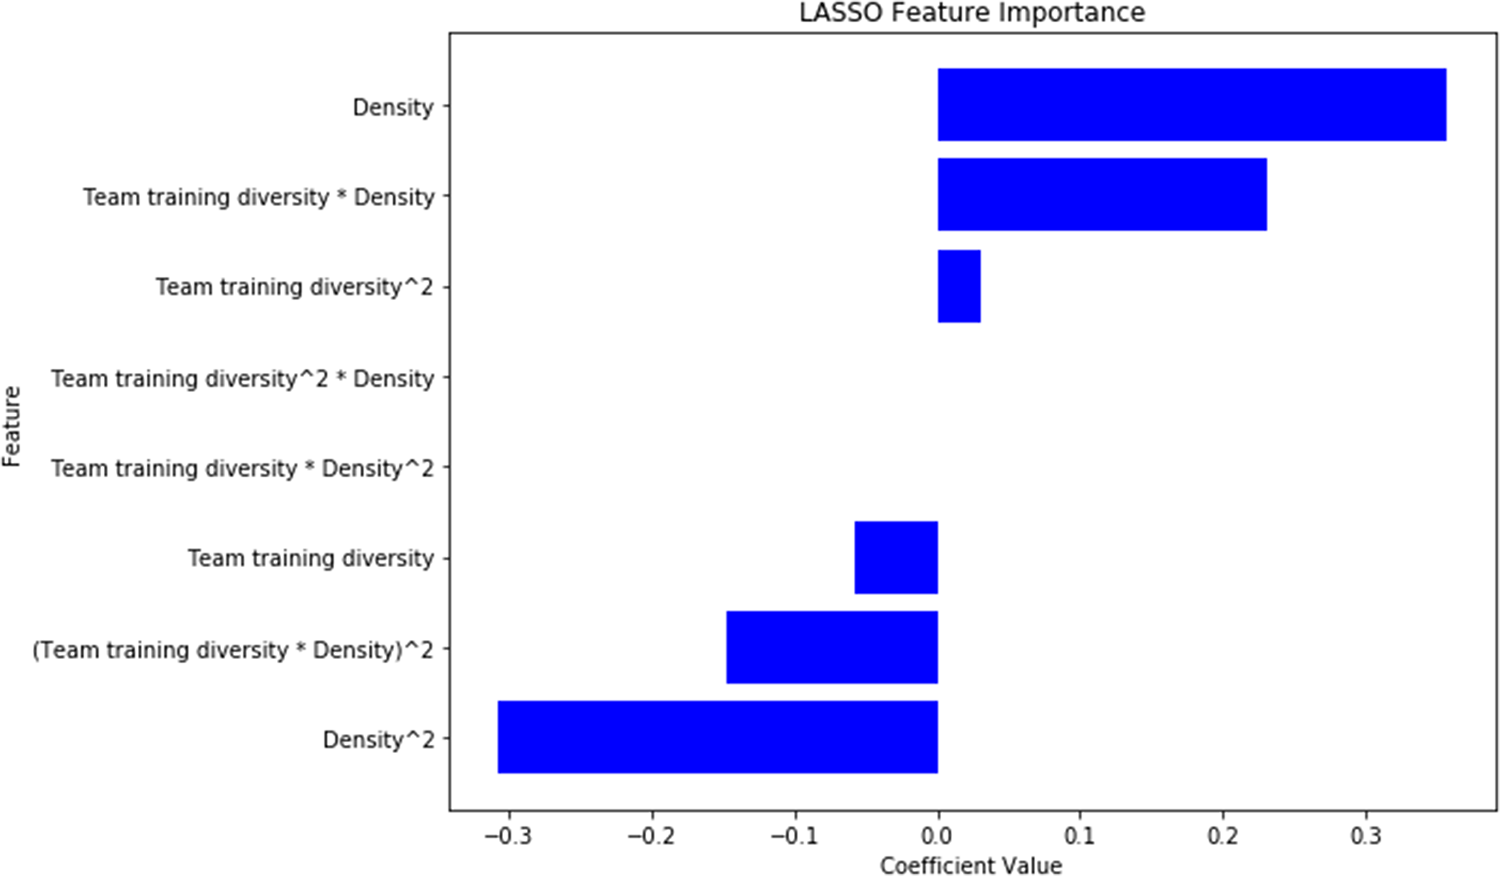
The results of the LASSO regression highlight the relative importance of diversity, density, and their interaction terms in predicting team innovation. A key finding is that (Team Training Diversity × Density)2 has negative coefficients, suggesting that extreme levels of both variables may hinder innovation.
These findings reinforce insights from the exploratory analysis, confirming the presence of complex curvilinear interactions between key predictors. By validating the feature importance and coefficients through LASSO regression, we ensure the robustness and generalizability of the identified relationships. This step further strengthens the theoretical and empirical contributions of our study.
Feature importance of the LASSO regression model

The LASSO regression results (Table B1) highlight the relative importance of predictors in explaining team innovation, with Density (0.3578) and Team Training Diversity × Density (0.2308) emerging as the most influential factors. However, curvilinear effects, such as Density2 (−0.3087) and (Team Training Diversity × Density)2 (−0.1471), suggest diminishing returns, where excessive levels of diversity and density inhibit innovation. These findings align with theoretical expectations that overly complex networks or excessively diverse knowledge bases can lead to inefficiencies, miscommunication, or redundancy.
LASSO regression results for innovation prediction

Notes: Coefficients represent the relative importance of features in predicting innovation; R-squared = 0.0438.
Key Findings: Negative Curvilinear Interactive Effects
The negative coefficients for higher-order terms, particularly (Team Training Diversity × Density)2, indicate that excessive diversity, when combined with dense networks, may create coordination challenges, reducing the team’s overall ability to innovate effectively. These findings underscore the importance of maintaining a balance between diversity and density in team composition to foster innovation.
Distinct Definitions of Interaction Terms
• Regression Interaction (A × B): Represents the direct linear multiplicative effect between variables. For example, the positive coefficient for Team Training Diversity × Density (0.2308) suggests that moderate levels of diversity and density jointly enhance innovation by leveraging complementary resources and perspectives.
• SHAP Interaction: Derived from game theory, SHAP interactions assess the marginal contributions of variable combinations across all data points. Unlike regression, SHAP captures curvilinear relationships, identifying complex synergies or suppressions that may not be apparent through linear modeling.
Key Implications
SHAP interactions excel at identifying complex, curvilinear relationships in machine learning models, offering nuanced perspectives on how variable combinations affect predictions. While regression interaction terms serve as foundational tools for hypothesis-driven analysis, SHAP interactions reveal hidden patterns that traditional regression may overlook.
SHAP and regression analyses are not interchangeable but complementary. SHAP explains marginal effects in curvilinear models, while regression focuses on fixed linear interactions. Together, these methods provide a more holistic understanding of innovation drivers, capturing curvilinear interactions essential for optimizing team composition strategies.
Conclusions: Holistic Insights into Team Innovation
Regression results validate foundational interactions, such as the positive effects of moderate diversity and density, while SHAP highlights hidden patterns and marginal effects of variable combinations on team innovation.
Together, these methods emphasize that innovation thrives under balanced conditions, where team diversity and network density are neither too low nor too high. These insights are critical for optimizing team composition strategies, ensuring that diversity and connectivity are managed effectively to maximize innovative outcomes.
In summary, the integration of SHAP and LASSO analyses underscores the importance of balancing diversity and density to optimize innovation. This multi-method approach not only confirms the robustness of our findings but also highlights the value of employing diverse analytical tools to capture the full spectrum of relationships in complex datasets.
Xin Gao (gaoxinxg@126.com) is an Assistant Professor at the School of Sociology and Anthropology, Xiamen University. Previously, she was a Postdoctoral Fellow at the Center for Tracking and Society in the Department of Communication at the University of Copenhagen. She earned her PhD in Sociology from Tsinghua University, with joint training at the Knowledge Lab at the University of Chicago and the Sino-German Institute for Social Computing at the University of Göttingen. Her research examines team innovation and organizational change by integrating organizational sociology with computational social science.
Jar-der Luo (jdluo@mail.tsinghua.edu.cn) is a Joint Appointed Professor, Social Science School and Public Administration School, Tsinghua University (Beijing), Chief Editor, Journal of Social Computing. He researches numerous topics in social network studies, including social capital, trust, social network in big data, network dynamics, emergence of collective intelligence, self-organization process, and Chinese indigenous management research, such as guanxi, guanxi circle, favor exchange, Yin and Yang, and dynamic balance theory.
Song Wang (wasofei@zju.edu.cn) is a Professor in the School of Management, Zhejiang University. She is the Fulbright visiting student (2011–2012) in the Sloan School of Management, Massachusetts Institute of Technology, and a Visiting Scholar (2018–2019) in Stanford Technology and Ventures Program, Stanford University. Her research interests include social networks and entrepreneurship. Her publications appear in the Academy of Management Journal, Journal of Organizational Behavior, Journal of Vocational Behavior, Journal of Business Ethics, etc.
Peter Ping Li (pli.int@cbs.dk) is a Visiting Chair Professor at Xiamen University and Dongbei University of Finance and Economics, China, and also a Professor of Chinese Business Studies at Copenhagen Business School, Denmark. His primary research focus is on building the geocentric (West-meeting-East) theories from the cultural and historical perspectives. He is regarded as one of the global thought leaders in the two fastest-growing areas: indigenous management research and emerging multinational firms.