Introduction
With advances in thin-film growth, atomic-level control of interfaces between dissimilar materials has reached an unprecedented level of sophistication. Thanks to the adoption of MgO-barrier magnetic tunnel junctions in hard-disk read-heads, wafer-scale mastery of oxide barriers a few atomic layers thick has been achieved. Coupled with the broad compatibility of the oxygen sublattices of different materials and the sensitivity of charge, spin, and orbital degrees of freedom on the atomic structure of the interface, this technical control has made oxide interfaces a playground for exploring phenomena that are absent in the bulk constituents. Reference Zubko, Gariglio, Gabay, Ghosez and Triscone1–Reference Bibes, Villegas and Barthélémy3 Many scientists are mesmerized by the unexpected phenomena that are emerging at the oxide interface.
The emergence and modification of magnetism at an interface is the topic of this overview. We consider both thin films and multilayers of oxides of d-block elements, but also thin films and interfaces between oxides with no magnetic cations. Broken spatial symmetry, strain, and rotation of oxygen octahedra required to accommodate differing lattice constants, atomic, or electronic reconstruction to restore local charge neutrality, and the associated electric fields will influence the magnetic order, as well as the charge or orbital order appearing in an interfacial region that may be as little as one or two atomic layer thick.
These thin films and multilayers are usually grown on an oxide substrate by means of a physical vapor technique such as pulsed-laser deposition, sputtering, e-beam evaporation, or molecular beam epitaxy, where the deposition temperature and oxygen pressure are far from ambient. A cap layer (e.g., Au) may be needed to protect the structure in air, but even a simple oxide thin film has two dissimilar upper and lower interfaces.
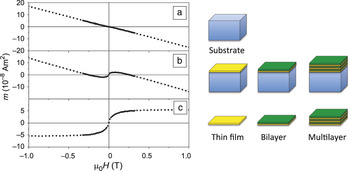
Materials scientists enjoy ready access to measurement techniques capable of detecting magnetic moments with a sensitivity better than 10–11 Am2. Reference Coey4 The moment of a 5 × 5 mm2 monolayer of ferromagnetically aligned atoms, each with a magnetic moment of one Bohr magneton (µB) on a square lattice with a cell size of 0.4 nm, is 1.5 × 10⁻⁹ Am2, so it is perfectly feasible to measure the magnetic moment of a fraction of a monolayer. This high level of sensitivity is a mixed blessing. Oxide substrates lack the purity of electronic-grade silicon, and most are intrinsically diamagnetic with a magnetic susceptibility, defined as the ratio of magnetization M to applied field H, of order –10–5 (see Table I ). In an applied field of 1 MAm–1 (equivalent to 1.25 Tesla), a 5 × 5 mm2 substrate, which is 0.5 mm thick, has an induced moment on the order of –10–7 Am2. Often this is greater in magnitude than the magnetic signal we wish to measure. The Curie law susceptibility of paramagnetic impurities, such as Fe2+ in MgO, which varies as 1/T, can dominate the low temperature response. Furthermore, the substrates themselves, either alone or in partnership with a thin film, may exhibit anomalous surface or interface magnetism. Reference Khalid, Setzer, Ziese, Esquinazi, Spemann, Pöppl and Goering5 Critical analysis of the influence of the substrate on the measured magnetic moments is indispensable in any serious magnetic investigation. Figure 1 illustrates the contributions that are involved in the analysis.
Magnetic susceptibility of insulating oxides. Units (SI) are 10–6.

Magnetization of (a) a blank diamagnetic substrate, (b) the substrate with an oxide thin film or heterostructure, and (c) the difference, which may be associated with the film alone or with the oxide/substrate interface.

Besides bulk magnetization measurements, other tests for magnetic moment like element-specific x-ray spectroscopies, especially x-ray magnetic dichroism measured in total electron yield, are highly informative. Reference Stohr and Anders6 Stray-field methods such as scanning superconducting quantum interference device (SQUID) Reference Bert, Kalisky, Bell, Kim, Hikita, Hwang and Moler7 and magnetic force microscopy Reference Bi, Huang, Bark, Ryu and Eom8 can provide spatial imaging of non-uniform magnetization distributions. Spin-polarized electronic structure calculations will help to pinpoint the origin of the magnetism at the edge.
Magnetic oxide films entered the limelight in the 1990s, after the high-T c superconductor boom had peaked. The electrical resistance of films of mixed-valence manganites was found to change dramatically in a magnetic field, an effect known as “colossal” magnetoresistance. Reference von Helmolt, Wecker, Holzapfel, Schultz and Samwer9 The idea of all-oxide spintronics, where ferromagnetic metal electrodes, insulating spacers, and spin filter layers are integrated into a functional device, began to take root. Oxides with a perovskite-type structure provide versatile building blocks for magnetic oxide heterostructures, Reference Bibes, Villegas and Barthélémy3 as we have the choice of a conducting band ferromagnet (SrRuO3; which orders magnetically at the Curie temperature, T c = 150 K), Pauli paramagnets (CaRuO3, LaNiO3), and hopping-electron ferromagnets (La0.7Sr0.3MnO3; T c = 340 K, La0.7Sr0.3CoO3; T c = 220 K), as well as insulating weak ferromagnets (LaMnO3; which orders magnetically at the Néel temperature, T N = 139 K) and antiferromagnets (LaFeO3; T N = 750 K). Some of the ferromagnets are half-metals (Sr2FeMoO6; T c = 415 K) with a gap at the Fermi level in one of the two spin-polarized sub-bands.
A further fillip arose when ferromagnetic behavior was observed at room temperature in thin films of nonmagnetic oxides doped with just a few percent of 3d ions such as Co2+, Mn2+, or V3+. Reference Matsumoto10 Even undoped films sometimes exhibited the effect Reference Venkatesan, Fitzgerald and Coey11 —the problem of d 0 magnetism. More recently, magnetism has been associated with the two-dimensional electron gas (2DEG) Reference Ohtomo and Hwang12 that can form at an interface of polar and nonpolar oxides, especially the 2DEG at the LaAlO3/SrTiO3 interface.
The existence and nature of the magnetism, and the principal magnetic interactions—exchange and anisotropy—depend on the electronic structure and are sensitive to film structure and thickness, symmetry, and strain. These quantities can be manipulated at the interface, with results that are often unanticipated and potentially useful.
Magnetic oxide thin films and heterostructures
Single oxide films
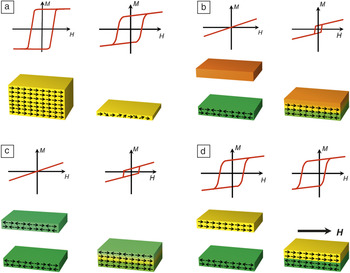
Interface magnetism presupposes a well-defined, albeit structurally imperfect interface. Synthesis of ultrathin films is a limiting test of perfection. When it is clean enough morphologically, the film has two continuous interfaces, one of which may be vacuum or air. The interfaces are not independent—they are coupled in some way. Quantum confinement (see the article by Stemmer and Millis in this issue) is a common form of coupling, but electric polarization can also couple interfaces at larger separations. A summary of some of the changes in magnetism found in thin films and heterostructures is given in Figure 2 .
Schematic magnetic structures and hysteresis loops of thin films and heterostructures. (a) Change of magnetic order when the conducting bulk ferromagnet La-0.7Sr0.3MnO3 is made into an ultrathin insulating film. (b) A bilayer of a Pauli paramagnet (CaRuO3) and an insulating antiferromagnet (CaMnO3) becomes ferromagnetic at the interface. (c) A bilayer of two antiferromagnets LaMnO3 and LaCrO3 becomes ferromagnetic at the interface. (d) Exchange coupling in a bilayer between a ferromagnet and an antiferromagnet produces a loop shift of the ferromagnet (exchange bias).

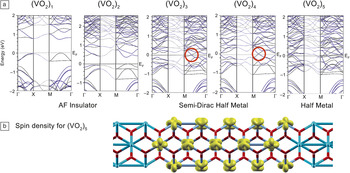
A consequence of quantum confinement can be a metal-insulator transition with changing film thickness. Explanations as to why films of an oxide that is metallic in bulk form (LaNiO3, for example) may become insulating when they are only a few unit cell layers thick Reference Scherwitzl, Gariglio, Gabay, Zubko, Gibert and Triscone13 or confined between layers of an insulator (LaAlO3, for example) Reference Blanca-Romero and Pentcheva14 include the following: (1) The bandwidth in the perpendicular direction vanishes, increasing electron correlation effects; (2) 3d crystal field degeneracy is lifted by the lower symmetry; and (3) strain and structural distortions alter the electronic structure. Such a change of electronic properties upon reducing the number of layers has been studied in SrVO3/STiO3 Reference Pardo and Pickett15,Reference Kim, Kim, Kang, Noh, Lee, Lee and Lee16 and in VO2/TiO2 Reference Pardo and Pickett17 ( Figure 3 ). These changes will naturally modify the magnetic properties. Reference Scherwitzl, Gariglio, Gabay, Zubko, Gibert and Triscone13
(a) Majority spin band structures of m = 1 to 5 unit cells of VO2 encased by TiO2 (001), illustrating the progression from ferromagnetic insulator (m = 1 and 2), through “semi-Dirac” half metal (m = 3 and 4) to half metal at m ≥ 5. The semi-Dirac phases have 2D point Fermi surfaces such as graphene, highlighted by the red circles, where the dispersion is linear (“massless”) along the ⟨1,1⟩ directions, but is quadratic (“massive”) along a perpendicular line through the crossing point. Each added layer brings in more V 3d bands in the vicinity of the Fermi level, which eventually results in metallic behavior. (b) Surfaces of equal spin density (equal to the charge density since there is full polarization on each V d Reference Zubko, Gariglio, Gabay, Ghosez and Triscone1 ion) illustrating the different orbital polarization in the first, second, and subsequent V layers from the TiO2 interface. Figure adapted with permission from Reference 21.

A good example is the ever-popular mixed-valence manganite La0.7Sr0.3MnO3, a conducting ferromagnet in bulk form with a Curie temperature of T c = 370 K. Thin films of this manganite are insulating, Reference Huijben, Martin, Chu, Holcomb, Yu, Rijnders, Blank and Ramesh18 and when deposited on SrTiO3 (110) in thicknesses less than 10 unit cells (4 nm), they have a noncollinear, canted spin structure with T c = 540 K. Reference Boschker, Kautz, Houwman, Siemons, Blank, Huijben, Koster, Vailionis and Rijnders19 Even higher Curie temperatures (650 K) are achieved by strain control of e g orbital occupancy in superlattices with BaTiO3. Reference Sadoc, Mercey, Simon, Grebille, Prellier and Lepetit20 Strain introduced by an appropriate choice of substrate can be propagated in a superlattice.
Interface symmetry lowering and quantum confinement lead to orbital polarization at the interface, arising from the lifting of the orbital degeneracy of the d electrons. The effect is distinct from orbital ordering due to spontaneous symmetry breaking. Orbital polarization is crucial for interfacial magnetism; it influences which bands are occupied, their widths, and the strength and character of the magnetic coupling. It is directly observable by x-ray linear dichroism or angle-resolved photoelectron spectroscopy.
When a complex combination of d orbitals is occupied, the orbital polarization may give rise to an orbital moment. A representation with an angular momentum quantum number L = 1 of the t 2g orbitals in trigonal symmetry is
 $$\left| {{\Psi _m} > } \right. = {{\left( {\left. {\zeta _m^0} \right|{d_{xy}} > + \left. {\zeta _m^1} \right|{d_{yz}} > + \left. {\zeta _m^2} \right|{d_{zx}} > } \right)} \mathord{\left/ {\vphantom {{\left( {\left. {\zeta _m^0} \right|{d_{xy}} > + \left. {\zeta _m^1} \right|{d_{yz}} > + \left. {\zeta _m^2} \right|{d_{zx}} > } \right)} {\sqrt 3 }}} \right. \kern-\nulldelimiterspace} {\sqrt 3 }};\;{\zeta _m} = {e^{{{2\pi im} \mathord{\left/ {\vphantom {{2\pi im} 3}} \right. \kern-\nulldelimiterspace} 3}}}.$$
|Ψm = 0> is the real combination with a 1g symmetry and zero magnetic quantum number, but the others, |Ψm = ±1>, are two complex combinations, which may possess an unusually large orbital moment and give rise to exotic ordered states. Such surprises emerged in first-principles calculations, initially for VO2 (001) thin films confined within TiO2, where a 3d Reference Zubko, Gariglio, Gabay, Ghosez and Triscone1 orbital moment of 0.2 μB appears on the V4+ions. Reference Pardo and Pickett21 Orbital moments on 3d ions are normally an order of magnitude smaller than this. When SrVO3, a correlated metal in the bulk, is confined between SrTiO3 (001) layers, the predicted moment for the interfacial V4+ is huge, 0.75 μB Reference Pardo and Pickett15 and unprecedented even in 5d oxides, where spin-orbit coupling is much larger but quenching effects are also increased. The largest effects are expected for a single t 2g electron or hole. Consequences of the orbital moments include large interfacial magnetocrystalline anisotropy and magnetic coupling that is governed by the total angular momentum of the ion J, rather than the spin angular momentum S.
A different principle is illustrated by ZnFe2O4. Zinc ferrite is an insulating, fully frustrated antiferromagnet in the bulk, wherein zinc and iron cations occupy different sublattices in the spinel structure; the spin freezing temperature is 10 K. Thin films, however, have a more random cation distribution with antiferromagnetic intersublattice exchange, and they are conducting canted ferrimagnets with a Curie temperature of 600 K. Reference Chen, Spoddig and Ziese22 In this case, it is the bulk material that is insulating and the thin films that are conducting.
Interface mismatch between materials with different magnetic character is the basis of spintronics. An ultrathin ferromagnetic insulating film between two normal metals provides a spin filter tunnel junction. Reference Lüders, Bibes, Bouzehouane, Jacquet, Contour, Fusil, Bobo, Fontcuberta, Barthélémy and Fert23 The different energy gaps seen by ↑ and ↓ electrons tunneling through the insulating ferromagnetic barrier can provide vastly different tunneling rates, resulting in a spin polarized current. Nonmagnetic oxide barriers are used with ferromagnetic electrodes in conventional magnetic tunnel junctions, most notably Fe/MgO/Fe (001).
Magnetic bilayers and multilayers
Coupling between thin films of magnetically ordered oxides can lead to the emergence of unanticipated magnetic alignments. An example is the interface between the antiferromagnetic insulators LaFeO3 and LaCrO3, Reference Ueda24 where ferromagnetic Fe3+-O2-Cr3+ superexchange coupling leads to a ferromagnetic interface layer. Other examples are the magnetic interfaces between antiferromagnetic insulating CaMnO3 and paramagnetic metallic CaRuO3, Reference Takahashi, Kawasaki and Tokura25 and between antiferromagnetic LaMnO3 and diamagnetic SrTiO3, Reference Garcia-Barriocanal, Cezar, Bruno, Thakur, Brookes, Utfeld, Rivera-Calzada, Giblin, Taylor, Duffy, Dugdale, Nakamura, Kodama, Leon, Okamoto and Santamaria26 where charge transfer across the interface is responsible.
Exchange bias is a very useful effect that arises when a ferromagnetic film has its magnetization direction stabilized by coupling to an adjacent antiferromagnetic film. This functionality has played a critical role in stabilizing magnetoresistive read-heads and, more recently, memory based on magnetic tunnel junctions. The effect arises provided the Curie temperature of the ferromagnet exceeds the Néel temperature of the antiferromagnet, T c > T N. Then when the system is field-cooled through a “blocking temperature,” which is lower than T N, the ferromagnetic layer becomes biased with an easy axis along the field direction, as evidenced by a shift of the hysteresis loop, whose midpoint is displaced from zero by an amount H EB (Figure 2d). Use of exchange bias in technology requires structural and chemical compatibility between the ferromagnetic and the antiferromagnetic layers. Compatible couples will be needed for all-oxide spintronics.
The common antiferromagnetic oxide NiO was used to bias early spin valves. The recent observation of exchange bias in LaNiO3/LaMnO3 superlattices Reference Gibert, Zubko, Scherwitzl, Iñiguez and Triscone27 is unusual. LaNiO3 is not magnetically ordered in the bulk, although all other rare-earth nickelates have insulating antiferromagnetic ground states. The exchange bias in this case is suspected to arise due to induced antiferromagnetism in the LaNiO3 at the interface. Electronic and magnetic structure calculations, including correlation effects, confirmed the strong impact of the interface on magnetic alignment and on the size of moments. Reference Gibert, Zubko, Scherwitzl, Iñiguez and Triscone27
A convincing understanding of exchange bias has been slow to emerge, even in metals. Reference Kiwi28 The evidence suggests it is a complex phenomenon affected by strain, defects, antiferromagnetic domain size, the microscale magnetic structure, interface geometry, and other factors.
Dilute magnetic oxides and d 0 magnetism
It has been known for over a decade that thin films of transparent oxides such as TiO2, ZnO, SnO2, and HfO2 may show signs of high-temperature ferromagnetism. Reference Coey, Tsymbal and Žutić29 This effect is absent in well-crystallized, defect-free films. Reference Chambers30 At first, the magnetism was associated with doping with 3d cations, and the films were regarded as uniformly magnetized dilute magnetic semiconductors where the dopant cations are coupled ferromagnetically by spin-polarized conduction electrons. Reference Ando31 This view has turned out to be mistaken, for several reasons. A search for magnetic order, based on element-specific techniques such as x-ray magnetic dichroism Reference Tietze, Gacic, Schütz, Jakob, Brück and Goering32 and Mössbauer spectroscopy Reference Coey, Stamenov, Gunning, Venkatesan and Paul33 failed to find it for the dopants, which remain paramagnetic. Analysis of the magnetization curves in terms of dipolar interactions Reference Coey, Mlack, Venkatesan and Stamenov34 indicated that only a few percent of the film volume is magnetically ordered, although the magnetization of this small fraction was comparable to that of nickel. Furthermore, analysis of the magnetic moment as a function of film thickness failed to reveal any clear relation between the moment and the thickness of the film. Values of the areal moment density on the order of 100–200 µB nm–2 in the oxide films are common. Reference Coey, Tsymbal and Žutić29 As there are about 15 atoms per nm Reference Hwang, Iwasa, Kawasaki, Keimer, Nagaosa and Tokura2 , this indicates that the moment is distributed over at least several unit cells from the interface.
It is unfortunate that much effort was devoted to Co-doped ZnO films in these studies, because cobalt is the element with the highest Curie temperature. Cobalt nanoclusters tend to form in the wurtzite lattice, and they are a potential source of the observed magnetism in these films. Reference Coey, Tsymbal and Žutić29 A better choice of dopant would have been Sc or V, since these elements do not form high-temperature ferromagnetic phases.
One reason for the decline of interest in thin films of dilute magnetic oxides has been the lack of a generally accepted, nontrivial explanation of the phenomenon. Both the origin of the moment and a mechanism of exchange coupling that would produce high-temperature ordering between distant moments are perplexing. While it is easy to detect very small magnetic moments, it is important to pinpoint the source of magnetism, whether in the film or in the substrate near the interface. Progress has been hampered by problems with reproducibility of the results. The magnetism often depends on uncontrolled aspects of film synthesis, which influence the defect content; quantitative results differ from group to group, and even from run to run in the same laboratory.
Defects seem to be the critical factor. Cation vacancies that create strongly correlated holes on the surrounding 2p oxygen ions have been suggested as a source of magnetism. Reference Elfimov, Yunoki and Sawatzky35 The behavior of Ta-doped TiO2 has been discussed in these terms. Reference Rusydi, Dhar, Barman, Ariando, Qi, Motapothula, Yi, Santoso, Feng, Yang, Dai, Yakovlev, Ding, Wee, Neuber, Breese, Ruebhausen, Hilgenkamp and Venkatesan36 Nitrogen substitution for oxygen has a similar effect. Reference Elfimov, Rusydi, Csiszar, Hu, Hsieh, Lin, Chen, Liang and Sawatzky37 An alternative suggestion is that oxygen vacancies, which trap electrons to create F-centers, are principally involved. Reference Coey, Tsymbal and Žutić29
A different model associates the magnetization with electrons in a defect-based impurity band that occupies only a small fraction of the sample volume. Reference Edwards and Katsnelson38 The density of states of this band can have a maximum near the Fermi level, and split spontaneously if the Stoner model criterion is satisfied. Reference Coey4 The role of the 3d dopants in this case is only to act as an electron reservoir, exchanging electrons with the impurity band, provided the 3D ions coexist in two different valence states. Reference Coey, Stamenov, Gunning, Venkatesan and Paul33
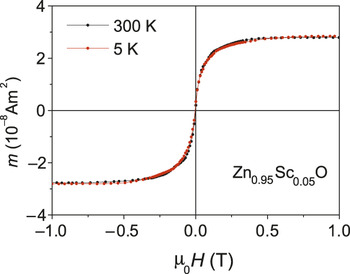
There are many experimental reports of ordered magnetism in films of oxides with no magnetic doping. Reference Venkatesan, Fitzgerald and Coey11,Reference Coey, Tsymbal and Žutić29 When the effect is not directly attributable to the substrate Reference Khalid, Setzer, Ziese, Esquinazi, Spemann, Pöppl and Goering5 or an obvious impurity phase, it can be discussed in terms of one of these models. The magnetic response looks like that of an anhysteretic soft ferromagnet. It is remarkable that after correction for the background diamagnetism, as shown in Figure 1, the saturation magnetization is often found not to vary with temperature between 4 K and 300 K. This behavior is illustrated for Sc-doped ZnO in Figure 4 . This lack of temperature dependence suggested ferromagnetism with an exceedingly high Curie temperature (high energy scale), which is compatible with a half-metallic impurity band where spin-wave excitations are suppressed. Reference Edwards and Katsnelson38
Magnetization of a typical d 0 material, a thin film of zinc oxide doped with scandium. The magnetization curves measured at temperatures between 4 K and 300 K exhibit a ferromagnetic-like saturation, with magnetization curves that superpose, after correction for the high-field slope. Figure adapted with permission from Reference 66.

A quite different view is that these peculiar systems are not ferromagnetic at all, but rather that the magnetic response is a manifestation of giant orbital paramagnetism. Reference Hernando, Crespo, García, Coey, Ayuela and Echenique39 A new theory of the phenomenon Reference Coey, Ackland and Sen40 predicts saturation as
 $$m = {{{m_0}\,x} \mathord{\left/ {\vphantom {{{m_0}\,x} {{{\left( {1 + {x^2}} \right)}^{{1 \mathord{\left/ {\vphantom {1 2}} \right. \kern-\nulldelimiterspace} 2}}}}}} \right. \kern-\nulldelimiterspace} {{{\left( {1 + {x^2}} \right)}^{{1 \mathord{\left/ {\vphantom {1 2}} \right. \kern-\nulldelimiterspace} 2}}}}},$$
where x is a ratio of energies, one of them proportional to the applied field, which does not depend on temperature. Unlike a Langevin function where the initial susceptibility varies as 1/T, which would be an indication of superparamagnetism, there is no temperature dependence in this model, in agreement with experimental observations.
Magnetism at interfaces of nonmagnetic oxides
Finally, we turn to the emergence of conductivity and magnetism at the interface of two nonmagnetic insulators. Reference Millis41 Electronic reconstruction needed to create a uniform electric field in the polar oxide and avoid polarization catastrophe Reference Nakagawa, Hwang and Muller42 accounts for the appearance of a 2DEG at the interface between TiO2-terminated SrTiO3 and LaAlO3. LaAlO3 consists of a polar stack of positively charged (LaO)+ and negatively charged (AlO2)– layers along the (100) direction, while the layers in SrTiO3 have no intrinsic charge dipole. A net electric field and diverging electrostatic energy due to the dipole layers in LAO are avoided by transferring 0.5 electrons per unit cell from the upper surface of LaAlO3 to the Ti 3d band in SrTiO3 at the interface (see the article by Hilgenkamp in this issue). The n-type interface conductivity of the 2DEG is sensitive to oxygen vacancy creation during growth, Reference Kalabukhov, Gunnarsson, Börjesson, Olsson, Claeson and Winkler43 cation intermixing at the interface, Reference Willmott, Pauli, Herger, Schlepütz, Martoccia, Patterson, Delley, Clarke, Kumah, Cionca and Yacoby44 and strain. Reference Bark, Felker, Wang, Zhang, Jang, Folkman, Park, Baek and Zhou45 Both charge transfer and oxygen vacancies may be necessary. Reference Liu, Li, Lü, Huang, Huang, Zeng, Qiu, Huang, Annadi, Chen, Coey, Venkatesan and Ariando46 The cation stoichiometry of the LaAlO3 grown on SrTiO3 is also found to influence the conducting behavior. Reference Breckenfeld, Bronn, Karthik, Damodaran, Lee, Mason and Martin47,Reference Warusawithana, Richter, Mundy, Roy, Ludwig, Paetel, Heeg, Pawlicki, Kourkoutis, Zheng, Lee, Mulcahy, Zander, Zhu, Schubert, Eckstein, Muller, Hellberg, Mannhart and Schlom48
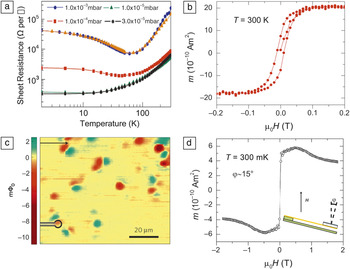
The first suggestions of a ferromagnetic state at this interface came from calculations that considered charge order with orbital polarization of the electrons occupying d xy states on alternate Ti sites in an interface layer—a ¼-filled band, Reference Pentcheva and Pickett49 similar to that calculated for the LaTiO3/SrTiO3 interface. Reference Okamoto, Millis and Spaldin50 Experiments Reference Brinkman, Huijben, van Zalk, Huijben, Zeitler, Maan, van der Wiel, Rijnders, Blank and Hilgenkamp51 then revealed magnetic hysteresis in the sheet resistance, measured at 0.3 K, as well as a resistivity minimum at about 50 K that was tentatively ascribed to Kondo scattering of the conduction electrons by magnetic ions ( Figure 5 ).
Evidence for magnetism of the two-dimensional electron gas at the LaAlO3/SrTiO3 interface. (a) Resistance showing a minimum associated with Kondo scattering for samples deposited at various oxygen pressures. Figure adapted with permission from Reference 51. (b) Magnetic moment measured with SQUID-VSM. Figure adapted with permission from Reference 52. (c) Direct imaging of a magnetic stray field using a scanning SQUID microscope. Figure adapted with permission from Reference 7. (d) Moment detected by torque magnetometry. Figure adapted with permission from Reference 54.

This observation of magnetic character at the interface of non-magnetic oxides has stimulated much interest and ongoing controversy. Films grown at high oxygen pressures Reference Ariando, Wang, Baskaran, Liu, Huijben, Yi, Annadi, Barman, Rusydi, Dhar, Feng, Ding, Hilgenkamp and Venkatesan52 have been found to induce electronic phase separation at the interface, with the coexistence of a ferromagnetic phase, which persists to room temperature (Figure 5), and a superconducting-like diamagnetic phase below 60 K. These different phases may be associated with the selective occupancy of the Ti 3d sub-bands at the interface, arising from symmetry breaking that lifts their degeneracy. Further evidence for coexisting superconductivity and magnetism came from transport measurements Reference Dikin, Mehta, Bark, Folkman, Eom and Chandrasekhar53 and torque magnetometry. Reference Li, Richter, Mannhart and Ashoori54 Direct imaging using a scanning SQUID probe (Figure 5) Reference Bert, Kalisky, Bell, Kim, Hikita, Hwang and Moler7 revealed ferromagnetic and superconducting puddles a few microns in size, but it was concluded that the ferromagnetism did not require mobile electrons. Reference Kalisky, Bert, Klopfer, Bell, Sato, Hosoda, Hikita, Hwang and Moler55 These observations beg the question of whether the 2DEG is intrinsically ferromagnetic, Reference Michaeli, Potter and Lee56 or if the ferromagnetism is somehow associated with oxygen vacancies or other defects near the interface. Reference Pavlenko, Kopp, Tsymbal, Mannhart and Sawatzky57
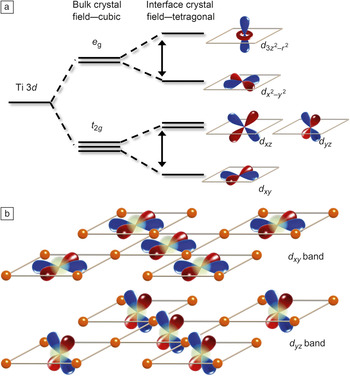
In Figure 6 , we illustrate the effect of crystal field splitting of the d orbitals; the t 2g and e g orbitals are separately degenerate in octahedral symmetry. However, near the interface, tetragonal symmetry partly lifts the degeneracy, and in-plane d xy orbitals may have lower energy than out-of-plane d xz, d yz orbitals. The first available states at the interface, according to measurements of x-ray linear dichroism Reference Salluzzo, Cezar, Brookes, Bisogni, De Luca, Richter, Thiel, Mannhart, Huijben, Brinkman, Rijnders and Ghiringhelli58 and electronic structure calculations, Reference Popović, Satpathy and Martin59 are d xy. A ferromagnetic moment of ∼0.1µB per Ti has been associated with these oxygen-hybridized Ti d xy orbitals using surface-sensitive x-ray magnetic dichroism measurements. Reference Lee, Xie, Sato, Bell, Hikita, Hwang and Kao60 Quenching of the magnetism upon annealing in oxygen suggests that oxygen vacancies have a decisive influence. Reference Salluzzo, Gariglio, Stornaiuolo, Sessi, Rusponi, Piamonteze, De Luca, Minola, Marr, Gadaleta, Brune, Nolting, Brookes and Ghiringhelli61
(a) Schematic of the one-electron Ti 3d orbitals, which are occupied near the interface in SrTiO3. The cubic crystal field due to the surrounding oxygen octahedron splits the t 2g and e g states, and further splitting of the t 2g states arises from the local tetragonal symmetry at the LaAlO3/SrTiO3 interface. (b) The d xy orbitals form a two-dimensional in-plane band, and the d yz and d xz orbitals form orthogonal one-dimensional bands.

The effective interface volume in a sample can be enhanced by one to two orders of magnitude by using a multilayer, although it should be emphasized that thin films and bulk crystals are not identical. The bandgap in thin-film SrTiO3 is 0.6 eV greater than the single-crystal value. Reference Bao, Yao, Wakiya, Shinozaki and Mizutani62,Reference Panomsuwan, Takai and Saito63 Small-angle polarized neutron reflectometry Reference Fitzsimmons, Hengartner, Singh, Zhernenkov, Bruno, Santamaria, Brinkman, Huijben, Molegraaf, de la Venta and Schuller64 has set a limit on the interface moment of about 0.3 µB per two-dimensional unit cell for LaAlO3/SrTiO3 multilayers, which might be spread over several layers. Larger moments were found in direct magnetic measurements of the samples, which include any contributions that arise from the substrate. Reference Fitzsimmons, Hengartner, Singh, Zhernenkov, Bruno, Santamaria, Brinkman, Huijben, Molegraaf, de la Venta and Schuller64
By tuning the electron density at the oxide interface using a top gate while imaging the sample by magnetic force microscopy, Reference Bi, Huang, Bark, Ryu and Eom8 it was demonstrated that room-temperature ferromagnetism appears as the electrons in the conduction band were depleted. The conduction electron spins align antiparallel to the magnetization, destabilizing magnetic order as the conductive state is reached. Gate control of ferromagnetism at the oxide interface opens a new vista for spintronic applications.
Magnetism at this interface has spurred various theoretical suggestions of its origin, most agreeing that the magnetic electrons reside in Ti 3d t 2g orbitals. One view is that a layer of localized d xy electrons at the interface Reference Michaeli, Potter and Lee56,Reference Salluzzo, Cezar, Brookes, Bisogni, De Luca, Richter, Thiel, Mannhart, Huijben, Brinkman, Rijnders and Ghiringhelli58,Reference Lee, Xie, Sato, Bell, Hikita, Hwang and Kao60 is magnetically coupled by mobile electrons in the d xz, d yz bands, while other data suggest that itinerant electrons are unnecessary, or ineffective, in coupling the local moments. For an intrinsic, electronically reconstructed interface, first-principles calculations indicate a ground state of d xy moments coupled by direct exchange, Reference Pentcheva and Pickett49 though this is unlikely to account for high-temperature ferromagnetism. Another view is that localized Ti e g spins induced by neighboring oxygen vacancies result in ferromagnetic order. Reference Pavlenko, Kopp, Tsymbal, Mannhart and Sawatzky57 A different idea is that the magnetism is itinerant Reference Chen and Balents65 and appears at low occupancy of quasi-one-dimensional d xz, d yz orbitals via the Stoner mechanism, which leads to spin splitting of bands when the density of states at the Fermi level is sufficiently high. Reference Coey4 Another viewpoint is that the magnetism arises within a narrow impurity band comprised of oxygen vacancy-related orbitals, which are unstable with respect to Stoner splitting.
More systematic study of the magnitude of the magnetization, Curie temperature, and dependence on interface perfection and orientation, including oxygen vacancies and electron density, is required to resolve many of these controversial issues. A cogent question is: why have the 2DEG and emergent interface magnetism only been found in SrTiO3? The magnetism seems very likely to be related to the availability of Ti 3d states highly susceptible to moment formation, while the 2DEG may be related to the feature, unusual for any oxide, such that an electron density of 10–4/cell in the bulk results in high-mobility conducting behavior (and superconductivity).
Conclusions
Reduced dimensionality, broken symmetry, quantum confinement, and strain can all transform the electronic structure of 3d oxide films that are magnetically ordered in the bulk, leading to large changes in anisotropy, exchange interactions, and orbital moments on the 3d ions. The resulting changes in magnetic order can probably be understood within the established paradigm, but the complexity of both the phenomena and the materials is much greater than for bulk oxides.
Understanding the magnetism of thin films of broad-bandgap insulators, whether undoped or lightly doped with 3d ions, is more of a challenge. Magnetic order of the dopant spins is not necessary to observe the ferromagnetic-like magnetic saturation, and defects such as cation or oxygen vacancies appear to play a key role in what appears to be an interface phenomenon. The energy scale is unusually high by the standards of conventional exchange in oxides. There is a need for a common system with improved experimental reproducibility, which everyone can study.
The interface between polar and nonpolar insulators is a new frontier for magnetism. Whereas the electronic properties of the 2DEG at the LaAlO3/SrTiO3 interface are rather reproducible, the relatively few measurements of Curie temperature and magnetization yield scattered results. The contributions of interfacial defects and the oxide substrate to magnetism at the edge need to be disentangled, if this is indeed possible. With increasing use of surface-sensitive measurement techniques and improved control of the oxide stoichiometry and defect content, it should become clearer what new physics is involved.
Opportunities are now emerging to design, create, and exploit exotic magnetic oxide devices with novel functionality using the first group of materials, which are magnetically ordered in the bulk. For the other two groups, thin films and interfaces, there is still some way to go to establish reproducible results.
Acknowledgments
J.M.D.C. acknowledges support from Science Foundation Ireland Grant 10/IN1.13006 and from the EU FP7 IFOX Project. Ariando acknowledges support from the National Research Foundation of Singapore Grant NRF2008NRF-CRP002-024. W.E.P. acknowledges support from the US Department of Energy Award DE-F602-04ER46111.