1. Introduction
Nowadays, an increasing number of applications rely on the accurate prediction of nucleate boiling heat transfer. These applications include traditional cooling applications such as heat exchangers, heat pipes (Srimuang & Amatachaya Reference Srimuang and Amatachaya2012), nuclear power plants (Tong Reference Tong1967; Theofanous et al. Reference Theofanous, Liu, Additon, Angelini, Kymäläinen and Salmassi1997), diesel engines (Kroes, Van der Geld & Van Velthooven Reference Kroes, Van der Geld and Van Velthooven2009) and equipment in space (Celata et al. Reference Celata, Colin, Colinet, Di Marco, Gambaryan-Roisman, Kabov, Kyriopoulos, Stephan, Tadrist and Tropea2008). In addition, the technological revolution of the past 60 years has placed emphasis on cooling of microelectronics, which over time become smaller and more powerful, increasing the heat generated by these components exponentially. This development has sparked a large amount of interest in the areas of microchannel cooling (Kandlikar Reference Kandlikar2002; Thome Reference Thome2004), micro heat pipes (Ma Reference Ma2008) and spray cooling (Rini, Chen & Chow Reference Rini, Chen and Chow2002; Horacek, Kiger & Kim Reference Horacek, Kiger and Kim2005), generally referred to as MTMS (microthermomechanical systems). Interestingly, bubble generation is also being increasingly employed in non-cooling applications. Famous and widely used are thermal ink-jet printers which eject ink droplets by microbubble generation in the printhead (Le Reference Le1998). Other examples of this type of application include MEMS (microelectromechanical systems) such as micro-actuators (Lin & Pisano Reference Lin and Pisano1994), micro-pumps (Tsai & Lin Reference Tsai and Lin2002), micro-valves (Papavasiliou, Liepmann & Pisano Reference Papavasiliou, Liepmann and Pisano1999) and bioparticle actuators (Maxwell et al. Reference Maxwell, Gerhardt, Toner, Gray and Schmidt2003).
Although nucleate boiling is applied in many technologies, several comparative studies (Kroes et al. Reference Kroes, Van der Geld and Van Velthooven2009; Moghaddam & Kiger Reference Moghaddam and Kiger2009b ) have shown that the predictive capability of the existing models for nucleate boiling heat transfer is rather poor. Only an understanding of the microscale physics, such as the heat transfer mechanisms on growing vapour bubbles, can lead to more accurate models. An overview of models for nucleate boiling and the involved heat transfer mechanisms on vapour bubbles during their growth are described in the following subsections. As a reference, the different mechanisms are schematically shown in figure 1.
Common definitions of bubble heat transfer mechanisms.

1.1. Overview of heat transfer mechanisms proposed in boiling
Accurate models for prediction of heat transfer in nucleate boiling are crucial for many applications, as was described above. In many older nucleate boiling models, phase change and heat transfer mechanisms involved in vapour bubble growth are not accounted for directly. In fact, these models propose a modification of the forced convective heat transfer (Jakob & Linke Reference Jakob and Linke1933; Rohsenow Reference Rohsenow1952; Forster & Zuber Reference Forster and Zuber1955; Engelberg-Forster & Greif Reference Engelberg-Forster and Greif1959; Tien Reference Tien1961; Chen Reference Chen1966; Steiner, Kobor & Gebhard Reference Steiner, Kobor and Gebhard2005). As an example, the Chen model determines the total heat transfer coefficient in nucleate boiling by superposition of a modified form of the Forster and Zuber model for pool boiling,
 $h_{mic}$
, which basically is a modified convective term in order to compensate for boiling heat transfer and the Dittus–Boelter equation for forced convective flow,
 $h_{mac}$
, yielding
 $$\begin{eqnarray}h=h_{mic}+h_{mac}.\end{eqnarray}$$
This model relies on fitting of experimental data to determine a Reynolds number factor,
 $F$
, involved in determination of
 $h_{mac}$
and a suppression factor,
 $S$
, involved in determination of
 $h_{mic}$
. The subscript ‘mic’ stands for micro-convection, which in literature does not seem to have a clear definition. Some authors have defined micro-convective heat transfer,
 $Q_{mc}$
, as the added convection due to recirculation of liquid caused by bubble growth and departure.
Starting from the 1960s, models started incorporating different physical mechanisms. The pool boiling model by Han & Griffith (Reference Han and Griffith1965a
,Reference Han and Griffith
b
) incorporated a criterion for bubble nucleation from cavities based on thermal boundary layer thickness and included bubble growth, departure diameter, frequency and nucleation site density, thus taking latent heat directly into account. It also introduced a mechanism named transient conduction heat transfer (
 $Q_{tc}$
), which is the process of scavenging away superheated liquid from the boiling surface by departure of bubbles, after which the surface is quenched by cold liquid and the thermal boundary layer development starts again.
Another heat transfer mechanism was described by Cooper & Lloyd (Reference Cooper and Lloyd1969). Amongst other researchers at the time, they claimed that during bubble growth a micro-layer of liquid would be trapped under the bubble. By placing several thermocouples right under the heating surface where the bubble grows, they were able to prove the existence of such a micro-layer. They concluded, without quantification, that the growth of the vapour bubbles in their experiments was significantly influenced by micro-layer evaporation heat transfer (
 $Q_{ml}$
).
Based on calculations by Wayner, Kao & LaCroix (Reference Wayner, Kao and LaCroix1976) of heat transfer at the three-phase contact line, Stephan & Hammer (Reference Stephan and Hammer1994) assumed in their model that most of the heat transfer would be located at this contact line (
 $Q_{cl}$
), covering a region with a width in the order of microns. However, in the experimental analysis of Moghaddam & Kiger (Reference Moghaddam and Kiger2009a
), this mode of heat transfer was found to be two to three orders of magnitude less than the total heat transfer.
The liquid near a bubble nucleation site acts as a capacitor. After bubble departure, the liquid adjacent to the nucleation site starts to develop a thermal boundary layer, much like charging of a capacitor. When a certain threshold value in the wall temperature is reached, a bubble appears and rapidly cools down the environment, comparable to a sudden discharge of a capacitor. After the bubble departs, the thermal boundary layer development starts again.
During bubble growth, the energy required for phase change (
 $Q_{vap}$
) is not only extracted directly from the wall through micro-layer evaporation and transient conduction (from here on defined as
 $Q_{wall}$
), but energy is also extracted from the superheated liquid through evaporation at the bubble interface (
 $Q_{liq}$
). It should be stressed here that the superheating of the liquid is also a result of the heat transfer from the wall, which of course means that indirectly all of the heat for evaporation originates from the wall. However, of specific interest is the ratio of heat extracted for evaporation directly from the wall (
 $Q_{wall}$
) to the total heat required for evaporation (
 $Q_{vap}$
), since this ratio shows the contribution of superheated liquid evaporation from the bulk liquid (
 $Q_{vap}-Q_{wall}=Q_{liq}$
).
1.2. Previous work on the wall-to-vapour heat ratio in pool boiling
Many researchers recognized that the heat required for evaporation cannot be fully explained by just heat transfer from the wall. Table 1 shows a summary of results reported in a review paper by Kim (Reference Kim2009) on pool boiling heat transfer mechanisms, in which
 $\mathscr{Q}=Q_{wall}/Q_{vap}$
. The boundary conditions reported in the experimental investigations were either that of a constant heat flux or of constant wall temperature, where it should be noted that in a constant heat flux condition the heat may flow to either the substrate or the fluid, while the total heating power provided is constant. In a constant wall temperature boundary condition, the heat flux greatly increases when a bubble grows on the substrate, in order to keep the wall temperature constant.
Summary of wall heat contribution to evaporation in pool boiling.
 $^{\text{a}}$
CFD,
 $^{\text{b}}$
varying subcooling.

From these results, it appears that roughly 25 % of the heat required for bubble growth is accounted for by heat extracted from the wall. It also seems that the application of a constant wall temperature condition or constant heat flux condition yields roughly the same results. However, some significant variations exist in the reported values. In this respect, the research by Kim et al. (Reference Kim, Oh and Kim2006) is interesting. They analysed the ratio for various degrees of subcooling. For saturated conditions a ratio of 44–50 % was measured, but with increased subcooling up to 15 K the ratio increased exponentially up to 360 %. This increase in ratio is caused by condensation of the bubble top, which resides in a subcooled layer of liquid. Although the experimental work mentioned in table 1 was performed with care, some degree of subcooling either due to stratification of the liquid or due to systematic errors in the temperature measurement may still have been present.
From the data in Gerardi et al. (Reference Gerardi, Buongiorno, Hu and McKrell2009) the ratio was determined by these authors to be around 50–65 % for a wall heat flux of
 $60~\text{kW}~\text{m}^{-2}$
. They came to the conclusion that the growing vapour bubble gains a significant amount of energy from the superheated liquid layer. Curiously enough, Gerardi et al. (Reference Gerardi, Buongiorno, Hu and McKrell2010) published another paper shortly after, discussing the same experimental set-up and data, but coming to the exact opposite conclusion regarding the heat transfer ratio, stating that micro-layer evaporation at the wall must be the dominant mechanism of heat transfer. In this paper, the apparent heat transfer ratio was determined by the present authors to be around 100–115 %. The sole difference between the reported data sets was a slightly different wall heat flux (
 $60~\text{kW}~\text{m}^{-2}$
in Gerardi et al.
Reference Gerardi, Buongiorno, Hu and McKrell2009 and
 $50~\text{kW}~\text{m}^{-2}$
in Gerardi et al.
Reference Gerardi, Buongiorno, Hu and McKrell2010). Considering the analysis by Kim et al. (Reference Kim, Oh and Kim2006), one would expect a higher degree of subcooling for the
 $50~\text{kW}~\text{m}^{-2}$
data set. This could well be the case, since their pool boiling set-up did not include a pressure gauge and was completely sealed, which can easily lead to higher system pressures. In addition, both papers by Gerardi et al. seem to overestimate the ratio severely. In Gerardi et al. (Reference Gerardi, Buongiorno, Hu and McKrell2009) they reported that the bubble diameter they measured is actually an underestimation, without attempting to quantify. Furthermore, from their measurements they were unable to determine the exact size of the bubble foot, which lead to an overestimation of the heat flux provided from the wall to the bubble foot. Both of these effects seem to indicate that the ratios they reported are large overestimations and that energy provided by the superheated liquid may have been a significant heat transfer mechanism.
In the frame of this research, it is interesting to note the work of Hollingsworth, Witte & Figueroa (Reference Hollingsworth, Witte and Figueroa2009), which is an experimental investigation of growing vapour bubbles sliding upward along an inclined thin-foil heater surface. These vapour bubbles are not attached to the wall and have a micro-layer of liquid between the vapour and wall as they slide upwards. They found that the maximum heat transfer enhancement was located in the wake of the bubble and it appears that micro-layer evaporation was a much less significant heat transfer mechanism. Heat transfer from the wake to the wall is relatively high because of the high mixing in the wake. However, the bubble moves to places where heat is taken from the fluid in order to make the bubble grow. These observations lead to the conclusion that also this sliding vapour bubble obtains most of its heat for evaporation from the surrounding liquid.
In the experimental work of table 1 the determination of the bubble volume during bubble growth up to detachment is most often done without much precision. Oftentimes, only a top view of the bubble is used to determine the diameter, which in the initial growth stage of a bubble is an overestimation since the shape is hemispherical. Furthermore, near bubble detachment this method will underestimate the total volume. When a sideview image of the vapour bubbles is available, the main method of determining the volume is by fitting a circle through the bubble contour. Studies by Lee et al. (Reference Lee, Oh, Kim, Lee and Song2003) and Kim et al. (Reference Kim, Oh and Kim2006) calculated the volume by fitting two spherical caps through the top and the bottom of the bubble. However, this method is still very inaccurate, especially towards bubble detachment during necking of the bubble near the wall. In order to accurately quantify a heat transfer ratio as described above, the volume of the bubble should be determined accurately over the whole course of growth. Therefore, this paper will show a different method which determines the volume with high accuracy in a way that is independent of bubble shape.
Accurate analysis of the heat transfer contribution of the wall and superheated liquid to vapour bubble growth in flow boiling in the literature is unknown to the authors. Nevertheless, most cooling applications rely on flow boiling heat transfer. In order to develop more accurate flow boiling models, extending the analysis of heat transfer mechanisms on growing vapour bubbles to convective boiling experiments is essential. Therefore, the main topic of this paper is single bubble heat transfer mechanisms in flow boiling, employing a highly accurate analysis of the vapour bubble volume. The mass flow rate is expected to play a significant role during vapour bubble growth and detachment. In addition, by varying the liquid mass flow rate, convective cooling (single phase) can be varied. By adjusting the liquid mass flow rate, the wall heat flux can be altered without influencing the bubble frequency by a large amount, avoiding bubble–bubble interactions which often play a limiting role in pool boiling experiments (see Kim et al. Reference Kim, Oh and Kim2006; Moghaddam & Kiger Reference Moghaddam and Kiger2009b ).
2. Experimental methods and procedures
2.1. Test set-up
In order to perform measurements in saturated flow conditions, a closed-loop experimental set-up was designed. The set-up allows for accurate control of flow, temperature and pressure of the bulk fluid, which is demineralized water. These parameters are described in more detail below. Furthermore, the set-up is constructed in a way that it allows for optimal deaeration of the liquid, prior to initiation of experiments. Because the working fluid is demineralized water, the set-up has been constructed using stainless steel 316L to avoid corrosion. Flexible connections between upflow and downflow channels and the pump (1) have been applied to avoid stresses in the main flow channel caused by thermal expansion and transmission of pump vibrations. In addition, the main flow channel has only one fixed point for the same reason.
A schematic of the test set-up and its components can be seen in figure 2. During the description of the test set-up below, references to the components in the schematic will be given by the use of the numbers in figure 2.
Schematic of the test set-up.

2.1.1. Flow
The pump (1) is a frequency controlled Grundfos CRNE 5–2 vertical centrifugal pump and is capable of delivering a maximum bulk velocity (
 $v_{bulk}$
) in the test section (4) of
 $1~\text{m}~\text{s}^{-1}$
. The pump is positioned 4 m below the test section, which increases the local pressure by
 $0.4~\text{bar}$
and prevents the pump from cavitation. The flow meter (3) is positioned upstream of the test section and measures the flow using ultrasonic waves (Krohne UFM 3030). This type of measurement does not disturb the flow and causes an insignificant pressure drop, both of which are important advantages. The flow meter has a maximum measurement error of 0.5 % of the measured value.
The upflow channel and test section have a cross-section of
 $30~\text{mm}\times 30~\text{mm}$
. To ensure fully developed flow conditions in the test section, the free flow length in front of the test section is 40 hydraulic diameters long and preceded by a tube bundle flow straightener. Furthermore, the flow meter, which is positioned upstream of the flow straightener, has a contraction (contraction ratio of 0.7) which is also known to be advantageous for flow development.
2.1.2. Temperature
Accurate temperature control is vital for boiling experiments. In order to minimize heat losses, the complete set-up has been insulated by 6 mm thick Armaflex®. The fluid is heated up by an immersion heater (2) of
 $17~\text{kW}$
. In order to maintain a steady fluid temperature with
 $0.1~\text{K}$
accuracy, a Pt100 is positioned right above the test section. It is connected to a Eurotherm 2408 PID controller which regulates the heater. A plate heat exchanger (6) with a maximum capacity of
 $30~\text{kW}$
can be utilized to cool down the liquid when desired.
The orientation and placement of the heater are chosen such that any hot liquid and bubbles, as a result of degassing, will rise straight up past the test section and into the deaeration vessel (5), which separates air bubbles from water by buoyancy. Any remaining microbubbles are captured by a Spirovent® deaerator. The set-up is deaerated by circulating the water at a temperature of
 $101\,^{\circ }\text{C}$
at ambient pressure in the deaerator for several hours.
2.1.3. Pressure
The system pressure is monitored by a pressure transducer (P) with an accuracy of
 $0.01~\text{bar}$
. This inaccuracy is lower than the 0.5 % of full scale provided by the documentation of the pressure transducer, since the pressure transducer was calibrated. This inaccuracy leads to an uncertainty in the determination of the saturation temperature,
 $T_{sat}$
, of
 $\pm 0.3~\text{K}$
at most. To stabilize the pressure, an expansion vessel (7) with pressure control on the air side of the vessel is employed.
2.2. Test section
The test section used during the experiments has been custom made to meet high requirements. First and foremost, the test section has to contain nucleation sites for vapour bubbles to grow. Special requirement is that the wall temperature under bubble nucleation sites can be measured. Second, clear visibility of the vapour bubbles and flow are of great importance to the accuracy of measurements. Third, any materials used in this design have to be able to withstand the system temperature range and working fluid. These requirements led to the design presented below.
2.2.1. Vapor bubble generation
Due to the requirement of temperature measurement or temperature control of the bubble nucleation area, the choice was made for square
 $1~\text{mm}\times 1~\text{mm}$
titanium thin film resistors with a thickness of 200 nm and a typical resistance of
 $10~{\rm\Omega}$
. These resistors serve as thin film heaters by application of an electrical current (Joule heating), on which vapour bubbles start nucleating when enough power is applied. The thin films are placed on top of a glass substrate by chemical vapour deposition. The advantage of such thin films is that their resistance is sensitive to temperature fluctuations, with a typical average positive temperature coefficient of
 $0.001~\text{K}^{-1}$
. When the resistance changes, any current and voltage flowing through the resistor will also change. By keeping the current through this resistor constant and measuring the voltage drop, its resistance and, therefore, temperature can be determined. The temperature coefficient is determined as accurately as possible by measuring the resistance with a precision of
 $0.01~{\rm\Omega}$
at 10 K temperature intervals during heating up of the test set-up, which corresponds to an accuracy of 1 K. As mentioned above, the titanium thin film resistors are deposited on top of a glass substrate by chemical vapour deposition (with a dimension of
 $3~\text{mm}\times 1~\text{mm}$
). Subsequently, gold leads of relatively low resistance (
 ${\sim}1~{\rm\Omega}$
per lead) are deposited on two sides of the titanium film (effectively reducing the titanium resistor area to
 $1~\text{mm}\times 1~\text{mm}$
). These gold leads are used to conduct electricity towards the titanium resistor. From here on, these thin film heaters will be called bubble generators (BGs) in order to make a clear distinction with the bulk liquid immersion heater. Thermal properties (thermal conductivity,
 $k$
, specific heat capacity,
 $c_{p}$
, and mass density,
 ${\it\rho}$
) and static contact angles (water droplets in air, from Yoon & Garrell (Reference Yoon and Garrell2008, p. 70) and Park & Aluru Reference Park and Aluru2009) of the main materials are listed in table 2.
Thermal properties (at
 $20\,^{\circ }\text{C}$
) of materials used in the test section.

The thermal response time of the titanium layer and the glass substrate underneath follows from the analytical solution of the heat equation for a semi-infinite solid with a boundary condition of the third kind, given by Luikov (Luikov Reference Luikov1968, chapter 6, pp. 201–208) as
 $$\begin{eqnarray}{\it\theta}(x,t)=\text{erfc}\left(\frac{x}{2\sqrt{{\it\alpha}_{s}t}}\right)-\exp \!\left[\frac{\overline{h_{c}}x}{k_{s}}+\frac{\overline{h_{c}}^{2}{\it\alpha}_{s}t}{k_{s}^{2}}\right]\text{erfc}\left\{\frac{x}{2\sqrt{{\it\alpha}_{s}t}}+\frac{\overline{h_{c}}\sqrt{{\it\alpha}_{s}t}}{k_{s}}\right\}\end{eqnarray}$$
in which
 ${\it\alpha}_{s}$
is the thermal diffusivity of the wall material,
 $k_{s}$
the thermal conductivity of the wall material,
 $\overline{h_{c}}$
is the average heat transfer coefficient over the length of the thin film resistor and
 ${\it\theta}(x,t)$
is defined as
 $(T(x,t)-T_{0})/(T_{bulk}-T_{0})$
, with
 $T_{0}$
the initial wall temperature and
 $T_{bulk}$
the bulk liquid temperature. Length
 $x$
is the depth into the wall material, with
 $x=0$
defined as the liquid–solid interface. In the following simplifying estimation of the thermal response time of the titanium layer,
 ${\it\tau}_{TF}$
, the wall material is assumed to be all glass. This will yield an overestimation of
 ${\it\tau}_{TF}$
.
The only unknown in (2.1) is the average convective heat transfer coefficient,
 $\overline{h_{c}}$
, over the length of the thin film resistor, given by
 $$\begin{eqnarray}\overline{h_{c}}=q^{\prime \prime }/(T_{TF}-T_{bulk}),\end{eqnarray}$$
in which
 $q^{\prime \prime }$
is the heat given to the liquid flow past the thin film resistor per square meter,
 $T_{TF}$
is the mean temperature of the thin film resistor. Typical values as seen during experiments are
 $q^{\prime }=0.5~\text{MW}~\text{m}^{-2}$
and
 $T_{TF}-T_{bulk}=15~\text{K}$
. This results in
 $\overline{h_{c}}=33\times 10^{3}~\text{W}~\text{m}^{-2}~\text{K}^{-1}$
.
The thermal response time is defined as the time at which the wall temperature at a depth of 200 nm (i.e. the thickness of the titanium layer) is at 95 % of the wall temperature at
 $x=0$
. Applying (2.1) to solve for
 ${\it\theta}~(x=0,t)$
and
 ${\it\theta}~(x=2\times 10^{-7},t)$
and setting the ratio of these two values to 95 %, a thermal response time
 ${\it\tau}_{TF}=23~{\rm\mu}\text{s}$
is obtained. If anything, this value is an overestimation since it was calculated using the thermal properties of the glass substrate, while the material of the thin film resistor is titanium, which has a much higher thermal diffusivity.
Owing to the small thermal response time, the instantaneous mean thin film temperature,
 $T_{TF}$
can be accurately determined by measuring its resistance.
2.2.2. BG test section
The test section consists of a glass channel with a square cross-section of
 $30~\text{mm}\times 30~\text{mm}$
. On the surface of one wall of the channel, a grid of thin film resistors (200 nm thickness) has been placed by chemical vapour deposition, as described in § 2.2.1. By the same process, gold leads with a thickness of 500 nm have been deposited, which act as electric conductors. This means that on one of the inner walls of the channel, through which nearly saturated liquid flows, bubbles can be generated from any one of these thin film resistors by applying an electric current (Joule heating). A picture of the test section is seen in figure 3, along with the main BG grid and a close-up view of this grid.
(Left) Test section with glass channel. (Middle) BG grid with gold leads. (Right) Close-up view of the grid.

The vertical spacing between the top seven BGs is 1 mm. They are positioned in the centre of the wall. Only the BG indicated in the black box in figure 3 is used in the current paper.
2.2.3. Artificial nucleation site considerations
When generating bubbles by use of the above-described BG, it is possible that multiple natural nucleation sites are active on the
 $1~\text{mm}\times 1~\text{mm}$
surface. In order to increase predictability, many researchers employed predefined artificial nucleation sites (Bonjour, Clausse & Lallemand Reference Bonjour, Clausse and Lallemand2000; Shoji & Takagi Reference Shoji and Takagi2001; Zhang & Shoji Reference Zhang and Shoji2003; Qi & Klausner Reference Qi and Klausner2005; Moghaddam & Kiger Reference Moghaddam and Kiger2009a
, amongst many others) by creating artificial cavities in the boiling substrate. The shape of these cavities differs between studies, examples are cylindrical, conical, rectangular and even triangular cavities. Typical diameters and depths of these cavities range from 10 to
 $1000~{\rm\mu}\text{m}$
.
In the configuration of the BG reported here, it was found impossible to create an artificial cavity which guarantees nucleation from that specific site. Various conical holes were laser drilled into the glass substrate, ranging in size from 20 to
 $100~{\rm\mu}\text{m}$
and depths of
 $100{-}500~{\rm\mu}\text{m}$
, none of which yielded a nucleation site with reproducible results. In contrast, most often the bubbles would originate from natural sites occurring in different locations on the
 $1~\text{mm}\times 1~\text{mm}$
BG surface. It is hypothesized that this is mainly caused by the way heat is supplied to the liquid in these BG, since heat is not provided through the substrate material but only from the top interface between wall and liquid. For this reason, the cavity may not heat up sufficiently to initiate nucleation from this site.
When a bubble did indeed grow on the artificial cavity, it would exhibit a much different behaviour in its dynamics than bubbles originating from natural cavities. Bubbles originating from artificial cavities show a much stronger pinning to their respective nucleation cavity, which induces shape oscillations during its growth. As the bubble attempts to leave the surface, it is pulled back by the surface tension force at the bubble foot. A typical oscillatory bubble growth (
 $v_{bulk}=0.41~\text{m}~\text{s}^{-1}$
,
 $T_{bulk}=101.0\,^{\circ }\text{C}$
,
 $p_{bulk}=1.05~\text{bar}$
) result is shown in figure 4, in which the position perpendicular to the wall of the top of a bubble,
 $h_{top}$
, growing on an artificial nucleation site (hole with a diameter of
 $100~{\rm\mu}\text{m}$
and conical depth of 1 mm) is shown as a function of time.
Bubble top position history of a bubble growing on an artificial cavity.

Each point on this graph has a precision of
 $\pm 0.015~\text{mm}$
. At three distinct moments in time (0.8, 2.6 and
 $4.8\pm 0.1~\text{ms}$
) the bubble experiences oscillatory growth. The corresponding frequency has been shown to correspond to the fundamental oscillation mode of a bubble pinned at its foot (see Van der Geld Reference Van der Geld2014). This frequency can be predicted in ways described by Bostwick & Steen (Reference Bostwick and Steen2013) and Vejrazka, Vobecka & Tihon (Reference Vejrazka, Vobecka and Tihon2013). It is therefore concluded that an artificial cavity is likely to lead to modes of bubble growth and detachment which are uncommon to boiling. An extensive analysis of geometries and heat transfer involved in this type of bubble growth is undesirable, since it may lead to conclusions that are not relatable to practical applications. For these reasons, no artificial nucleation sites have been used in the experiments reported in the remainder of this study. Only natural cavities occurring in the glass which is coated with titanium are employed. In addition, the natural cavities used in the present study occur on a thin heated film of a different material (titanium) than the remainder of the wall (glass). At the edge of the heated film, the bubble foot can be pinned, be it partially. The study of vapour bubbles pinned in this manner is of specific interest to recent developments in boiling research, in which boiling surfaces exhibiting surface inhomogeneities and materials with varying hydrophobicity are employed (Takata et al.
Reference Takata, Hidaka, Masuda and Ito2003; Caney et al.
Reference Caney, Gruss, Bertossi, Poncelet and Marty2014; Qiu Reference Qiu2014).
2.3. Data acquisition system
Power is fed to the BG by use of a constant current (CC) power source. The voltage drop over the BG is measured at 10 kHz sampling frequency. Furthermore, the current is determined by measuring the voltage drop over a shunt resistance which is connected in series with the BG. Use of Ohm’s law,
 $R=V/I$
, then results in the resistance of the BG. The resistance of the BG is a known linear function of temperature, so the instantaneous temperature of the BG can be extracted from the measurements. It should be noted that this temperature is the mean temperature over the
 $1~\text{mm}\times 1~\text{mm}$
surface of the BG.
The acquisition of the electrical data is synchronized with an optical acquisition system consisting of two cameras and three light sources, as shown in figure 5.
Optical configuration for bubble visualization as applied during the experiments, all dimensions are to scale.

Camera 1 (Photron SA-X2 recording at 20 000 frames per second (f.p.s.), exposure time of
 $25~{\rm\mu}\text{s}$
, resolution
 $512~\text{pixel}\times 768~\text{pixel}$
) records the side view of the nucleating bubbles while camera 2 (Photron SA3 recording at 10 000 f.p.s., exposure time of
 $50~{\rm\mu}\text{s}$
, resolution
 $192~\text{pixel}\times 256~\text{pixel}$
) records the top view. A 50 W PowerLED (Bridgelux) is placed directly opposite to camera 1 (indicated by L1), which creates a shadowgraph image of the side view. Camera 2, however, cannot create a direct shadowgraph due to the titanium and gold layers partially blocking the light from the back. Therefore, additionally to a 20 W PowerLED (Bridgelux) opposite to camera 2 (indicated by L2), a Dedocool light source (L3) is placed above the camera to provide extra light on the top view.
While most of the analysis relies on the images from the side view camera, the top view camera has three main functions. First, it serves as a calibration for camera 1, since the dimensions of the BG grid are known with high precision, in a way that will be explained in § 2.4. Second, the top view provides information on the ellipticity of the bubble, which should be accounted for to obtain a correct bubble volume. Last, the top view is used to determine the exact nucleation site from which the bubble originates (see § 2.2.1), in order to ensure that the same nucleation site is used for all measurements. For the measurements reported here, the BG only had one active nucleation site.
2.4. Geometrical calibration
The geometrical calibration of the top view camera images is done with the observed grid of BG, which allows for a very accurate pixel to millimetre conversion. The side view image is calibrated by measuring the bottom-to-top size of a series of bubbles during their growth and relating the size on the top view camera to the corresponding side view images. From this calibration, the pixel to millimetre conversion for the top view camera was found to be
 $18.96\pm 0.046~{\rm\mu}\text{m}~\text{px}^{-1}$
and the conversion for the side view camera was found to be
 $4.99\pm 0.016~{\rm\mu}\text{m}~\text{px}^{-1}$
.
2.5. Measurement strategy
During the experiments, the bulk liquid temperature,
 $T_{bulk}$
, and pressure,
 $p_{bulk}$
, were kept constant. The bulk flow velocity,
 $v_{bulk}$
, was increased from 0.31 up to
 $0.84~\text{m}~\text{s}^{-1}$
in steps of roughly
 $0.1~\text{m}~\text{s}^{-1}$
. Simultaneously, because the convective cooling increases with increasing flow rate, the power fed to the BG,
 $P_{BG}$
, was increased in order to maintain a relatively steady bubble nucleation frequency,
 $f_{bub}$
. The main requirement for the nucleation frequency was to remain low enough in order to avoid subsequent bubbles from hydrodynamically interacting with one another. During the experiments, it was observed that the average wall temperature,
 $\overline{T_{wall}}$
only varied by 1 K at most. Therefore, the Jakob number, given by
 $$\begin{eqnarray}\mathit{Ja}=\frac{(T_{wall}-T_{sat})c_{p,l}{\it\rho}_{l}}{h_{fg}{\it\rho}_{v}},\end{eqnarray}$$
has a value of
 $37.5\pm 1.5$
. The main parameters for each flow rate are given in table 3.
Measurement conditions,
 $T_{bulk}=100.7\pm 0.1\,^{\circ }\text{C}$
,
 $p_{bulk}=1.06\pm 0.01~\text{bar}$
and
 $\mathit{Ja}=37.5\pm 1.5$
.

As can be seen from this table, all experiments were performed in a turbulent flow condition (
 $\mathit{Re}\geqslant 31\,900$
, based on the hydraulic diameter of 30 mm). Owing to local turbulent structures and accompanying local pressure variations, this turbulence is expected to have some influence on the size and shape of bubbles during their growth. Therefore, for each flow rate a total of 20 bubbles were analysed and results were averaged over these 20 bubbles.
The results of the simultaneous recording of voltages by the data acquisition system (10 kHz) and the high-resolution camera images (10 kHz for top view and 20 kHz for side view of the bubble) are shown in the next section.
3. Experimental results
3.1. Camera recordings
As mentioned in the previous section, with increasing flow rate an increase of variation in bubble shape and size at detachment is expected. Local turbulent eddies induce local variations in the pressure around the bubble nucleation site. The most extreme example of this effect was observed at the highest flow rate (
 $v_{bulk}=0.84~\text{m}~\text{s}^{-1}$
) and is depicted in figure 6. For clarity, a line drawing of a contour around the bubble has been added to this figure. In this drawing, the vertical white line shows the position of the wall on which the BG location is indicated in black. The side view camera is positioned at a slight angle in order to accurately visualize the bubble foot area, this is the reason why a reflection of part of the bubble is visible in the wall. The figure shows the smallest (6
a) and largest (6
b) bubble observed for this flow rate at a same time after nucleation (
 ${\rm\Delta}t=0.5~\text{ms}$
) and at their respective times of detachment. It appears that the small bubble is being pulled upward, whereas the large bubble is almost hemispherical at 0.5 ms. This can be an indication that a local high-pressure field is present above the small bubble and a local low-pressure field is present below the large bubble. Obviously, a low-pressure field under the bubble nucleation site also causes the bubble to remain on the BG surface for a longer time and leads to a later time of detachment (2.3 ms as opposed to 1.6 ms). This turbulence effect will create a spread in the result of the average bubble detachment diameter at each bulk flow rate, as will be shown in the geometrical analysis § 4.1.
Smallest (a) and largest (b) bubbles measured at
 $v_{bulk}=0.84~\text{m}~\text{s}^{-1}$
, at 0.5 ms after nucleation and detachment.

Figures 7 and 8 show two examples of a simultaneous recording of a bubble from nucleation up to detachment for the lowest and highest liquid bulk flow rate (see table 3). It should be noted that the top view image (
 $192~\text{pixel}\times 256~\text{pixel}$
) has been scaled up to the side view (
 $512~\text{pixel}\times 768~\text{pixel}$
), but the images are not resized to obtain a matching bubble size.
Raw images of an example bubble at a flow velocity of
 $0.31~\text{m}~\text{s}^{-1}$
from nucleation to detachment, time delay between consecutive frames is 0.6 ms.

Raw images of an example bubble at a flow velocity of
 $0.84~\text{m}~\text{s}^{-1}$
from nucleation to detachment, time delay between consecutive frames is 0.2 ms.

Average wall temperature from bubble nucleation (
 $t=0~\text{ms}$
) up to 8 ms after detachment for
 $v_{bulk}=0.31~\text{m}~\text{s}^{-1}$
. The time of detachment is indicated by the vertical dashed line.

3.2. Wall temperature
The average wall temperature at the bubble nucleation site is determined from the BG resistance, as described in § 2.2.1. No thermocouple in the vicinity of the BG is used. Isothermal runs allowed for frequent calibration of the temperature coefficient of the BG. The average wall temperature under the bubble nucleation site can be determined from the BG resistance, as described in § 2.2.1. During the experiments, it was found that noise originating from the CC source affected the temperature measurement of individual bubbles. However, since this noise is random, it can be suppressed by averaging over multiple bubbles. The wall temperature as a function of time was averaged over 20 bubbles and is shown in figure 9 for the lowest flow rate applied during the experiments. It is noted that the waiting time between bubbles was between 10 and 30 ms during all experiments. In the waiting time between bubble nucleation events, heat is stored in the liquid layer near the heated surface, much like a capacitor (as described in § 1). The grey line is the raw averaged data which was smoothed by a nine-point moving average procedure and resulted in the thick black line. As a measure of uncertainty of the temperature profile, a regression analysis was performed by fitting a seventh-order polynomial through the averaged data (
 $R^{2}=0.76$
). The standard error of the fit (root mean squared error (RMSE)) is defined as
 $[\sum _{i=1}^{N}(y_{i}-{\hat{y}}_{i})^{2}/(N-p)]^{1/2}$
, where
 ${\hat{y}}_{i}$
is the predicted value of data point
 $y_{i}$
,
 $N$
the total amount of data points and
 $p$
the amount of fitted coefficients. The RMSE of the regression fit turns out to be 0.7 K, which agrees to a 68 % confidence interval. The temperature measurement is recorded synchronously with the camera images. From the recorded images the time of nucleation, defined as the first frame in a recorded sequence in which a bubble appears on the BG surface, could be determined up to 0.05 ms accuracy. Time
 $t=0$
in figure 9 is defined as the frame before this first frame of nucleation. The accuracy of 0.05 ms does not affect the smoothing and averaging process.
This result is according to expectations and in good agreement with Gerardi et al. (Reference Gerardi, Buongiorno, Hu and McKrell2009, Reference Gerardi, Buongiorno, Hu and McKrell2010) who performed saturated pool boiling measurements with demineralized water and recorded the temperature of the wall by infrared thermometry. For an average bubble cycle, they reported a peak wall temperature of around 109.5 °C and a 4 °C drop in temperature averaged over the area of the bubble foot.
4. Analysis
4.1. Geometrical bubble analysis
As mentioned in the introduction (§ 1), the usually applied methods of bubble volume determination are generally inaccurate. The current study provides a significant improvement, not only by increased resolution (
 $512~\text{pixel}\times 768~\text{pixel}$
) and a high frame rate of 20 000 f.p.s. combined with a shutter time of
 $1/40\,000$
s, but also by applying a more accurate contour analysis of the bubble images. From the top view images, a distinct ellipticity of the bubble top could not be observed for any flow rate. Although at times the bubble top view image seems to deviate from a perfect circle (see figures 7 and 8), this could well be caused by the variety of grey scales in the top view image, including a shadow under the bubble and bright spots on the bubble interface. This variety of grey scales causes difficulties in determining the real top view bubble contour. In fact, when attempting to determine the ellipticity, the deviation from a perfect circle was found to be within 2 % for all bubbles, which corresponds to 2 pixels on the top view camera image. The small deviation from a perfect circle as observed from the top view images, combined with the aforementioned difficulty in determining the real bubble contour caused by a variety in grey scales on the images, makes it impossible to conclude whether the top view is a perfect circle. However, the shape must be close to that of a circle and, therefore, for the rest of the analysis the ellipticity is assumed to be equal to zero.
The Canny edge detection method (Canny Reference Canny1986, as part of the MATLAB® Image Processing Toolbox™ MATLAB 2014) was used to detect the contour of the bubble side view. As a result of the bubble top view camera observations, the cross-sections of the bubble parallel to the wall are assumed circular. Subsequently, in combination with the bubble side view contour, a cloud of points in 3D resembling the bubble volume is constructed. The real volume of the bubble is then approximated by an alpha shape constructed from the point cloud by use of a 3D Delaunay triangulation method, creating an enclosed structure of tetrahedra. The total volume of these tetrahedra is then the calculated bubble volume. A side and trimetric view of the reconstructed 3D bubble volume together with the original camera images can be seen in figure 10.
Example of a reconstructed 3D volume of a bubble at
 $v_{bulk}=0.31~\text{m}~\text{s}^{-1}$
.

The above analysis was performed for 20 bubbles at each flow rate. The resulting average volume at detachment,
 $\overline{V_{bub}}$
, as well as the volume equivalent radius,
 $\overline{R_{eq}}$
, and time from nucleation up to detachment,
 $\overline{{\rm\Delta}t_{growth}}$
, are given in table 4. Both
 $\overline{V_{bub}}$
and
 $\overline{{\rm\Delta}t_{growth}}$
are given with their respective 95 % confidence intervals, defined as twice the standard deviation. These intervals result from the fourth-order polynomial regression fit (
 $R^{2}=0.96\pm 0.02$
) over the volume histories of 20 bubbles per flow rate.
Averaged results from the geometrical analysis at bubble detachment.

The spread in
 $\overline{V_{bub}}$
and
 $\overline{{\rm\Delta}t_{growth}}$
relatively increases with increasing flow rates. This observation supports the hypothesis that turbulence is expected to influence the bubble size and shape during its growth (as explained in § 3.1) since an increase in flow rate leads to an increase in turbulence and, therefore, an increased spread in
 $\overline{V_{bub}}$
and
 $\overline{{\rm\Delta}t_{growth}}$
. It should be emphasized that the error in the determination of the volume of individual bubbles is negligible (
 ${<}1\,\%$
) in comparison with the turbulence-induced spread (table 3).
4.1.1. Bubble growth
The growth rate of vapour bubbles on a plane wall is traditionally divided into two limiting cases (see Mikic, Rohsenow & Griffith Reference Mikic, Rohsenow and Griffith1970). The first case is often called the inertia-controlled growth stage, which in the configuration of the present study lasts less than
 $10~{\rm\mu}\text{m}$
. This time is equal to
 $t^{+}=1$
in Mikic et al. (Reference Mikic, Rohsenow and Griffith1970), which they defined as the transition point where the inertia-controlled phase transitions into the second limiting case. This second case is where vapour bubble growth is clearly controlled by heat diffusion, as well described by Plesset & Zwick (Reference Plesset and Zwick1954); the bubble radius in this case grows proportional to the square root of time,
 $R\propto \sqrt{t+t_{0}}$
, with
 $t_{0}$
the reference time at which diffusion growth starts.
If the contact coefficient,
 $k{\it\rho}c_{p}$
, is nearly the same for fluid and wall, as is the case in our experiments, and if the solid and liquid are uniformly superheated at equal temperatures, then Van Ouwerkerk (Reference Van Ouwerkerk1971) predicted the initial growth of a vapour bubble with the shape of a hemisphere with radius
 $R$
as
 $$\begin{eqnarray}R(t)=\frac{2}{\sqrt{{\rm\pi}}}\left(1+\sqrt{3}\right)\mathit{Ja}\sqrt{{\it\alpha}t}\approx 3.08\;\mathit{Ja}\sqrt{{\it\alpha}t},\end{eqnarray}$$
in which
 ${\it\alpha}$
is the thermal diffusivity of the liquid. The applicability of this equation will be investigated below.
The main measurements performed in this study possessed a temporal resolution of
 $50~{\rm\mu}\text{s}$
. In order to accurately assess the initial growth stage of vapour bubbles, additional measurements have been performed by use of a Photron SA-X2 high-speed camera recording at 300 000 f.p.s., resulting in a
 $3~{\rm\mu}\text{s}$
temporal resolution. As a trade-off, the high frame rate puts a restriction on the spatial accuracy, which for this measurement was
 $28.4~{\rm\mu}\text{m}~\text{px}^{-1}$
. In the initial growth stage, the shape of the bubble in the first
 $300~{\rm\mu}\text{s}$
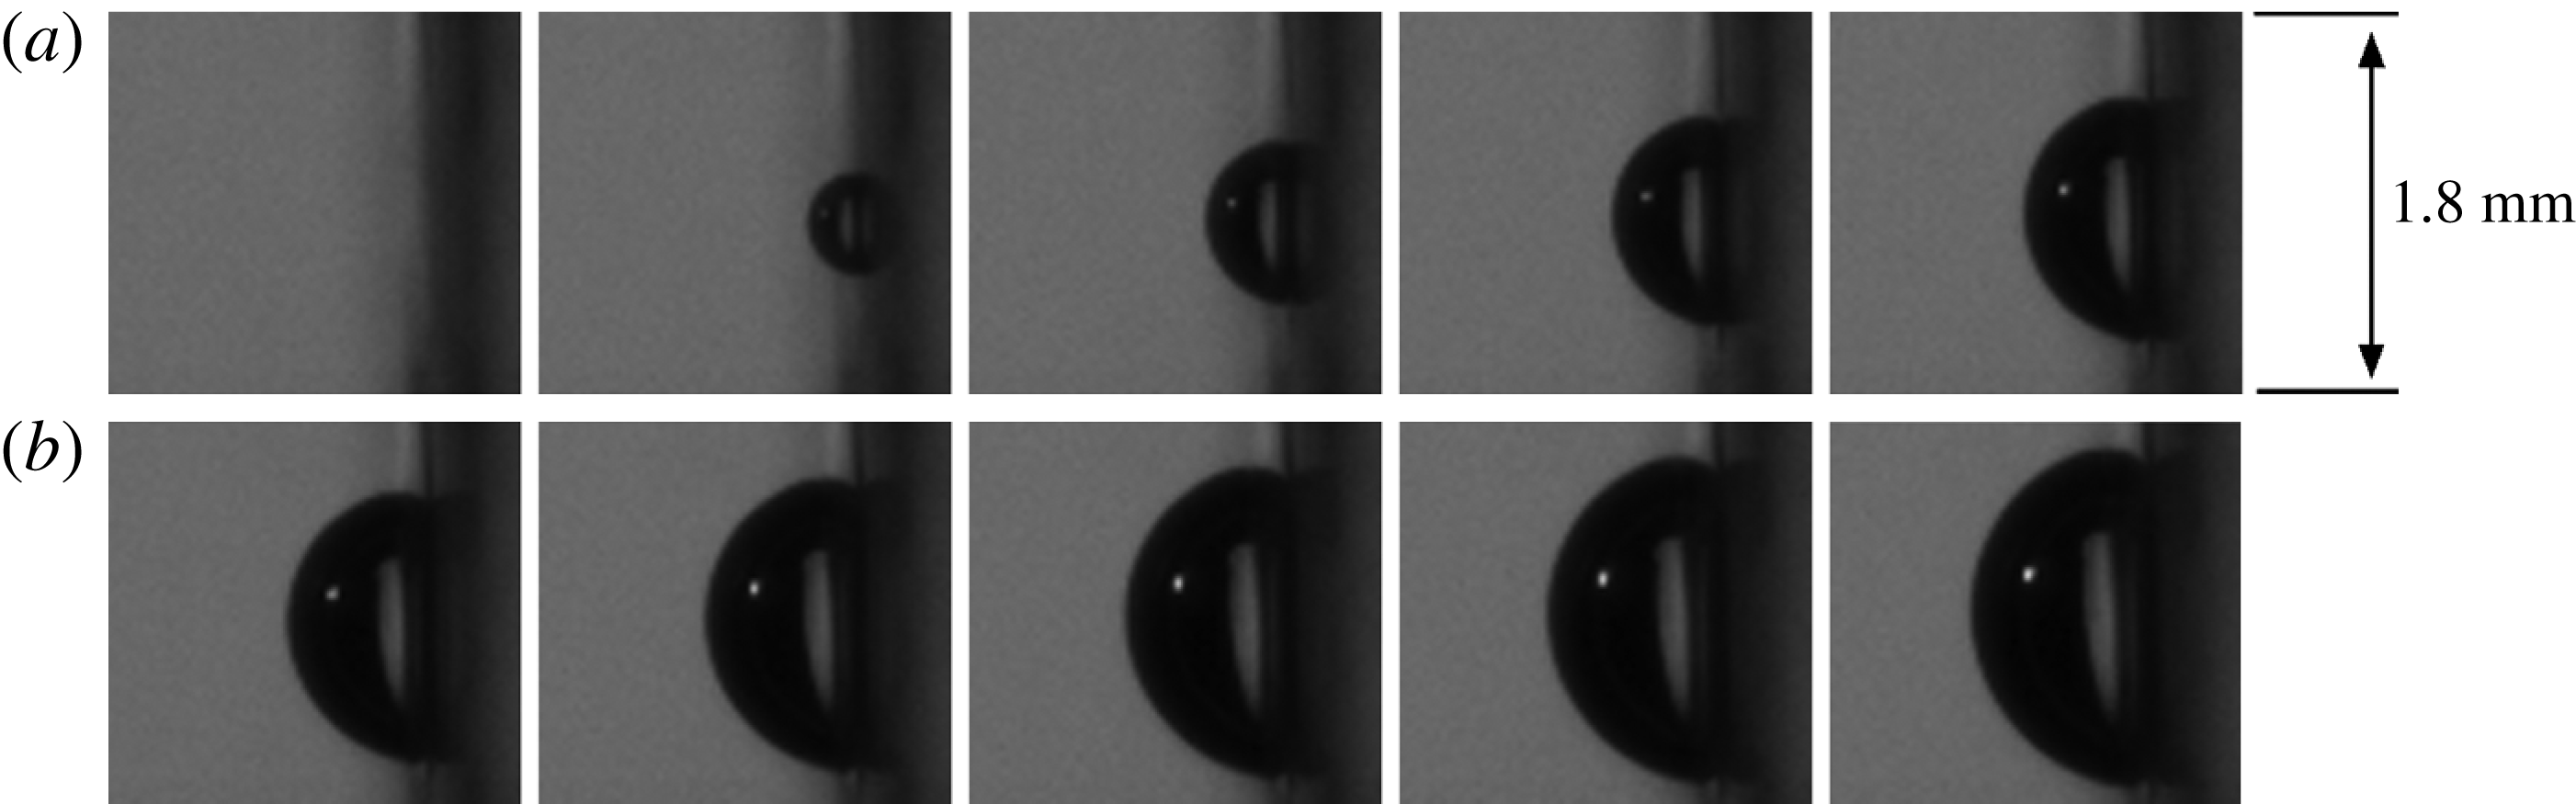
is seen to be in close approximation to a hemisphere, as is evident from figure 11. The velocity of the isotropic expansion is
 $2~\text{m}~\text{s}^{-1}$
on average in the first
 $300~{\rm\mu}\text{s}$
of growth. This is much larger than the maximum observed bulk flow velocity (
 $v_{bulk}=0.84~\text{m}~\text{s}^{-1}$
) which, in turn, is much larger than the flow velocity in the vicinity of the wall. It is noted that hemispheres are precisely the shapes analysed by Van Ouwerkerk (Reference Van Ouwerkerk1971). Because of the hemispherical shape, the bubble top height, corresponding to
 $R$
in (4.1), measured perpendicularly from the wall is sufficient to accurately determine the bubble volume. It is easily shown that
 $R_{eq}=2^{-1/3}R$
for a hemispherical bubble. In figure 12, the volume equivalent radius resulting from the bubble recorded at 300 000 f.p.s. (
 $\times$
markers) was matched to a vapour bubble recorded at 20 000 f.p.s. (○ markers) originating from the same BG with the same size around 0.3 ms. For this reason, the combined data can only be used for qualitative analysis. The bulk liquid flow velocity for the reported bubbles is
 $v_{bulk}=0.51~\text{m}~\text{s}^{-1}$
. Histories for other bulk liquid velocities are similar, but have been omitted from this figure for clarity. If the very early stage of bubble growth would have a linearly proportional growth, this stage would occur in a time span less than
 $5~{\rm\mu}\text{s}$
in the present experiments. Since the initial growth stage is already proportional to
 $\sqrt{t}$
and the last stage of bubble growth is known to be proportional to
 $\sqrt{t}$
as well, it is plausible that the whole course of growth is governed by heat diffusion.
Initial bubble growth recorded at 300 000 f.p.s. from nucleation up to
 $t=300~{\rm\mu}\text{s}$
. The time between frames is
 $30~{\rm\mu}\text{s}$
.
Volume equivalent radius of a vapour bubble as observed during recordings at 20 000 f.p.s. (denoted by ○) with additional measurement at 300 000 f.p.s. during the initial growth stage (denoted by
 $\times$
). Data was fitted proportional to
 $\sqrt{t}$
in seven separate time intervals. The flow velocity in these experiments is
 $0.51~\text{m}~\text{s}^{-1}$
.

It turns out that the entire growth curve can be represented by
 $$\begin{eqnarray}R(t)=C_{1}\sqrt{t+C_{2}},\end{eqnarray}$$
if the parameters
 $C_{1}$
and
 $C_{2}$
are allowed to be time-dependent. However, a proper fit of the growth curve on the entire growth domain should not be based on (4.2), as has often been done in the past, since this type of fit is just ad hoc. Note that
 $C_{1}$
is often represented (Van der Geld et al.
Reference Van der Geld, Colin, Segers, Pereira da Rosa and Yoshikawa2012) as
 $k_{1}\mathit{Ja}\sqrt{{\it\alpha}}$
with
 $k_{1}$
a constant. Time
 $C_{2}$
is a reference time that marks the beginning of the heat diffusion process. In the initial growth stage (
 $t<150~{\rm\mu}\text{s}$
), the bubble grows proportionally to
 $\sqrt{t}$
, or more specifically as
 $R_{eq}(t)=0.0365\sqrt{t}$
. In this stage the bubble is hemispherical, so substituting
 $R_{eq}$
by
 $2^{-1/3}R$
yields
 $R(t)=0.046\sqrt{t}$
. This growth equation is remarkably close to the heat diffusion controlled growth rate predicted by (4.1). When substituting the experimental values for the Jakob number (37.5, as calculated by (2.3)) and
 ${\it\alpha}_{l}~(0.17\times 10^{-6}~\text{m}^{2}~\text{s}^{-1})$
, equation (4.1) becomes
 $R(t)=0.047\sqrt{t}$
. Equation (4.2) has been fitted to the data in figure 12 on two separate time intervals, indicated by the dashed lines in this figure. It appears that coefficient
 $C_{2}$
starts from zero but increases over time (to 0.011 s in figure 12), while coefficient
 $C_{1}$
decreases over time by a factor of five. The physical relevance of the trend in
 $C_{1}$
is significant, since this parameter was shown to be proportional to
 $\mathit{Ja}\sqrt{{\it\alpha}}$
. In the Jakob number, the fluid parameters are not expected to vary significantly over time. However, the Jakob number also holds the temperature difference between the temperature of the liquid around the bubble interface, before bubble nucleation equal to
 $T_{wall}$
, and the saturation temperature,
 $T_{sat}$
, at the interface. The decrease in coefficient
 $C_{1}$
can therefore be explained by a decrease in the liquid temperature around the bubble during its growth. This temperature decrease is governed by cooling of the liquid directly adjacent to the interface (heat diffusion), by spreading and mixing of the superheated liquid layer with the bulk liquid during bubble expansion, convection of relatively cold bulk liquid to the bubble interface, and overhang of the bubble onto the relatively cold glass wall. While the proportionality with the square root of time indicates a heat diffusion process which exhausts the energy content of a boundary layer adjacent to the liquid–vapour interface, the decrease of
 $C_{1}$
in the course of time reflects the complexity of the heat transfer process to the moving interface and indicates changes in liquid temperature further away from this interface. The close agreement of the measured initial growth of the equivalent radius with that predicted by Van Ouwerkerk (Reference Van Ouwerkerk1971) shows that the initial heat transfer to the bubble is unaffected by the convection of the bulk fluid, and that the initial temperature of the liquid layer adjacent to the wall is close to
 $T_{wall}$
.
In light of the last statements, it is interesting to compare the growth of a vapour bubble attached to a wall in a flow configuration during the later stages of growth to that of a growing vapour bubble moving freely in a superheated liquid. This last case was studied by Legendre, Borée & Magnaudet (Reference Legendre, Borée and Magnaudet1998), who computed a Nusselt number dominated by the bubble growth rate and a Nusselt number dominated by the bulk liquid velocity. They showed that, dependent on the values of the Jakob and Péclet numbers, the total heat transfer of the combined effect of growth and motion is well estimated by taking the larger of the two individual Nusselt numbers. In the present study, the additional heat source at the wall and the developed hydrodynamic boundary layer near the wall cause differences between the two cases, but in both cases two Reynolds numbers affect heat transfer from the bulk liquid to the bubble. The first Reynolds number in the attached bubble case is based on the volume equivalent expansion rate,
 $\text{d}R_{eq}/\text{d}t$
, while the second Reynolds number is based on the approaching mean liquid velocity at the height of the centre of mass of the bubble,
 $v_{l,CM}$
. The main difference between the two cases of growing vapour bubbles (attached to a wall and moving freely) is that the attached bubble has a maximum size that is dependent on the liquid velocity. With increasing bulk liquid velocity, the detachment diameter and the bubble lifetime decrease in this case. Therefore, it is impossible to vary the relative velocity
 $v_{l,CM}$
by varying the size of the attached bubble at will. The initial bubble growth is only controlled by the Reynolds number based on
 $\text{d}R_{eq}/\text{d}t$
and by diffusion from the superheated liquid layer adjacent to the wall and the bubble, as follows from the agreement with the solution of Van Ouwerkerk (Reference Van Ouwerkerk1971). In later phases of bubble growth, interaction with the oncoming flow takes place, as evidenced by the shape deformation of the bubble and the decrease found in the liquid temperature which drives the diffusion process. Convection refreshes the relatively high-temperature liquid around the bubble with colder liquid from the bulk to some extent, although the time of growth is relatively short. This refreshing partly explains the decrease in heat transfer from the bulk liquid to the bubble interface and, therefore, the decrease in growth rate (i.e. deviation from the initial growth history (4.1)). Other sources hampering the initial growth rate are the overhang of the bubble onto the colder glass substrate and spreading and mixing of the superheated liquid with colder liquid in the environment during bubble growth. In order to study convective cooling of the fluid in the vicinity of the bubble experimentally, the effect of relative velocity
 $v_{l,CM}$
must be increased. However, inherently the lifetime of the bubble is shortened. A shorter lifetime results in a higher mean value of
 $\text{d}R_{eq}/\text{d}t$
and a lower
 $v_{l,CM}$
, as the center of mass stays more close to the wall. There seems to be no way to experimentally disentangle the effects of the two Reynolds numbers in the present case of boiling at a wall. In § 4.2 the heat transfer to a vapour bubble growing at a wall will be analysed in a different way.
4.1.2. Bubble foot
The size of the bubble foot is essential for the heat provided to the bubble from the wall. During bubble growth, the BG only gives energy to the bubble through its apparent foot area covering the BG,
 $A_{foot,BG}$
. At this point, it is important to make the distinction between the real bubble foot and the apparent bubble foot. The apparent bubble foot includes the micro-layer region under the bubble, whereas the real bubble foot is the region confined by the actual three-phase contact line, see figure 1. This region is often called the dry region, although it was suggested (Wayner et al.
Reference Wayner, Kao and LaCroix1976; Stephan & Hammer Reference Stephan and Hammer1994) that this region is actually still covered by a non-evaporating adsorbed liquid film with a thickness of less than 50 Å, depending on the substrate–liquid combination.
Only the side view image is used to determine the apparent bubble foot area. An explanatory schematic can be seen in figure 13, of which the parameters will be explained in the remainder of this paragraph. The automated bubble edge detection procedure, described in § 4.1, is unable to accurately determine the bubble edge in close proximity to the wall. Therefore, the bubble contour is determined up to a chosen wall height, shown as a vertical (red online) line in figure 13, on which the thick black line indicates the BG position. The chosen wall height is approximately 10 pixels (
 $50~{\rm\mu}\text{m}$
) above the real wall, shown as a vertical white line in figure 13. The contour of the bubble between the chosen wall and the real wall is then approximated by linear extrapolation of the last 20 contour points near the chosen wall, for both the upstream and downstream sides of the bubble. This way, the apparent contact points (
 $c_{ds,app}$
and
 $c_{us,app}$
) of the bubble attached to the wall are determined.
(a) A bubble right before detachment (
 $v_{bulk}=0.84~\text{m}~\text{s}^{-1}$
). The vertical (red online) line indicates the chosen wall, whereas the white line represents the real wall. The thick black line shows the BG location. (b) A schematic of the same bubble, explaining the way the contact points and angles have been determined for all analysed bubbles during their course of growth.

The apparent contact angles (
 ${\it\beta}_{ds}$
and
 ${\it\beta}_{us}$
) follow immediately from the linear extrapolation between chosen and real wall, as is clearly shown in figure 13. The measured contact angles are shown in figure 14 for all observed flow rates. In the initial growth stage after bubble nucleation, both contact points will expand outward from the nucleation site, meaning
 $c_{us,app}$
moves downward and
 $c_{ds,app}$
moves upward. In this stage, the contact angle will decrease as the bubble grows further outward from the wall. Approximately 0.5–1 ms after nucleation the bubble will begin moving upward along the wall. As a direct consequence, the apparent upstream contact point,
 $c_{us,app}$
, starts moving upward (see figures 7 and 8). In this stage, the upstream contact angle starts increasing again, see figure 13. In addition, the real upstream contact point,
 $c_{us,real}$
, becomes clearly visible and should be accurately approximated by
 $c_{us,app}$
. Bubble detachment is reached when the upstream contact point comes close to the top of the BG, at which moment the contact angle becomes nearly 90°. At detachment, the contact angle rapidly decreases as the bubble attempts to assume an equilibrium shape, this effect can be clearly seen in the last two time instants of figure 7.
Averaged upstream (above dashed line) and downstream (below dashed line) contact angles for all flow rates; ○
 $=0.31~\text{m}~\text{s}^{-1}$
, △
 $=0.41~\text{m}~\text{s}^{-1}$
,
 $+=0.51~\text{m}~\text{s}^{-1}$
, ♢
 $=0.61~\text{m}~\text{s}^{-1}$
,
 $\times$
 $=0.71~\text{m}~\text{s}^{-1}$
, ▫
 $=0.84~\text{m}~\text{s}^{-1}$
.

The previous paragraph gives strong evidence that the real downstream contact point,
 $c_{ds,real}$
, is pinned to the top of the BG for almost the whole course of growth up to detachment. This can be further understood from differences in wettability of titanium and glass (Stevens et al.
Reference Stevens, Priest, Sedev and Ralston2003), which cause a local discontinuity in the static contact angle preventing the contact line to move easily across. For this reason,
 ${\it\beta}_{ds}$
must be an overestimation and should be near 0° for almost the whole duration of growth. Bubble detachment is reached when the two contact points approach each other, similar to necking of a bubble in pool boiling experiments.
As mentioned above,
 $c_{us,app}$
is a good approximation of
 $c_{us,real}$
in the later stages of bubble growth. However, in the early stages of bubble growth, the side view camera cannot accurately distinguish the real upstream bubble contact point. In these stages, the top view images (see figures 7 and 8) clarify that
 $c_{us,app}$
is still in good agreement with
 $c_{us,real}$
, as will now be discussed.
From the top view images, the real contact line has been distinguished in two ways. First of all, the region enclosed by the three-phase contact line is lighter than the area outside this region, where liquid is still present between the bottom of the bubble and the heater. Second, especially in the early stages of growth, the contact line reflects light from the (blue online) light source above the top view camera, see figure 5. Because of the way the optical set-up is positioned, this reflection can only be observed for the upstream bubble contact point. The reflection and light grey area can be seen in figure 15. (For comprehensibility, a supplementary movie is available at http://dx.doi.org/10.1017/jfm.2015.174 with the online version of this paper (Movie 1).) For clarity, the contrast in the images has been enhanced by adjusting the lower and upper grey scale limits. The (red online) arrows indicate the position of the bottom edge of the three-phase contact line.
Real foot visualization from two top view images; these two images are at subsequent times which shows upward motion of the bubble as a whole. The two images are shown twice, once on the left with arrows and once on the right. Contact line reflection and light grey area are indicated by arrows on the left, the (red online) dashed lines on the right indicate the estimated positions of the contact line and the real bubble foot area.

When attempting to determine the exact location of the contact line from the top view images, difficulties arise from the curvature of the bubble interface, which works as a lens and distorts the image below the bubble area. Therefore, three points on the heater surface were chosen as marker points, namely the bottom edge of the BG and two small damages in its surface, see figure 16. The position of the upstream contact point was compared with these marker positions on the top view camera at the moment the real contact line from the top view crossed these points. It was found that the difference between this contact point determined from the top and side view differ only by a maximum of 4 pixels on the side view camera. Therefore, the determination of the upstream contact point on the side view camera must be an accurate approximation of
 $c_{us,real}$
for the complete course of growth.
Three marker points used to compare the upstream contact point determined from the top and side view camera images.

These observations seem to suggest that a micro-layer region is not present on the titanium BG surface in our experiments during the later stages of growth (
 ${>}300~{\rm\mu}\text{s}$
). This implies that there is a significant dry spot area under the bubble, which is consistent with the experimental findings of Van Ouwerkerk (Reference Van Ouwerkerk1971). Remarkably, however, the part of the bubble reaching over the top edge of the BG does appear to have a micro-layer under it, since it was shown that the bubble is pinned to the heater top edge. This implies that a micro-layer may be present under a bubble in later growth stages (
 ${>}300~{\rm\mu}\text{s}$
after bubble inception), but only in situations where the bubble foot has a point to strongly pin to. Otherwise, the bubble is expected to slide along the wall without a defined micro-layer region under the bubble foot area. In the current investigation, the micro-layer does not thermally hamper bubble growth since it is positioned between the bubble and the non-heated glass. However, deformations near the bubble foot are important for the hydrodynamics of the detachment process. The micro-layer thickness in the model of Cooper and Lloyd is given by
 ${\it\delta}_{0}=0.8\sqrt{{\it\nu}t}$
, which yields a thickness of around
 $14~{\rm\mu}\text{m}$
after a growth time of 1 ms. From the side view images in the present experiments, a faint light can be distinguished from under the micro-layer region. Since the resolution of the camera is
 $5~{\rm\mu}\text{m}$
, this observation is an indication that the order of magnitude of the micro-layer thickness resulting from the Cooper and Lloyd model is correct. No quantification of the actual thickness can be derived from the experiments, however, since optical effects may play a role in the determination of this micro-layer thickness.
Van Stralen & Cole (Reference Van Stralen and Cole1979a , chapter 15) created a model to calculate the thickness of the micro-layer and the radius of the dry spot, concluding that hardly any dry spot is present beneath hemispherical bubbles in pure liquids at atmospheric and elevated pressures. According to this theory, only vapour bubbles growing in subatmospheric conditions should have a significant dry spot area. In their analysis, there was no mention of influence of surface material or roughness. The current experimental work shows that it is impossible to neglect surface material discontinuities, which a contact line of a bubble may pin to, when calculating the micro-layer thickness and dry spot area.
The apparent bubble foot area is approximated by determining both apparent contact points from the side view images and assuming a circular foot shape. Only part of this foot area covers the heater area,
 $A_{BG}$
, which is denoted by
 $A_{foot,BG}$
. The ratio of the part of bubble foot area which covers the BG,
 $A_{foot,BG}$
, to the total heater area,
 $A_{ratio}=A_{foot,BG}/A_{BG}$
, is required to determine which part of the total heat from the BG is given to the bubble foot area. Histories of the averaged ratio of these two areas are shown in figure 17 for all observed flow rates.
Histories of the
 $A_{ratio}$
, which describes how much of the bubble foot is covering the BG surface, for various flow rates.

The maximum bubble foot area is seen to be achieved after more or less 0.5 ms for all flow rates. Up to this time, the bubble shape is about hemispherical, after which the bubble will start to lift off from the wall and the bubble foot will start to decrease in size. With increasing flow rate, the upward velocity of the upstream contact point also increased, which explains why the bubble detachment time decreases with increasing flow rate, see figure 17. With respect to heat transfer considerations, as part of the contact line is seen to pin to the top of the heater, the hanging over an unheated part of the wall could slightly hamper the heat transfer from the wall to this part of the contact line and the downstream bubble part hanging over the surface discontinuity to the unheated glass part of the wall. This effect may slightly change the growth rate, but is not expected to be very significant since it will be shown (§ 4.2) that the heat transfer from the wall is relatively small as compared with heat transfer from the liquid to the bubble.
4.2. Heat transfer analysis
The introductory section (1) gave an overview of heat transfer mechanisms during vapour bubble growth and detachment as introduced by literature. The current analysis focuses on the ratio of heat given to the bubble by the wall to the total heat required for a bubble to grow, denoted by
 $\mathscr{Q}$
. In order to determine
 $\mathscr{Q}$
from the experiments, several heat flows need to be taken into consideration as is schematically shown in figure 18. The grey area surrounding the bubble represents the superheated layer of liquid, part of which is pushed outward from the wall surface by the bubble during its growth. For future reference, table 5 shows the various heat flows described in the text and their definitions.
Heat transfer during bubble growth.

Description of the various heat flows used in the current section.

The vapour bubble volume requires a certain amount of latent heat to grow, according to
 $$\begin{eqnarray}Q_{vap}(t)={\it\rho}_{v}h_{fg}V_{bub}(t),\end{eqnarray}$$
in which
 ${\it\rho}_{v}$
is the vapour mass density and
 $h_{fg}$
is evaporation enthalpy. The bubble volume as a function of time,
 $V_{bub}(t)$
, follows directly from the geometrical analysis described in the previous section. The resulting
 $Q_{vap}(t)$
histories for all flow rates are shown in figure 19.
Histories of energy required for evaporation resulting from the bubble volume averaged over 20 bubbles for each flow rate.

A part of the required energy for evaporation is extracted from the borosilicate glass substrate,
 $Q_{sub}(t)$
. The only quantity with which
 $Q_{sub}(t)$
can be calculated is the mean wall temperature
 $T_{wall}(t)$
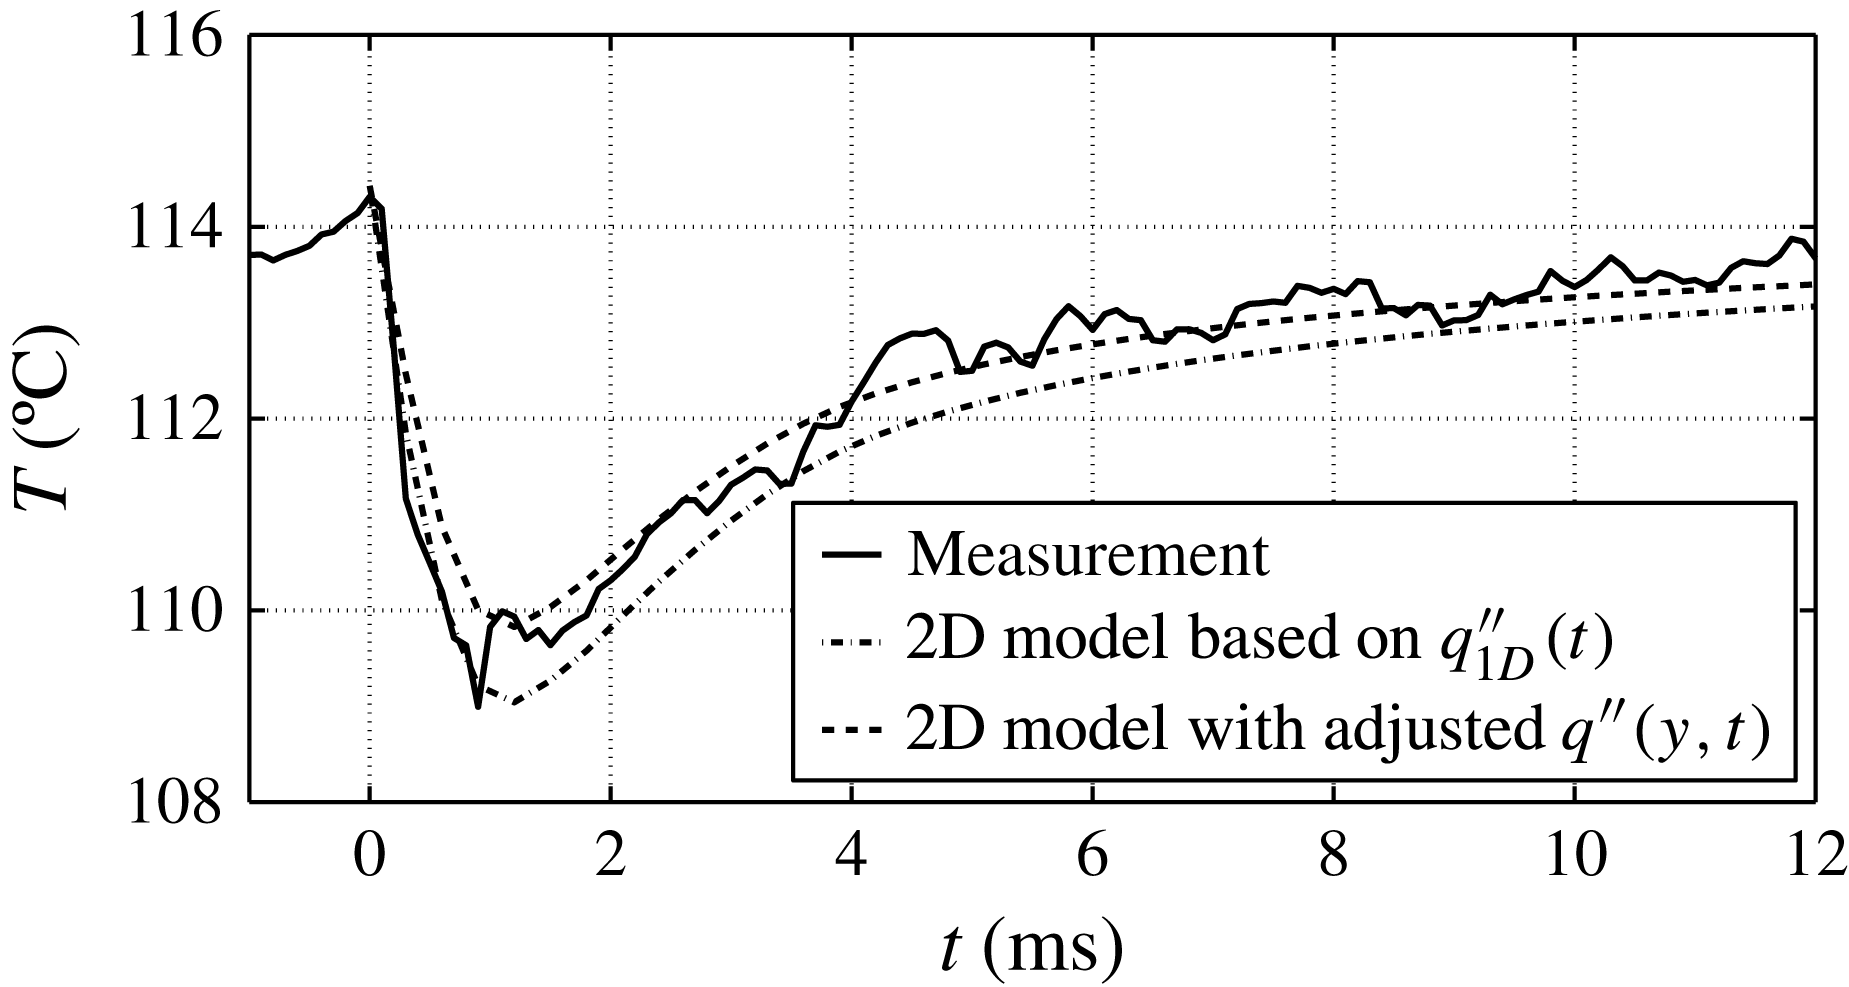
, see figure 9. The problem can in first order be treated as 1D heat conduction in a semi-infinite solid, details of which are presented below, because only the mean temperature of the wall is known and because the penetration depth of temperature changes in the substrate induced by bubble growth is small. In order to validate that this 1D approach is justified, a 2D reconstruction of the situation, based on a more realistic spatial variation of the heat flux at the BG, is evaluated in the appendix A.
As mentioned above, the average wall temperature
 $T_{wall}(t)$
is known and acts as a time-dependent boundary condition in the 1D heat conduction model. In addition, the solid is assumed to be at uniform temperature at the start of bubble nucleation (
 $T_{0}=T_{wall}(t=0)$
). The solution of the 1D heat equation for a semi-infinite solid is described by
 $$\begin{eqnarray}\displaystyle & \displaystyle {\it\psi}(x,t,{\it\tau})=\frac{x}{\sqrt{4{\rm\pi}{\it\alpha}_{sub}(t-{\it\tau})^{3}}}\exp \!\left(-\frac{x^{2}}{4{\it\alpha}_{sub}(t-{\it\tau})}\right), & \displaystyle\end{eqnarray}$$
 $$\begin{eqnarray}\displaystyle & \displaystyle {\it\phi}(x,x^{\prime },t)=\frac{1}{\sqrt{4{\rm\pi}{\it\alpha}_{sub}t}}\left[\exp \left(-\frac{(x-x^{\prime })^{2}}{4{\it\alpha}_{sub}t}\right)-\exp \left(-\frac{(x+x^{\prime })^{2}}{4{\it\alpha}_{sub}t}\right)\right], & \displaystyle\end{eqnarray}$$
 $$\begin{eqnarray}\displaystyle & \displaystyle T_{sub}(x,t)=\int _{0}^{t}\!{\it\psi}(x,t,{\it\tau})T_{wall}({\it\tau})\,\text{d}{\it\tau}+\int _{0}^{\infty }\!{\it\phi}(x,x^{\prime },t)T_{0}(x^{\prime })\,\text{d}x^{\prime }, & \displaystyle\end{eqnarray}$$
 $x$
is the normal direction into the solid substrate, with
 $x=0$
the liquid–solid interface,
 $x^{\prime }$
and
 ${\it\tau}$
are a dummy parameters that run in the same direction as
 $x$
and
 $t$
respectively and drop from the equation after integration,
 ${\it\alpha}_{sub}$
is the thermal diffusivity of borosilicate glass, and
 $T_{sub}(x,t)$
is the temperature in depth
 $x$
beneath the heater surface at time
 $t$
. The heat extracted from the glass substrate is then given by
 $$\begin{eqnarray}Q_{sub}(t)=c_{p,sub}{\it\rho}_{sub}A_{BG}\int _{0}^{\infty }\!(T_{0}-T_{sub}(x,t))\,\text{d}x.\end{eqnarray}$$
Mainly due to the low thermal diffusivity of glass, the depth at which energy is extracted from the substrate is less than 0.2 mm. The resulting
 $Q_{sub}$
histories corresponding to the mean bubble growth for each flow rate are shown in figure 20. With increasing flow rate, the bubble volume decreases and this is also reflected in the amount of energy extracted from the glass substrate. The contribution of the heat extracted from the substrate during bubble growth is one order of magnitude lower than the total energy required for evaporation during the bubble growth, which means that
 $Q_{sub}$
is not very significant for the total heat transfer. The appendix A shows through evaluation of a more realistic 2D model, with boundary condition histories based on the above measurements, that the value of
 $Q_{sub}$
as calculated by the 1D model must be quite accurate. If anything, the 1D approach is conservative by overestimating the total amount of heat extracted from the substrate. However, it is important to note that even though
 $Q_{sub}$
is mainly the result of evaporation near the wall, it is also partially the result of quenching of the hot wall with relatively cold liquid (
 $100{-}110\,^{\circ }\text{C}$
) as the bubble starts to lift off from the BG surface. Therefore, the value of
 $Q_{sub}$
calculated here must be an overestimation.
Histories of heat extracted from the substrate averaged over 20 bubbles for each flow rate.

The energy provided by the BG as a function of time is given by
 $$\begin{eqnarray}Q_{BG}(t)=\int _{0}^{t}\!P_{BG}\,\text{d}t.\end{eqnarray}$$
It is recognized that during bubble growth a part of
 $Q_{BG}$
will go to the fluid side,
 $Q_{BG,f}$
, and part of the electric energy will diffuse into the glass substrate,
 $Q_{BG,s}$
. In the case of forced convection, without boiling, the heat from the BG will create an equilibrium temperature profile in the glass substrate by thermal diffusion. Each time a bubble appears, this temperature profile is disturbed and is rebuilt again in the waiting time between subsequent bubbles. From the average wall temperature shown in figure 9 it is deduced that the energy going into the glass is not enough to compensate for the energy extracted by the vapour bubble, since the average wall temperature drops by a significant amount. This means that the electric energy going into the substrate,
 $Q_{BG,s}$
, is already a part of
 $Q_{sub}$
and the total sum of
 $Q_{BG}(t)$
and
 $Q_{sub}(t)$
goes to the liquid–vapour side.
Only part of the total electric heat is given to the bubble through the bubble foot area. The ratio of the bubble foot area covering the BG to the total BG area as a function of time,
 $A_{ratio}(t)$
, was determined for each flow rate, see figure 17. The part of the BG energy given to the bubble through its foot area can then be calculated by
 $$\begin{eqnarray}Q_{foot}(t)=\int _{0}^{t}\!P_{BG}A_{ratio}(t)\,\text{d}t.\end{eqnarray}$$
The results of the (4.9) of
 $Q_{foot}$
for each flow rate can be seen in figure 21. The curve for the highest flow rate has been raised by a constant 0.2 mJ for perceptibility. Bubbles grow larger and remain on the heater surface for a longer period of time when the flow rate decreases, which explains why the heat given to the bubble foot is larger for lower flow rates. It is important to realize that part of the energy given to the bubble foot is used for superheating of the vapour in the bubble and for heating the liquid around the contact line and does not directly add to evaporation of the liquid at the contact line. For this reason, the value of
 $Q_{foot}$
must be an overestimation when relating this energy contribution to evaporation, as will be done below.
Average heat provided to the bubble foot for each flow rate.

The bubble extracts heat for evaporation from two main sources. First, it acquires energy from the wall on which the bubble grows,
 $Q_{wall}$
, given by
 $$\begin{eqnarray}Q_{wall}(t)=Q_{sub}(t)+Q_{foot}(t).\end{eqnarray}$$
Second, energy is extracted from the superheated layer of liquid,
 $Q_{liq}$
. Although this energy cannot be measured directly, it does follow from the total heat balance on the bubble described by
 $$\begin{eqnarray}Q_{vap}(t)=Q_{liq}(t)+Q_{wall}(t).\end{eqnarray}$$
With the main energy flows analysed so far, the total picture of heat transfer during bubble growth in saturated upward flow can now be drawn. An example is shown in figure 22, which depicts the heat histories for
 $v_{bulk}=0.31~\text{m}~\text{s}^{-1}$
. The main observation from this graph is that the energy extracted from the wall (4.10) is nowhere close to accounting for the whole bubble volume. The ratio,
 $\mathscr{Q}$
, defined as
 $$\begin{eqnarray}\mathscr{Q}(t)=Q_{wall}(t)/Q_{vap}(t),\end{eqnarray}$$
is around 32 % at most. In fact, even when observing the total heat provided by the BG,
 $Q_{BG}$
, instead of the heat provided to the bubble foot,
 $Q_{foot}$
, the resulting
 $\mathscr{Q}$
would still be between 50 % and 60 % at most. These observations lead to the conclusion that, for this flow rate, the bubble extracts the majority of its energy required for bubble growth from the surrounding superheated liquid layer. It should again be noted that the superheating of the liquid adjacent to the wall comes from the same BG, which means that indirectly all heat provided for evaporation is coming from the BG.
Histories of heat contributions of vapour bubbles at
 $v_{bulk}=0.31~\text{m}~\text{s}^{-1}$
. The heat provided by the BG during the waiting time before bubble nucleation is not included but has a value of around 10 mJ.

The heat transfer ratio analysis has been applied to the bubbles for all flow rates and is shown in figure 23. Remarkably, the maximum value of the ratio appears to be relatively independent of the flow rate. In fact, the flow rate is not the only variable in these experiments, since the power fed to the BG was also varied in order to maintain a more or less steady bubble frequency as described in the measurement strategy (§ 2.5). These two variables and the maximum
 $\mathscr{Q}$
are summarized in table 6. It appears from these results that an increase in flow velocity while keeping the BG power constant leads to a slight decrease in the maximum ratio. This effect can be explained by the rate at which the bubble foot expands and decreases during the full course of bubble growth, as shown in figure 17. At higher flow rates, the bubble foot area is smaller, decreases faster and detachment of the bubble is reached sooner, all leading to a lower amount of total heat given to the bubble foot. At the same time, however, the bubble volume also decreases with increased flow velocity. In fact, the bubble volume is the major factor in this analysis and the spread on the bubble detachment volume, induced by local flow turbulence effects as described in § 4.1, is likely to explain the differences in the maximum value of
 $\mathscr{Q}$
.
The ratio of
 $Q_{wall}$
to
 $Q_{vap}$
for all flow rates as a function of time.

Maximum
 $\mathscr{Q}$
per flow rate and the applied heat flux.

Another interesting observation from figure 23 is that the maximum ratio is not located near the point of detachment, but rather a significant amount of time before bubble detachment. Near bubble detachment, the bubble foot area is very small, which means that the bubble only gains a minimal amount of heat from the BG. Nevertheless, thermally controlled bubble growth is still continuing, which is another strong indication that the bubble is still extracting most of its energy from the superheated liquid layer surrounding it.
4.3. Influence of added convective heat on bubble size
A different set of experiments was performed (Baltis & Van der Geld Reference Baltis and Van der Geld2014) to study the influence of an upstream BG, BG2, on a BG positioned at a certain distance downstream, BG1, see the left side of figure 24. One of the results of these experiments is very interesting for the current investigation on heat transfer mechanisms of a single bubble and will be further analysed in this section.
BG1 and BG2, used during these experiments, and a schematic explanation of the added convective heat from BG2 to BG1.

During these experiments (
 $T_{bulk}=100.7\,^{\circ }\text{C}$
,
 $p_{bulk}=1.05~\text{bar}$
,
 $v_{bulk}=0.45~\text{m}~\text{s}^{-1}$
), downstream generator BG1 was actively creating bubbles at a constant heater power. The only variable in this experiment is the power fed to the upstream generator,
 $P_{BG2}$
, which was incrementally increased from 0 W up to the point where this BG would generate around 100 bubbles per second. It should be noted that during the first increments in power, BG2 was not creating bubbles and only adding convective heat to the liquid flow.
Figure 24 shows a schematic of the situation at hand, in which the superheated liquid originating from BG2 is removed by forced convection and added to the superheated thermal boundary layer at BG1. As a consequence of the increased convective heat, the thermal boundary layer thickness at BG1,
 ${\it\delta}_{T1}$
, and the mean temperature in the volume adjacent to BG1 in the boundary layer,
 $\overline{{\rm\Delta}T}$
, increase with increasing power to BG2. The heat convected from BG2 to BG1 promotes nucleation at the downstream site, BG1, both in bubble frequency and in bubble radius.
The effect of
 $P_{BG2}$
on the vapour bubble detachment radius,
 $R_{bub}$
, originating from BG1 is shown in figure 25. For the here reported
 $P_{BG2}$
, this BG was not creating bubbles on its own and only adding convective heat to the liquid. Since the goal of this specific set of experiments was different, only a top view image was recorded. The bubble radius is determined by averaging the horizontal and vertical sizes of the bubble top view around detachment. This radius is expected to exceed the real volume equivalent bubble radius,
 $R_{eq}$
. The bars in figure 25 represent the standard error of the mean.
Evolution of bubble radius from BG1 with increasing power to BG2, a line is included to guide the eye.

Although the geometrical accuracy of the
 $R_{bub}$
measurements is lower than the main measurements described in the previous sections of this paper, it does provide the following very important piece of information. The increase in bubble radius is roughly linear with increase in
 $P_{BG2}$
and in the reported range the bubble radius increases by 22 %. This corresponds to an increase in
 $Q_{vap}$
from 2.8 to 5 mJ, or
 ${\sim}$
79 %. It is important to realize that the extra energy required for such a significant increase in bubble radius can only be explained by the increase in enthalpy of the volume of liquid near BG1. Contact line heat transfer and micro-layer evaporation can in no way explain these observations.
Even though
 $Q_{vap}$
increases by a factor of 1.8, the same is not expected for
 $Q_{wall}$
. In order to explain this, it is noted that the size difference in
 $R_{bub}$
at detachment found in figure 25 for varying
 $P_{BG2}$
, is directly comparable to the size difference of
 $R_{eq}$
at detachment for varying flow rates, see table 4. It is therefore possible to use the
 $A_{ratio}$
histories reported in figure 17 to estimate the
 $A_{ratio}$
values corresponding to the increase in
 $R_{bub}$
. However, it is important to note that the bubble detachment time does not vary with varying
 $P_{BG2}$
. This leads to the conclusion that, since
 $Q_{BG}$
is a constant and
 $A_{ratio}$
is expected to increase by a maximum of 20 %, the heat delivered to the bubble foot,
 $Q_{foot}$
, cannot increase by more than 20 %. A similar analysis is applied to
 $Q_{sub}$
, since a decrease in wall temperature is mainly caused by evaporation next to the wall, and must therefore be dependent on
 $A_{ratio}$
as well.
With an initial
 $\mathscr{Q}$
of 30 % at
 $P_{BG2}=0~\text{W}$
, the above analysis explains that
 $\mathscr{Q}$
is expected to decrease by a factor
 $2/3$
, resulting in a
 $\mathscr{Q}$
of 20 %. This result is in good agreement with Kim et al. (Reference Kim, Oh and Kim2006), who found an increase in
 $\mathscr{Q}$
with increasing subcooling. The present experiment effectively did the opposite of Kim et al. by adding superheated liquid to an already saturated flow.
This analysis signifies the importance of the energy content of the liquid and energy extracted from the liquid as opposed to energy extracted from the wall, especially when dealing with saturated flow boiling.
5. Conclusion
This paper describes an experimental analysis of heat transfer mechanisms on single vapour bubbles growing at a wall in saturated upward flow boiling. The analysis is supported by, and based on, an accurate reconstruction of the bubble shape through contour analysis and determination of the actual 3D bubble volume. The main aim has been to accurately determine the ratio of heat extracted from the wall and heat required to grow a vapour bubble to the observed size at detachment,
 $\mathscr{Q}$
. The main findings of this study are summarized in the following list.
-
(i) In saturation conditions,
 $\mathscr{Q}$
was found to be relatively independent of the bulk liquid flow velocity and to be around 30 % in all experiments performed. This leads to the conclusion that in forced convection a vapour bubble takes most of its energy for evaporation from the surrounding layer of superheated liquid. However, the bubbles reported in this study all have a pinned contact line. For bubbles which can freely move over a heated surface
$\mathscr{Q}$
may differ. Nevertheless, recent interest in boiling surfaces exhibiting surface inhomogeneities and materials with varying hydrophobicity underline the significance of the conclusions of this research (Takata et al.
Reference Takata, Hidaka, Masuda and Ito2003; Caney et al.
Reference Caney, Gruss, Bertossi, Poncelet and Marty2014; Qiu Reference Qiu2014).
-
(ii) When the saturated bulk flow is superheated before passing a nucleation site, essentially raising the average bulk liquid temperature near the nucleation site,
$\mathscr{Q}$
was found to decrease. With increasing bulk liquid temperature, the vapour bubble extracts more energy from the liquid as opposed to energy from the wall. -
(iii) The interface topology of vapour bubbles growing at a plane wall as well as the time between nucleation and detachment are heavily influenced by local turbulence and, therefore, pressure fields surrounding the bubble. When observing a set of independent bubbles at several flow rates, an increase in flow rate will lead to an increased spread around the mean bubble volume at detachment as well as an increase in spread around the mean time between nucleation and detachment.
-
(iv) Analysis of the initial vapour bubble growth stage by measuring the first
$300~{\rm\mu}\text{s}$
with a temporal resolution of
$3~{\rm\mu}\text{s}$
has shown evidence that the bubble growth is governed by heat diffusion over the complete course of growth. In the initial stage, heat transfer to the bubble is unaffected by the motion of the fluid away from the wall. -
(v) The contact line of the liquid–vapour interface with the wall has been clearly visible in the present experiments, in particular in the movies taken (see the supplementary material, movie 1, with the online version of this paper). A significant dry content area exists at all times.
-
(vi) The reported experiments show evidence of the existence of a micro-layer (Cooper & Lloyd Reference Cooper and Lloyd1969; Van Stralen & Cole Reference Van Stralen and Cole1979a ,Reference Van Stralen and Cole b ) between vapour bubbles and the substrate. In the initial growth stage (
${<}300~{\rm\mu}\text{s}$
) no experimental observation is possible, but the agreement with Van Ouwerkerk’s model (in which micro-layer evaporation is one of the governing heat transfer mechanisms) suggests that such a micro-layer exists in this stage. From experimental observations it can also be concluded that a micro-layer exists in later growth stages (
${>}300~{\rm\mu}\text{s}$
), but only for cases where the bubble foot strongly pins to a point on the wall during growth. The three-phase contact line of the bubbles in the present study moves freely over the titanium heater surface and no extensive micro-layer is present in this area. However, the bubbles strongly pin to the top edge of the titanium heater where there is a transition from titanium to glass. This causes the bubbles to lean over this edge and form a micro-layer under the bubble foot area on top of the glass. From these observations, it seems impetuous to conceive a model without taking into account the surface material characteristics and roughness.


Acknowledgements
This research is supported by the Dutch Technology Foundation STW, which is part of the Netherlands Organisation for Scientific Research (NWO), and which is partly funded by the Ministry of Economic Affairs. Furthermore, this work is conducted under the umbrella of the COST MP1106 Action: Smart and Green Interfaces, from single bubbles and drops to industrial, environmental and biomedical applications.
Supplementary movie
Supplementary movie is available at http://dx.doi.org/10.1017/jfm.2015.174.
Appendix A. Two-dimensional substrate temperature evaluation to support the 1D heat conduction model to calculate
$Q_{sub}$

It will be shown in this appendix that the heat extracted from the wall by bubble growth on a plane wall can be computed to a sufficient degree from a 1D analysis of the history of the mean temperature of the BG. This is done by reconstruction of the mean wall temperature history, as the measured one shown in figure 9, using a 2D heat conduction model. First, the 2D model will be described. Next, the model is employed to calculate a steady-state situation where the average wall temperature is near 115 °C. Last, starting from the steady state temperature profile the average wall temperature is reconstructed as a function of time and with inhomogeneous heat flux histories based on the experiments, which will be seen to agree well with the measured values.
Schematic of the 2D model explaining the various geometrical and thermal parameters. The heating strip is indicated by the thick black line on the water side of the glass substrate.

Figure 26 shows a schematic of the 2D model which is further explained in this paragraph. The glass substrate is a solid slab with thickness
 $D$
. The two walls of the slab are in a rectangular coordinate system positioned at
 $x=0$
and
 $x=D$
. A heating strip of height
 $L$
, representing the BG, is positioned at
 $x=0$
and its edges have the positions
 $y=0$
and
 $y=L$
. The thickness and thermal inertia of the strip is negligible in the present computations. Heat is generated in the strip, yielding an instantaneous heat source
 $q^{\prime \prime }$
into the slab in
 $\text{W m}^{-2}$
at
 $x=0$
. The heat source
 $q^{\prime \prime }$
is homogeneous and constant until a bubble is formed. The evolution of
 $q^{\prime \prime }$
during bubble growth is described below. Before the internal heat generation is activated, at
 $t=0$
, the temperature within the slab is assumed to be homogeneous at temperature
 $T_{0}$
. Convective cooling occurs on both sides of the slab. The convective heat transfer coefficient on the water side (
 $x=0$
) is
 $h_{1}$
, with bulk temperature
 $T_{b,1}$
, yielding a Biot number defined as
 $\text{Bi}_{1}=h_{1}D/k_{sub}$
with
 $k_{sub}$
being the heat conductivity of the slab. The convective heat transfer coefficient at the air side (
 $x=D$
) is
 $h_{2}$
, with bulk temperature
 $T_{b,2}$
yielding a second Biot number,
 $\text{Bi}_{2}$
. Typical values are
 $L=1~\text{mm}$
,
 $D=10~\text{mm}$
,
 $k_{sub}=1.14~\text{W}~\text{m}^{-1}~\text{K}^{-1}$
,
 $h_{1}=500~\text{W}~\text{m}^{-2}~\text{K}^{-1}$
,
 $h_{2}=10~\text{W}~\text{m}^{-2}~\text{K}^{-1}$
,
 $T_{b,1}=100.7\,^{\circ }\text{C}$
,
 $T_{b,2}=30\,^{\circ }\text{C}$
and
 $T_{0}=100\,^{\circ }\text{C}$
. Two temperature differences can now be defined, namely
 ${\rm\Delta}T_{1}=T_{b,1}-T_{0}$
and
 ${\rm\Delta}T_{2}=T_{b,2}-T_{0}$
. The temperature field in the slab is given by
 $$\begin{eqnarray}\displaystyle T(x,y,t) & = & \displaystyle T_{0}+\frac{{\it\alpha}_{sub}}{k_{sub}}\int _{0}^{t}\text{d}{\it\tau}\,h_{1}{\rm\Delta}T_{1}G|_{x=0}+\frac{{\it\alpha}_{sub}}{k_{sub}}\int _{0}^{t}\text{d}{\it\tau}\,h_{2}{\rm\Delta}T_{2}G|_{x=D}\nonumber\\ \displaystyle & & \displaystyle +\,\frac{{\it\alpha}_{sub}}{k_{sub}}\int _{0}^{t}\text{d}{\it\tau}\int _{0}^{L}\text{d}y\,q^{\prime }G|_{x=0}G|_{y=0},\end{eqnarray}$$
in which
 ${\it\alpha}_{sub}$
is the thermal diffusivity of the substrate material and
 $G$
is the Green’s function for convective heat transfer on both sides of the slab. The Green’s functions are evaluated at either
 $x=0$
or
 $x=D$
and are given by
 $$\begin{eqnarray}\displaystyle G(x,t\mid x^{\prime },{\it\tau}) & = & \displaystyle \frac{2}{D}\mathop{\sum }_{m=1}^{\infty }\exp (-{\it\gamma}_{m}^{2}\mathit{Fo})\left[{\it\gamma}_{m}\cos ({\it\gamma}_{m}x/D)+\text{Bi}_{1}\sin ({\it\gamma}_{m}x/D)\right]\nonumber\\ \displaystyle & & \displaystyle \times \,\left\{\frac{{\it\gamma}_{m}\cos ({\it\gamma}_{m}x^{\prime }/D)+\text{Bi}_{1}\sin ({\it\gamma}_{m}x^{\prime }/D)}{\text{Bi}_{1}+({\it\gamma}_{m}^{2}+\text{Bi}_{1}^{2})\left[1+\displaystyle \frac{\text{Bi}_{2}}{{\it\gamma}_{m}^{2}+\text{Bi}_{1}^{2}}\right]}\right\}~\text{and}\end{eqnarray}$$
 $$\begin{eqnarray}\displaystyle G(y,t|y^{\prime },{\it\tau}) & = & \displaystyle \frac{1}{\sqrt{4{\rm\pi}{\it\alpha}(t-{\it\tau})}}\exp (-(y-y^{\prime })^{2})/(4{\it\alpha}(t-{\it\tau})),\end{eqnarray}$$
 $\mathit{Fo}={\it\alpha}(t-{\it\tau})/D^{2}$
. The
 ${\it\gamma}_{m}$
in (A 2) are the positive eigenvalues, arranged in increasing order, of the equation
 $$\begin{eqnarray}\tan ({\it\gamma}_{m})=\left.{\it\gamma}_{m}(\text{Bi}_{1}+\text{Bi}_{2})\right/({\it\gamma}_{m}^{2}-\text{Bi}_{1}\text{Bi}_{2}).\end{eqnarray}$$
Although (A 2) is valid at all times, it has only been used to assess
 $G$
at dimensionless time differences where
 $\mathit{Fo}={\it\alpha}(t-{\it\tau})/\text{D}^{2}$
exceeds 0.022. At smaller dimensionless time differences, another expression for
 $G$
facilitated numerical evaluation. This is the time splitting technique, well described by Luikov (Reference Luikov1968, p. 232) and in more detail by Beck et al. (Reference Beck, Cole, Haji-Sheikh and Litkouhi1992). The above solution in terms of Green’s functions has been validated for two cases of which solutions are given in literature. The first case is that of a pulse-type heat source at the end of a semi-infinite thin rod (
 $D$
very large; no variation in
 $y$
direction) of which a closed analytical solution, without Green’s functions or integrals, is given by Luikov (Reference Luikov1968, p. 384). The second case is that of a slab with identical convection on both sides in which no heat source is applied, a closed analytical solution of which is given by Luikov (Reference Luikov1968, p. 214). In both cases, the above solution based on (A 2) and (A 4) has shown excellent agreement with the results known in literature.
Solution (A 1) is first used to recreate a steady state situation in which the heating strip (BG) is heating its surroundings but is not creating bubbles yet. Note that all heat generated,
 $q^{\prime \prime }$
, goes into the slab. From the measurements, the average wall temperature right before bubble nucleation is seen to be just over 114 °C. As it turns out, a heat flux of
 $0.028~\text{MW}~\text{m}^{-2}$
is required to obtain a steady-state mean wall temperature of 114.4 °C in the heating strip (BG). This implies that only 6 % of the total heat flux provided by the heating strip goes into the substrate. The remaining 94 % is provided to the fluid side. The steady-state temperature profile is reached approximately 10 s after turning on the heating strip and can be seen in figure 27. The average wall temperature at
 $x=0$
and
 $0\leqslant y\leqslant 1$
is equal to 114.4 °C, which is close to the initial value before bubble nucleation in figure 9.
Steady-state 2D temperature profile in the glass behind the heating strip; coordinate
 $x$
is the direction into the glass, coordinate
 $y$
is the direction along the wall, with the heating strip positioned at
 $x=0~\text{mm}$
and
 $0\leqslant y\leqslant 1~\text{mm}$
.

From the steady-state solution, a bubble will suddenly form, at time
 $t_{0}=10~\text{s}$
, and extract heat from the glass. Most of the heat is extracted at the location of the bubble foot as it expands rapidly over the heating strip surface, as is well known from experimental investigations by for example Moghaddam & Kiger (Reference Moghaddam and Kiger2009a
) and Wagner & Stephan (Reference Wagner and Stephan2009). This will yield a high heat flux at the bubble foot,
 $q^{\prime \prime }$
, the location and value of which vary with time. The instantaneous heat flux resulting from the 1D solution,
 $q_{1D}^{\prime \prime }(t)$
(see also figure 20), is used here as a first estimate for the time-dependent component of
 $q^{\prime \prime }(y,t)$
. The
 $y$
-coordinate dependent component of
 $q^{\prime \prime }(y,t)$
is taken in agreement with the vapour bubble contact line movement from the experiments. The history of the applied heat flux in the 2D model is shown in figure 28, together with the instantaneous wall temperature at the heating strip. The two heat flux peaks represent the bubble foot which starts from the centre of the heating strip at
 $t_{0}$
and expands outward to the edge of the heating strip, which is reached after
 $0.8~\text{ms}$
. Upon reaching the edge of the heating strip, the downflow contact line (near
 $y=1~\text{mm}$
) is pinned and the upflow contact line (near
 $y=0~\text{mm}$
) starts moving towards the downflow contact line. It is important to note that the movement of the contact line has been derived from the experimental observations, see § 4.1.
The top graph shows the heat flux distribution as a function of the
 $y$
-coordinate on the heating strip, with the different markers corresponding to consecutive time steps. The corresponding surface temperature profiles in discrete steps of 0.033 mm are shown in the bottom graph, where the dashed lines are added to guide the eye.
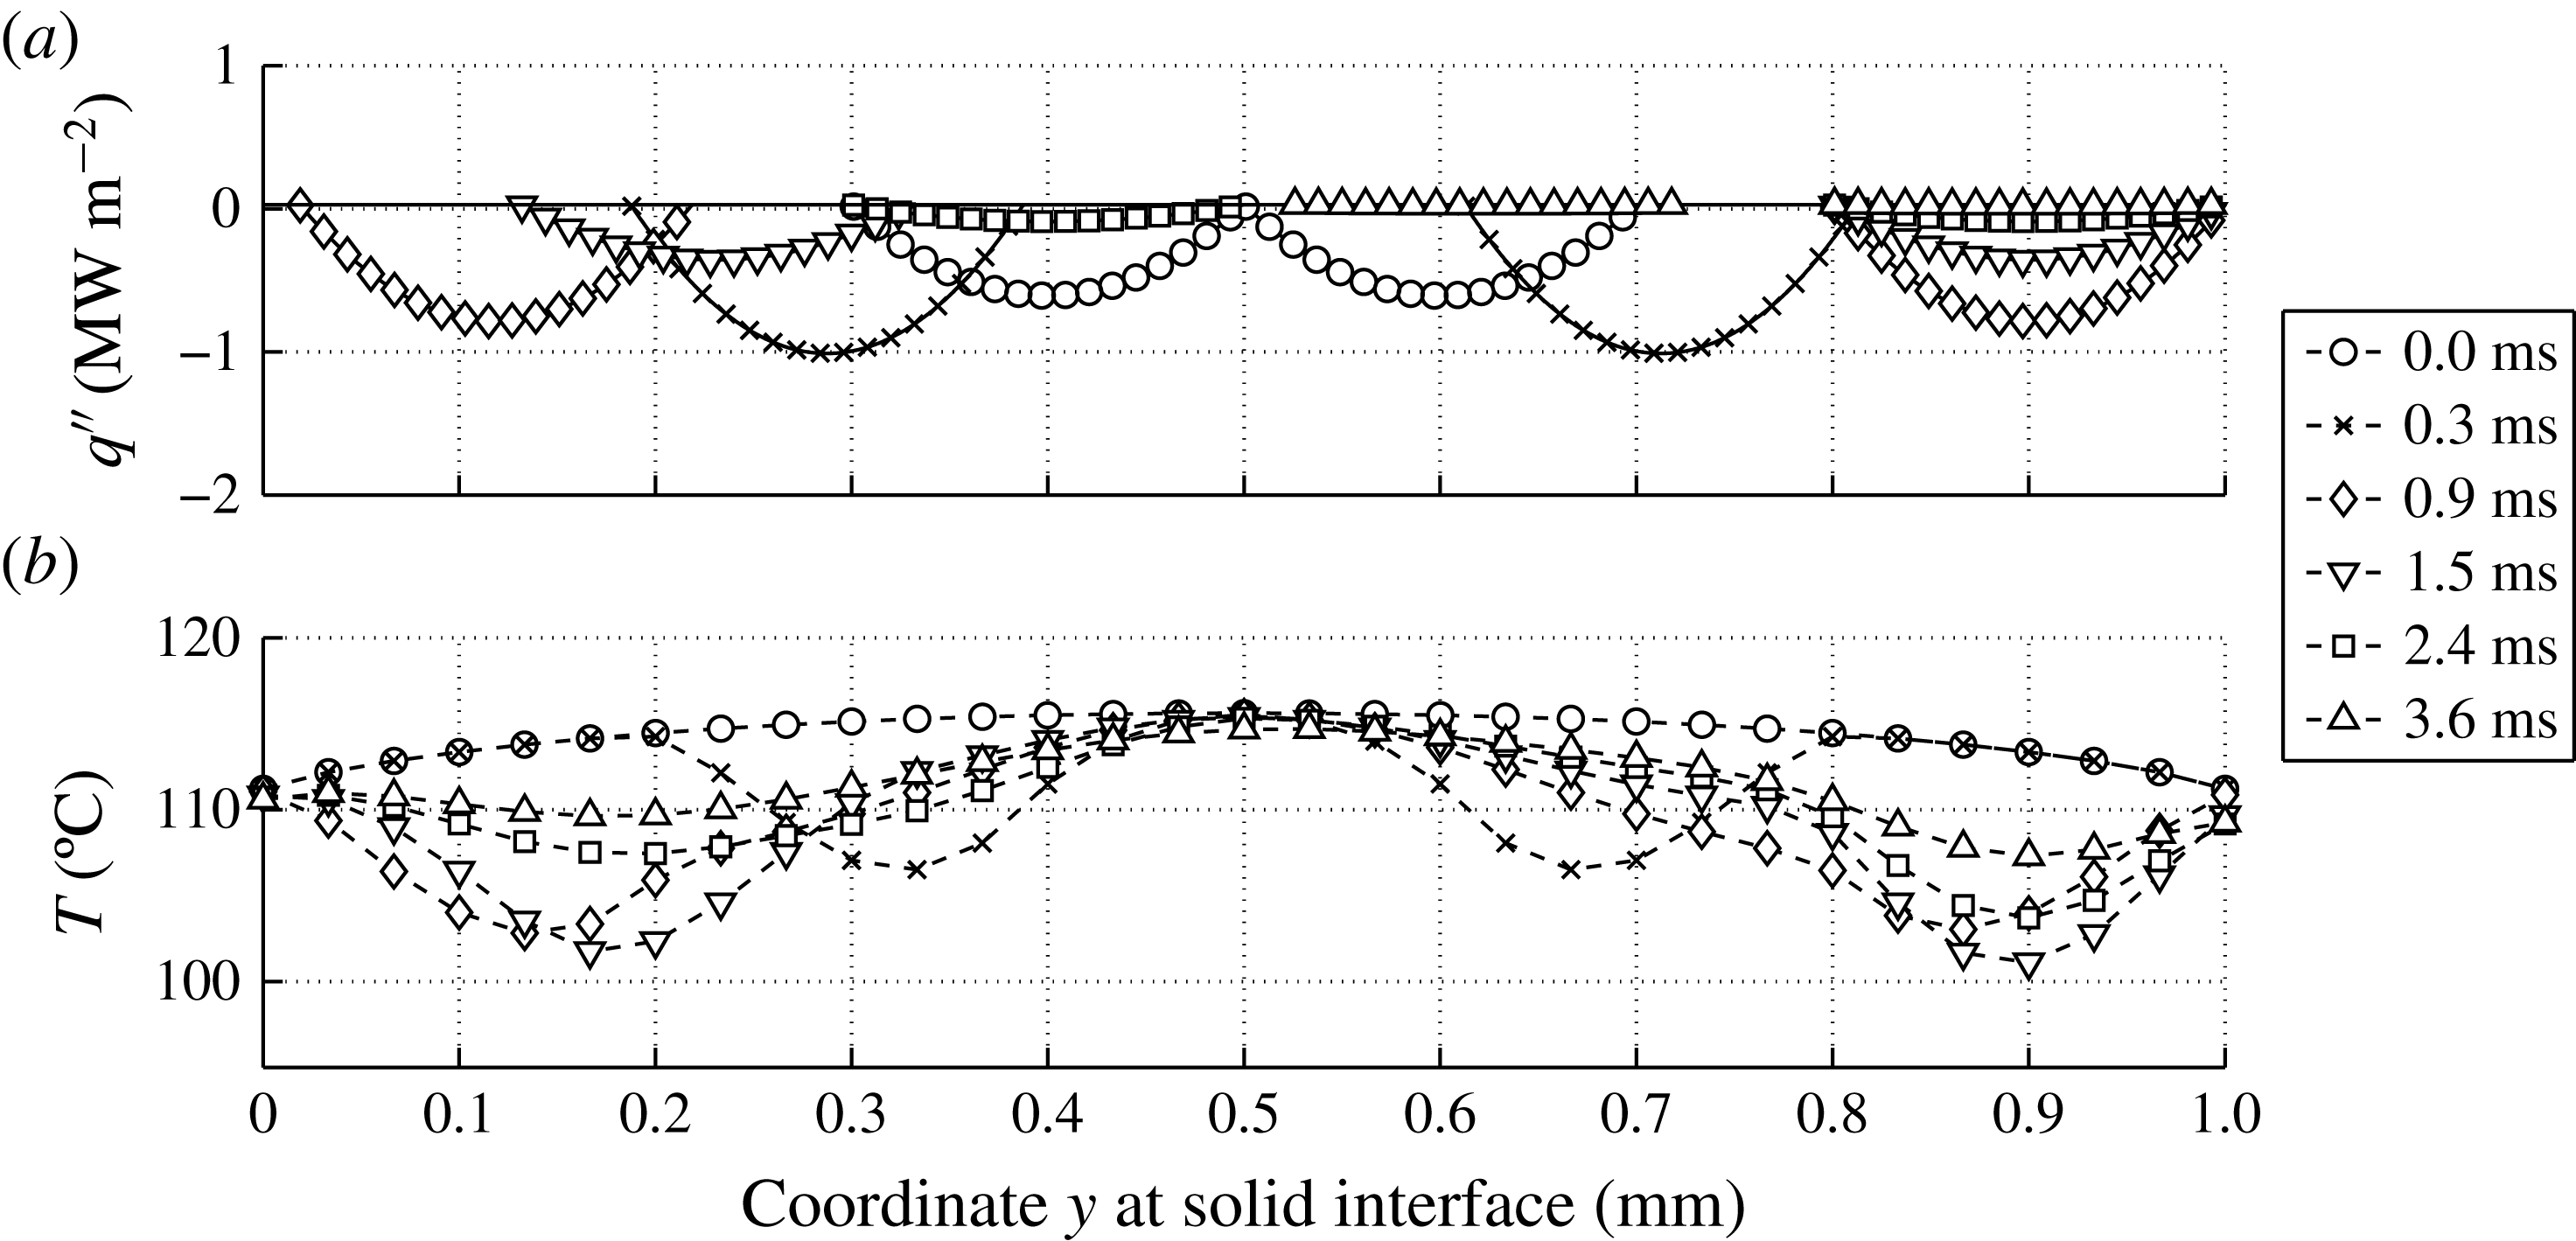
The 2D model contains two parameters which can be used to tune the resulting average wall temperature profile. The first parameter is the width of the two heat flux peaks, as shown in the top half of figure 28. Variation of this parameter has shown that a more localized heat flux is more efficient in subtracting energy from the wall. The selected value of this parameter gives quite localized heat fluxes without inducing temperatures below
 $100\,^{\circ }\text{C}$
. The second parameter is a multiplier of
 $q^{\prime \prime }(y,t)$
. As it turns out,
 $q^{\prime \prime }(y,t)$
based on
 $q_{1D}^{\prime \prime }$
yields very good agreement in the resulting average wall temperature,
 $T_{wall}$
, with the measurements in the first
 $0.8~\text{ms}$
, as can be seen in figure 29. However, after this initial period, the 2D model based on the heat flux from the 1D solution starts underestimating
 $T_{wall}$
. A second line based on the 2D model can be seen in figure 29, in which the total heat extracted from the substrate is lowered by 20 %. This adjusted
 $q^{\prime \prime }(y,t)$
agrees well with the measurements for
 $t>1~\text{ms}$
.
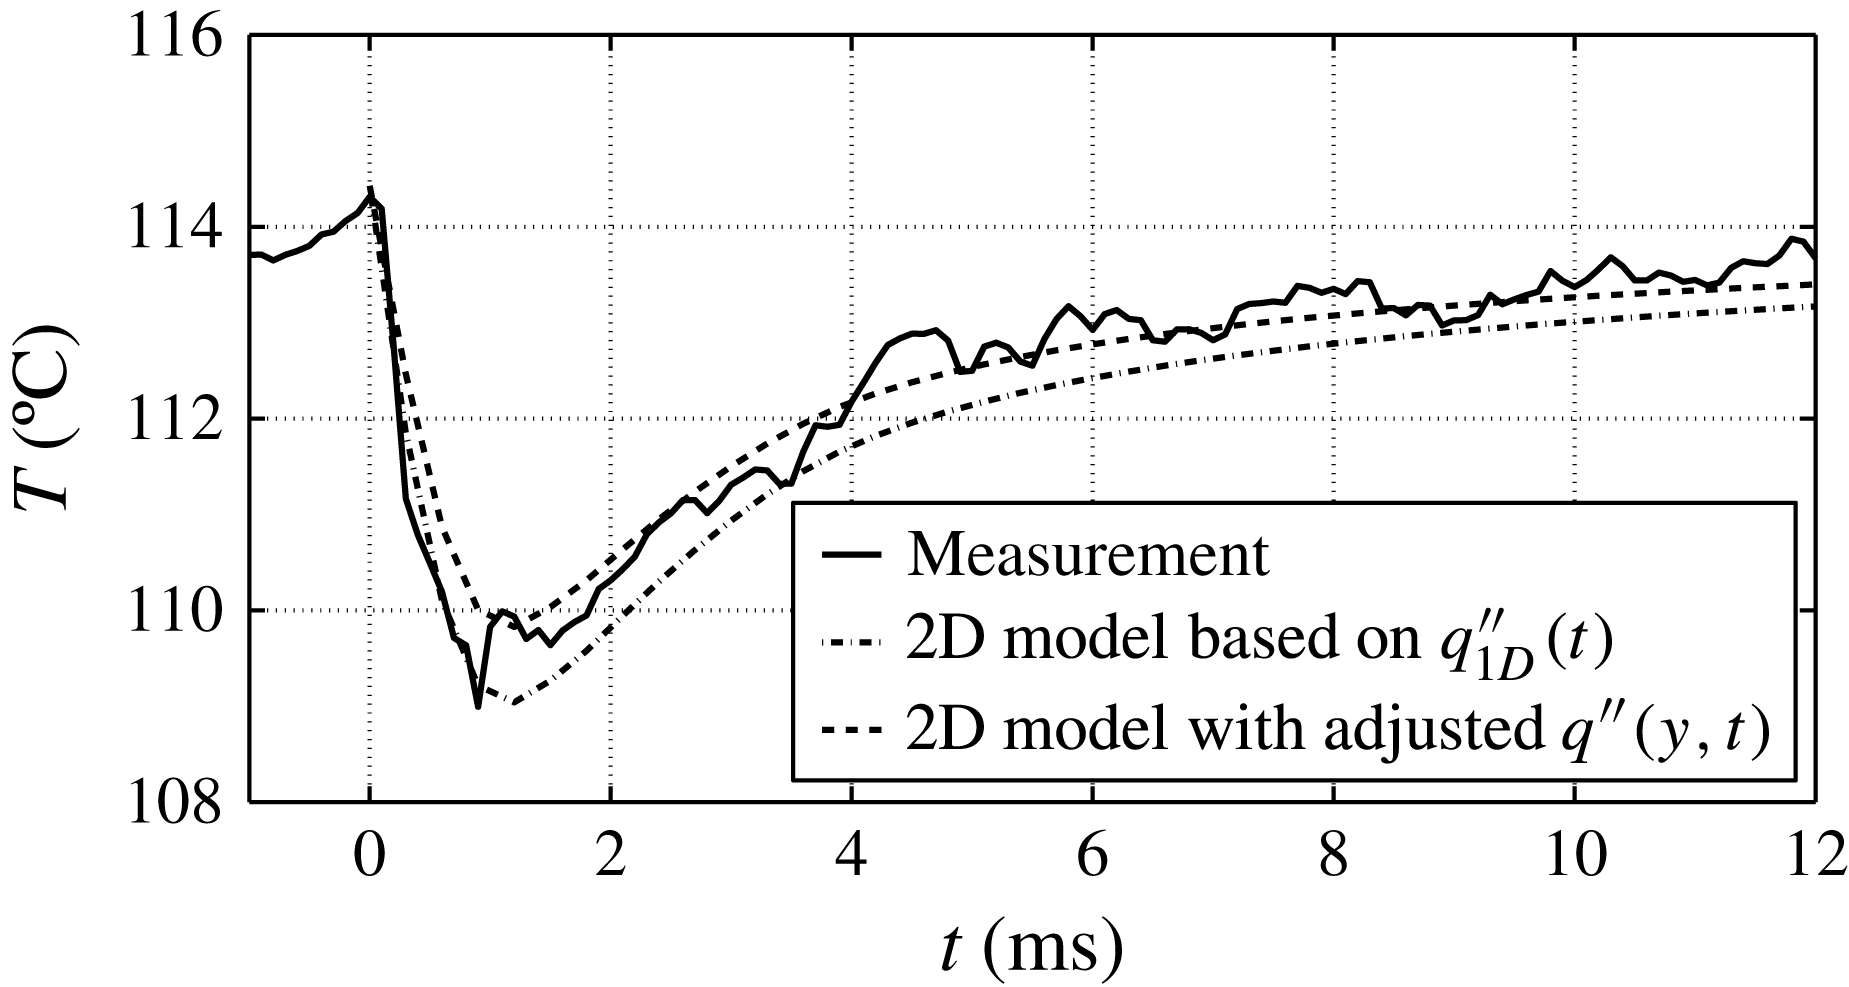
It is obvious that a history of
 $q^{\prime \prime }(t)$
based on a combination of the two histories used in figure 29 would yield very good agreement with the measured values of
 $T_{wall}$
. However, for the present purposes it suffices to conclude that these results show that the
 $q_{1D}^{\prime \prime }$
yields a slight overestimation of the total energy extracted by the bubble from the wall. The 2D model is considered to be more accurate than the 1D model because of the inhomogeneous initial temperature profile in the substrate and the more realistic spatial heat flux distributions based on experimental observations. Nevertheless, the resulting
 $T_{wall}$
profiles, as presented in figure 29, prove that the 1D model is accurate enough for the purpose of comparing to other fluxes in § 4.2. The explanation for the success of the estimate of the 1D model is readily found by comparing the temperature profile in the heating strip of figure 27 (
 $x=0$
,
 $0\leqslant y\leqslant 1$
) with the initial mean value,
 $T_{0}=114.3\,^{\circ }\text{C}$
, from the measurements. In the center (
 $y=L/2$
) the temperature exceeds
 $T_{0}$
while near the edges (
 $y=0$
and
 $y=L$
) the temperature is actually lower than
 $T_{0}$
.
The analysis in this appendix thus leads to the conclusion that the
 $Q_{sub}$
value from the 1D analysis presented in § 4.2 is accurate enough for the comparisons given in this section.