Introduction
Winegrapes are a significant crop in California. They are grown in 47 of California's 58 counties, cover 477,000 acres among 4800 winegrape growers, and rank among the State's top ten agricultural products1. California is one of the world's leading grape-producing regions, and its winegrape community had a statewide economic impact of $2.76 billion in 20042, accounting for 90% of US grape production. The success of the industry, however, depends on the use of pest control strategies to manage the insects, mites and diseases that threaten the crop every year. In order to maximize crop production, California growers use many pounds of sulfur and other fungicides to control disease and apply a variety of miticides and insecticides to control mites and insects, respectively.
Sulfur is the leading pesticide active ingredient used on winegrapes in California, accounting for 95–98% of the total weight of pesticide used on the crop3. Although sulfur is very effective in controlling grape powdery mildew, Uncinula necator (Schw.) Burr., and is a relatively safe4 natural element in terms of its environmental toxicity, the use of sulfur can degrade air quality, create foul odor, cause irritation of the eyes and skin, and result in breathing difficulty. A survey by the California Department of Pesticide Regulation (CDPR) found 86 reported incidentsReference Ross5 of sulfur drift from 1997 to June 1999. Two-thirds of the reports cited grapes as the target source and 80% were attributed to sulfur dust applications. Similarly, Browde and OhmartReference Browde and Ohmart6 reported that a high percentage of drift incidents were attributable to sulfur dust applications. The susceptibility of sulfur dust to offsite movement by wind creates conflicts with the human and social environment, particularly as residential areas move closer to agricultural lands, increasing the agriculture/urban interface. Despite the drawbacks of sulfur use, growers rely on sulfur for disease control because of its low cost, ease of application and proven lack of resistance of the major fungal pest of grapes: powdery mildew.
Many studies have linked frequent applications or high use rates of sulfur dust to a reduction in predatory mite populations in grape-growing regions around the world, including California and the Pacific Northwest. In a single-season study of a vineyard near Madera, Hanna et al.Reference Hanna, Zalom, Wilson and Leavitt7 found that regular sulfur applications for powdery mildew control can exacerbate spider mite problems in vineyards by suppressing populations of predatory thrips and predatory mites. Research by Calvert and HuffakerReference Calvert and Huffaker8 found a consistent correlation between overwintering field populations of the spider mite predator, Western predatory mite Galendromus (=Metaseiulus) occidentalis and number of sulfur treatments. Lower predatory mite populations were found in the ten-treatment sulfur plots than in the random, control, pollen treated and four-treatment sulfur plots. In a study of two Thompson seedless raisin-producing vineyards in southern Madera county, English-Loeb et al.Reference English-Loeb, Flaherty, Wilson, Barnett, Leavitt and Settle9 found that Pacific and Willamette mite pests became abundant on vines after sulfur treatment stopped, indicating that some form of sulfur disruption was occurring. Similar results have been obtained for predatory mites in other crops, such as hops in the Pacific NorthwestReference Calvert and Huffaker8. On the other hand, some studies find no effect of sulfur on predatory mitesReference Gent, James, Wright, Brooks, Barbur, Dreves, Fisher and Walton10.
Research in this field is now exploring possible mechanisms of mite outbreak stimulation by sulfur apart from its effects on natural enemy mortality. Costello and AlbersReference Costello and Albers11 proposed that the observed sulfur disruption of mite populations may be due to a plant-based factor, with sulfur acting to suppress the ability of the plant to defend itself against mite attack, rather than by suppression of predatory mite populationsReference Costello12. SulfurReference Gerson, Gafni, Paz and Sztejnberg13 and other fungicidesReference Klingen and Westrum14 have been shown to kill another natural enemy of mites—acaropathogenic fungi. Another study found that sulfur use decreases not only populations of beneficial predatory mites but also their feeding behaviorReference Beers, Martinez-Rocha, Talley and Dunley15. Grape powdery mildew, which is suppressed by sulfur treatment, may also be an important food source for some generalist predatory mite species which are important in vineyardsReference Pozzebon, Loeb and Duso16. A recent study found a greater effect of sulfur on decreasing fecundity than on increasing mortality in Oregon's dominant vineyard predatory mite, Typhlodromus pyri Reference Gadino, Walton and Dreves17.
Other research has identified a broader relationship between the use of insecticides and disruption of natural mite controls. UC IPM18 guidelines report that ‘spider mites have been serious pests for several decades, and for reasons not yet fully documented, it is believed that use of synthetic organic insecticides has upset natural controls in some situations.’ For example, Prischmann et al.Reference Prischmann, James, Wright, Teneyck and Snyder19, Reference Prischmann, James, Gingras and Snyder20 found that either chlorpyrifos, sulfur or combinations of the two dramatically reduced populations of several predatory mite species in Washington State vineyards. While toxic effects of many insecticides toward predatory mites are short-livedReference Irigaray, Zalom and Thompson21 some show prolonged persistence. For example, Zalom et al.Reference Zalom, Stimmann, Arndt, Walsh, Pickel and Krueger22 found that residues of permethrin and esfenvalerate were toxic to G. occidentalis for up to 7 months after application.
Improved sulfur management, with regard to amount, frequency and formulation of sulfur used, can not only reduce the incidence of drift and associated human exposures but may also allow for reduction of subsequent insecticide and miticide use to deal with sulfur-induced pest outbreaks. Sulfur management practices that maintain natural enemies of pest mites may be important parts of a strategy to reduce the use of the most highly toxic miticides, specifically those targeted before 2006 for reduction under the Food Quality Protection Act (FQPA).
This study uses a novel approach to examine the sulfur use patterns in the selected four counties and to shed some light on the relationship between sulfur use and toxicity of pesticides. Data from the Pesticide Use Report (PUR) database of the CDPR23 are examined to identify whether sulfur product choice or application rates show a relationship to the total annual amount of applied miticides and insecticides in the major winegrape-growing regions of California. Sulfur management in coastal and valley counties of California was investigated to explore the relationship between sulfur and miticide use in these distinct winegrowing areas. The analysis of the relationship between sulfur and miticide/insecticide use focuses on specific active ingredients on the FQPA pesticide Priority Lists I & II24 (hereafter ‘FQPA I & II’), which indicates that they are targeted for reduction due to their high toxicity.
Materials and Methods
Study areas
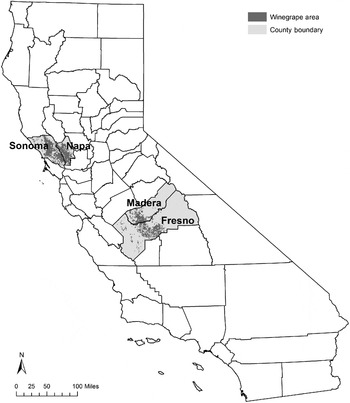
Due to the wide climatic range of winegrape-growing regions in California, this study selected four counties (Fig. 1) to represent the distinctive valley and coastal weather conditions. Fresno and Madera were selected to represent the hotter and dryer inland valley wine-growing region, while Napa and Sonoma were selected to represent the more moderate and humid weather conditions of a coastal wine-growing region. It is important to note that microclimates within each region also have important effects on pest and disease pressures, and these local variations would affect pest management strategies.
Study site, the four selected counties (Napa, Sonoma, Madera and Fresno) growing winegrape in the state of California.

Fresno county, located in the southern San Joaquin Valley, is the largest agricultural county in California, producing approximately 15% of all winegrapes grown in the State. Most of Fresno's agricultural lands are located in the western portion of the county. Fresno has hot and dry summers with average maximum temperature of ∼96–98°F in July–August. Average annual rainfall is ∼10 inches.
Madera county, situated in the heart of California's central valley, is another major agricultural county. It is bordered to the south by Fresno county and to the north by Merced and Mariposa counties. Winegrapes account for more than 45% of the agricultural acreage in Madera county and this county hosts 10% of the State's winegrape acreage. Similar to Fresno, Madera has warm and dry summers with an average maximum temperature in July of 99°F, though the hottest day in July of 2005 was over 110°F. Average annual rainfall is ∼12 inches.
Napa county is in the heart of Napa Valley, 63 miles southwest of Sacramento and 47 miles northeast of San Francisco. This county is filled with world-renowned vineyards and surrounded by a rim of rolling hills and mountains of spectacular beauty. In 2006, the North Coast region, which includes both Napa and Sonoma counties, produced US$779 million of winegrapesReference Volpe, Green, Heien and Howitt25. Winegrape acreage in Napa county accounts for approximately 7% of California's total. The climate in Napa is mild, with an average maximum temperature in the summer of ∼70°F, an average annual rainfall of 23.88 inches, and monthly humidity averages ranging from ∼65 to 80% throughout the year.
Sonoma county is located on California's Pacific coast north of the San Francisco Bay Area. The value of Sonoma county winegrapes is approximately US$310 million annually, and its winegrape acreage accounts for ∼12% of the State's total. The climate of the county is characterized by moderate temperatures and precipitation. Along the coast, temperatures remain cool throughout the summer, due to the great moderating influence of the ocean. From late summer to fall the average sea-water temperature is approximately 55°F. Throughout the county, average seasonal precipitation ranges from less than 20 inches in the extreme southeast corner to 30–40 inches over much of the central part to 70–80 inches in the mountain areas.
Based on the PUR data, in 2009 there were 800 growers growing more than 55,000 acres of winegrapes in Fresno, 600 growers growing more than 42,000 acres of winegrapes in Madera, 1800 growers growing more than 49,000 acres in Napa and 2200 growers growing 64,000 acres of winegrapes in Sonoma.
Sulfur management strategies
Sulfur is a time-tested and staple element in the winegrape grower's toolbox of strategies to prevent powdery mildew. A variety of factors must be considered to effectively manage sulfur use, including weather, canopy management, disease monitoring, appropriate calibration and selection of equipment, appropriate rates and timing of applications, and other interrelated factors. This research focuses specifically on the product choice (formulation) and application rates of sulfur using PUR data for all winegrape growers and fields that had reported pesticide use in each of the four counties considered.
Agricultural sulfur products may be formulated for use as nutrients, soil amendments or pesticides. They are generally finely divided, averaging 93% passage through a no. 325 US sieve, and formulated into either wettable powders or dusts. Wettable powders are formulated by blending dispersants and surfactants together and then milling to a very fine particle size. These products are used primarily as fungicides or miticides. Wettable sulfur can be applied as a ground spray or by aerial application. Dusting sulfur, formulated at 98%, is primarily used as a fungicide, and can also be applied either by ground or air. Dust sulfur products usually cost less than wettable sulfur products.
Most grape growers consider dust sulfur to be more harmful to predatory mites than wettable sulfurReference Gent, James, Wright, Brooks, Barbur, Dreves, Fisher and Walton10. Sulfur dust particles are thought to physically interfere with predatory mites’ ability to search for prey, but wettable sulfur particles could have a similar effectReference Costello and Albers11, Reference Breyer and Frey26. Costello and AlbersReference Costello and Albers11 concluded that use rate is the primary determinant of sulfur impact on mite populations. Thus, the differential use rates of dust and wettable formulations, which are dictated by the labels, may lead to differences in their effects on pest mites. This study investigates both formulation types and use rates.
Three sulfur management strategies were defined and investigated using the PUR data: growers who applied only dust sulfur are categorized as ‘dust only’; those who applied only wettable, flowable or other forms of liquid sulfur are categorized as ‘wettable only’; and those who applied both dust and wettable sulfur are categorized as ‘combo’.
PUR data organization and treatment
The PUR database records every pesticide application in California that is reported to local agricultural commissioners. For each pesticide application, there are 32 data fields detailing the product type and active ingredient(s) of the specific pesticide used, the crop, the area over which it was used, the operators who applied it, as well as the date, time, quantity and rate of the application27. The spatial resolution of each pesticide application is aggregated to the level of the section, or one square mile area. PUR data collected between 1993 and 2009 were used to delineate the sulfur management strategy for each winegrape grower in the four selected counties. Pesticide use on winegrapes in the selected four counties was queried from the PUR database, and prior to use the data were checked for errors following the error checking procedures developed by Wilhoit et al.Reference Wilhoit, Zhang and Ross28 to remove outliers from the dataset. Pesticide applications were aggregated by grower, and the sulfur management strategy for each grower was identified by analysis of the dust and wettable sulfur products used. Miticide, insecticide and oil applications for each grower were also identified, with a specific focus on FQPA category I & II (‘danger’ and ‘warning’ chemical groups based on the toxicity) miticides and insecticides. Simple statistical methods such as analysis of variance (ANOVA) test with post-hoc pairwise t-test and Pearson correlation test were used to evaluate the data. Both methods were performed in R29.
Results and Discussion
Use trends and economic characteristics
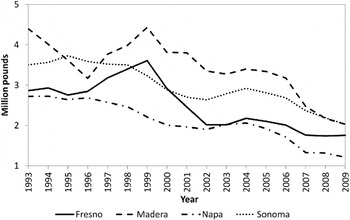
Statewide, annual pesticide use on winegrapes decreased by 26% between 1993 and 2009, from 27 to 24 million pounds. Meanwhile, vineyard acreage increased by 73%, from about 366,000 to 632,000 acres. The four counties selected for this study had a more pronounced decrease in pesticide use than the state, with 47, 55, 51 and 36% decreases observed for Fresno, Madera, Napa and Sonoma counties, respectively, over this period (Fig. 2).
Total pounds of pesticide used in Fresno, Madera, Napa and Sonoma county winegrapes 1993–2009.

Economic impacts on pesticide use decisions may differ between the two distinct wine-growing regions of the north coast and central valley. In Napa and Sonoma counties, grower returns have remained higher than in Fresno and Madera, with the difference growing between 1993 and 200930, 31. Higher returns in Napa and Sonoma offer greater flexibility to choose higher cost products and pest management approaches.
Sulfur management
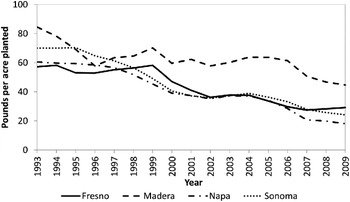
Sulfur application rate declined by 56, 49, 64 and 63% in Fresno, Madera, Napa and Sonoma counties, respectively, between 1993 and 2009 (Fig. 3). Sulfur use decline may be related to complaints of drift, odor and air quality problems stemming from sulfur use as development has moved closer to farms. Regulatory entities are also concerned about improving sulfur management to reduce its impact on air quality, which could result in increased regulation in the future. Growers perceive proactive management of sulfur drift as a means of preventing further regulation and ensuring sulfur's ongoing availability as a viable tool to manage powdery mildew in winegrapesReference Campos and Zhang32. State agencies, such as CDPR, have funded projects to support industry efforts to improve sulfur management4.
Sulfur use intensity (pounds per acre planted) in Fresno, Madera, Napa and Sonoma county winegrapes from 1993 to 2009.

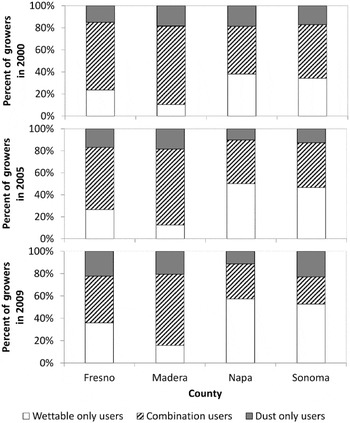
In each of the four counties considered the combination of dust and wettable sulfur formulations was the largest use category in 2000, 2005 and 2009; however, more growers in Napa and Sonoma used only wettable sulfur than in Fresno or Madera (Fig. 4) in all three selected years. In 2000, approximately 38 and 34% of respective Napa and Sonoma growers relied on wettable formulations only, while only 24 and 10% of respective Fresno and Madera growers relied exclusively on them. In 2005, approximately 50 and 47% of respective Napa and Sonoma growers relied on wettable formulations only, while only 26 and 13% respective Fresno and Madera growers applied them exclusively. In 2009, similar patterns were found for the four counties, 57% for Napa, 53% for Sonoma, 36% for Fresno and 16% for Madera. The percent of growers using only sulfur dust formulations was similar across all counties, ranging from 15 to 19% of growers in 2000, from 10 to 18% in 2005 and from 11 to 23% in 2009 (Fig. 4).
Percent of growers using sulfur dust only, wettable sulfur only or a combination of dust and wettable sulfur in Fresno, Madera, Napa and Sonoma county winegrapes in the year 2000, 2005 and 2009.

There are several likely reasons why the north coast counties appear to have greater use of wettable sulfur formulations than the valley counties. Cost is probably a factor, with valley counties having much smaller profit margins than coastal counties, making the use of higher-cost wettable sulfur formulations less economically feasible. Another potential reason is the greater role of tourism in the north coast counties. With year-round tourism a major industry in Napa and Sonoma counties, growers there are under greater pressure to avoid unpleasant odors associated with the more drift-prone dust formulations. The higher rainfall and humidity in Napa and Sonoma, relative to Fresno and Madera are also likely factors. Wettable sulfur is an effective treatment once mildew becomes visible. The wetting agents and water eradicate the mildew, while the remaining sulfur kills new spores33. This post-infection action of wettable sulfur would be particularly useful in the cooler, damper region represented by Napa and Sonoma, where disease pressure is higher.
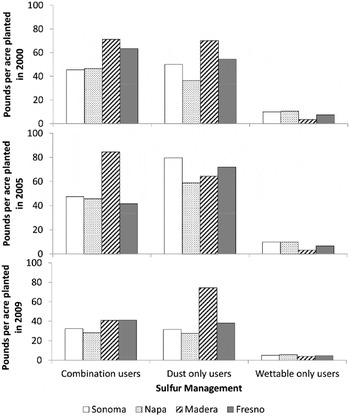
Figure 5 and the ANOVA test demonstrate the large statistical difference in use intensity (pounds per acre planted) between sulfur dust or ‘combo’ and wettable sulfur formulations (α = 0.05). However, the results from the pairwise t-test showed that there is no significant statistical difference between the use intensities of ‘combo’ and ‘dust only’ users (P < 0.05). For both of these groups, the sulfur use intensity is lowest in Napa, slightly higher in Sonoma, followed by Fresno, then Madera (Fig. 5).
Sulfur use intensity (pounds per acre planted) related to winegrape sulfur management (dust, wettable or combination users) in the year 2000, 2005 and 2009.

Insecticide use related to sulfur management
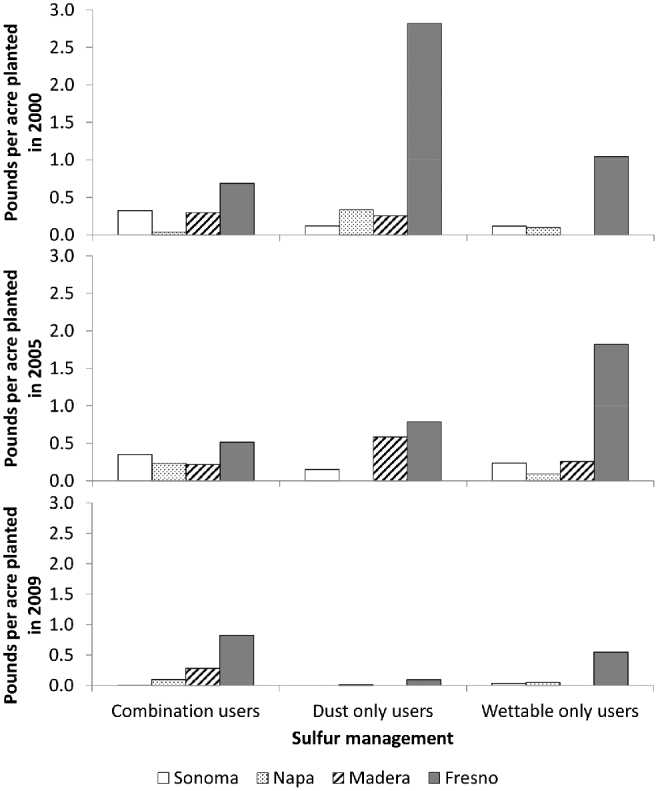
The growers in Madera county who use wettable sulfur only, do not use FQPA I & II insecticides; however, the number of growers using wettable sulfur only in Madera is low (Fig. 6). The growers in Fresno county who apply wettable sulfur only, use FQPA I & II insecticides at 34 and 76% lower use intensity than the combination and dust sulfur users, respectively in 2000, 72 and 35% lower in 2005 and 51 and >700% higher in 2009 (Fig. 6). Based on the ANOVA test, there are no statistically significant differences in the use intensity of FQPA I & II insecticides across sulfur management categories between Sonoma and Napa counties at the significance level of P < 0.05. Fresno has the highest use intensity of FQPA I & II insecticides, averaging 1.22, 0.61 and 0.36 pounds per acre planted for 2000, 2005 and 2009, respectively, for all sulfur management categories. This average is 579, 129 and 398% higher in 2000, 2005 and 2009, respectively, than the average use intensity of FQPA I & II insecticides for Sonoma and Napa, which is 0.18, 0.26 and 0.07 pounds per acre planted in 2000, 2005 and 2009, respectively (Fig. 6).
High-risk (FQPA priority I & II) insecticide use intensity (pounds per acre planted) related to winegrape sulfur management in the year 2000, 2005 and 2009.

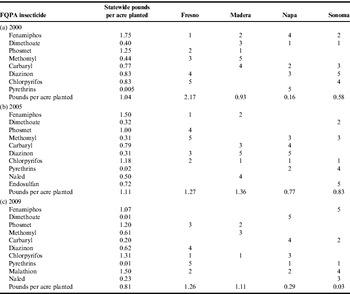
The striking difference in use intensity of FQPA I & II insecticides between the coastal and valley regions did not appear to reflect choices of specific pesticides with different associated use rates. Table 1 shows the top five FQPA I & II insecticides used in Fresno, Madera, Napa and Sonoma counties in 2000, 2005 and 2009 according to total acres treated with the chemicals. When the statewide average use intensities of these top five FQPA insecticides are compared across counties, the differences are not statistically significant (ANOVA test with α = 0.05). The statewide average use intensity of the top five FQPA I & II insecticides in 2000 is 2.17, 0.93, 0.16 and 0.58 pounds per acre planted for Fresno, Madera, Napa and Sonoma counties, respectively. In 2005, the use intensity is 1.27, 1.36, 0.77 and 0.83 pounds per acre planted, while the 2009 use intensity is 1.26, 1.11, 0.29 and 0.03 pounds per acre planted for Fresno, Madera, Napa and Sonoma, respectively (Table 1). Therefore, the lower use intensity of FQPA I & II insecticides in Napa and Sonoma (Fig. 6) are clearly a function of pest pressure and grower decision-making regarding insect management, and not simply a function of lower label rates based on pesticide choices in each county.
FQPA priority I & II insecticide use ranked according to the top five total acres treated with the chemical in Fresno, Madera, Napa and Sonoma county winegrapes in (a) 2000, (b) 2005 and (c) 2009.

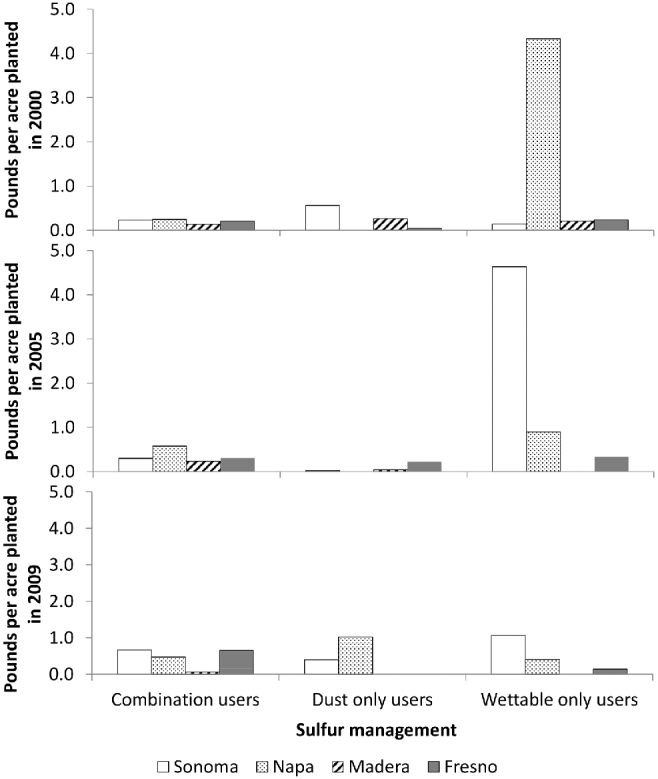
‘Dust only’ users in Fresno and Madera counties show lower use intensities of FQPA priority III and other insecticides (generally lower risk insecticides) than the ‘combo’ or ‘wettable only’ growers (Fig. 7). The choices of applying a combo or wettable sulfur only could be a reflection of grower pest management style. Use of the more expensive wettable sulfur indicates that the grower is aware of the benefits of its use and is willing to adopt the most appropriate material. Wettable sulfur use may be less harmful to predatory mites than sulfur dust, possibly by virtue of lower use ratesReference Costello and Albers11. Wettable sulfur also has less of an impact on air quality than sulfur dust because it is less prone to drift34. However, applying wettable sulfur takes more time than dusting, and complete coverage of all surfaces is critical for suppressing fungal growth. Both dust and wettable sulfur formulations may also contain inert ingredients of concern for volatile organic compound issuesReference Zeinali, McConnell, Hapeman, Nguyen, Schmidt and Howard35. The fact that the ‘dust only’ users are using less low-risk insecticides supports the assumption that these growers may be less willing to experiment with newer, ecologically more sound materials.
Lower-risk (FQPA priority III and other) insecticide use intensity (pounds per acre planted) related to winegrape sulfur management in Fresno, Madera, Napa and Sonoma counties in 2000, 2005 and 2009.
Miticide use related to sulfur management
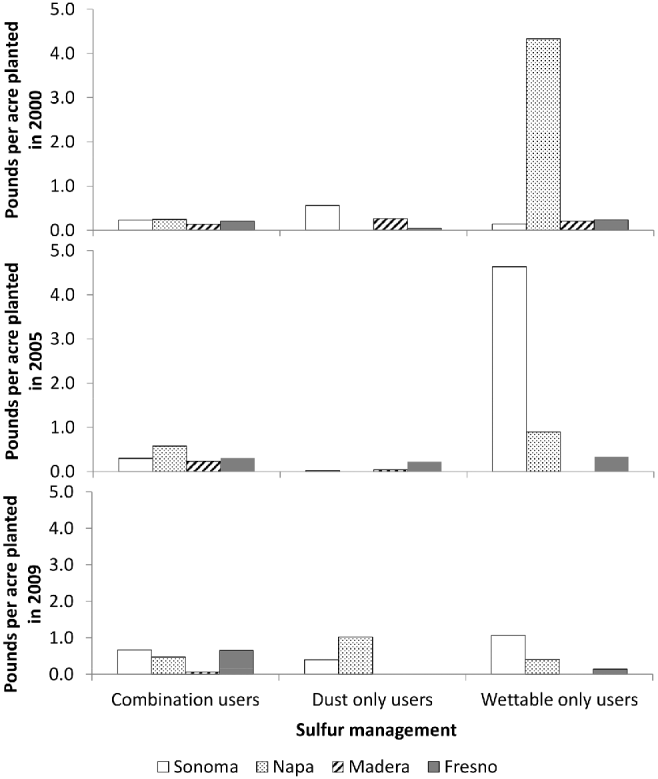
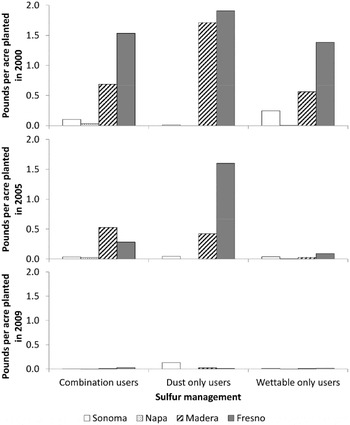
‘Dust only’ users in Madera county used 30 and 94% more FQPA I & II miticides than ‘combo’ and ‘wettable only’ users, respectively, in 2000 (Fig. 8). However, that trend did not continue in the data for 2005 and 2009. This may be because FQPA review was completed in 2006 and the regulation did affect the practices in the field (Fig. 8). ‘Dust only’ users in Fresno county applied 4 and 12% more FQPA I & II miticides than ‘combo’ and ‘wettable only’ users, respectively, in 2000. This trend also did not persist in the data of 2005 and 2009 (Fig. 8). In Napa county, sulfur ‘dust only’ users used no FQPA I or II miticides in the 3 years we selected. Overall, Napa growers used the least FQPA I & II miticides of all counties considered. The average FQPA I & II miticide use intensity in Fresno and Madera counties was higher than in Napa and Sonoma counties by 1349% in 2000, 1103% in 2005 and 146% in 2009 (Fig. 8).
FQPA priority I & II miticide use intensity (pounds per acre planted) related to winegrape sulfur management in the year 2000, 2005 and 2009.

Some published studies have identified a relationship between sulfur use and increased mite outbreaks in vineyards, and suggest that it is the result of sulfur impacts on either predatory mitesReference Costello and Albers11, the grapevine's pest mite resistanceReference Costello12 or other factors. Dust from roads and disking exacerbates mite problems and sulfur dust may have a similar effectReference Zalom, Stimmann, Arndt, Walsh, Pickel and Krueger22. The relationship between broad-spectrum insecticide use and mite outbreaks has a similar mechanism of disrupting mite predators. Many pesticide active ingredients are known to be highly toxic to mite predators including sulfur, Carbaryl, Chlorpyrifos, Diazinon, Dimethoate, Esfenvalerate, Malathion, Methomyl, Phosmet, Dicofol and Propargite18. Hormoligosis is ‘the phenomenon in which subharmful quantities of many stress agents may be helpful when presented to organisms in suboptimal environments’Reference Luckey36. This mechanism may allow insecticide exposure to increase the reproductive capacity of pest mites, resulting in mite outbreaks after certain pesticide applications.
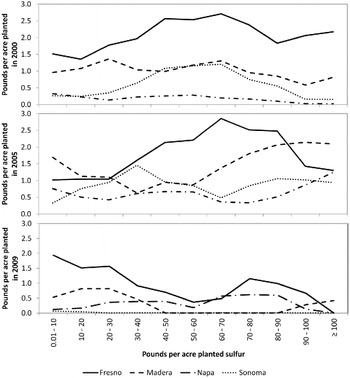
Based on the 3 years of data we selected, it is difficult to identify any conclusive trend between higher use intensities of sulfur and higher use intensities of FQPA I & II insecticides and miticides in the four counties (Figs. 9 and 10). Although there may be a slight positive trend observed for Fresno (r = 0.55, P = 0.08) and Madera (r = 0.52, P = 0.08), the data for Napa and Sonoma did not show a clear relationship. However, Sonoma county data show increased FQPA I & II miticide use intensity when sulfur was used above 20–70 pounds per acre planted in the year 2000 (Fig. 9). The lack of a significant correlation in these two cooler coastal counties could simply be a result of lower overall insect and mite pest pressure. The dramatic differences in use rates of all categories of insecticides and miticides in Napa and Sonoma versus Fresno and Madera across all sulfur use categories (Figs. 6–9) would be consistent with lower pest pressure in Napa and Sonoma. The lack of correlation may also be due to factors other than pest pressure which influence a grower's pest management decisions. These decisions involve a complex set of judgments that will vary based on economic, social, meteorological, seasonal and other complex factors. Thus, pest pressure may not always translate quantitatively into pesticide use reported in the PUR database.
Scatter plot of sulfur use intensity related to FQPA priority I & II miticide use in Fresno, Madera, Napa and Sonoma county winegrapes in the year 2000, 2005 and 2009.

Scatter plot of sulfur use intensity related to FQPA priority I & II insecticide use in the Fresno, Madera, Napa and Sonoma county winegrapes in the year 2000, 2005 and 2009.

Future research on this phenomenon should continue to focus on various aspects of the relationships between sulfur and broad-spectrum insecticide use and mite outbreaks which have received only limited attention to date. In particular, the mechanisms involving host plant physiologyReference Costello12 or effects of sulfur (or other fungicides) on naturally occurring mite-pathogenic fungiReference Gerson, Gafni, Paz and Sztejnberg13 should be studied in greater detail. Data from the PUR database can be focused more narrowly than county-level totals and averages. A more detailed look at the sulfur use practices of individual combo sulfur users may reveal whether they used predominantly dust or wettable formulations. At the field level, combo users may have treated individual fields with only dust or wettable formulations.
The published correlations between sulfur use and subsequent mite outbreaks are largely based on laboratory and field studies, and often yield conflicting results, ranging from ‘no effect’Reference Stavrinides and Mills37 to ‘acute toxicity’Reference Beers, Martinez-Rocha, Talley and Dunley15 of sulfur on the same predatory mite species: G. occidentalis in these cases. Differences in application levels or formulations of sulfur used, species and life cycle stages studied, timing of exposure and lethality determination, and geographic differences in pest strains likely contribute to these varying experimental results. Here, we have used a novel approach to see if differences in sulfur formulations used by growers under true farming conditions translate into higher annual use of insecticides and miticides reported in the PUR database. The stark differences in sulfur use between the coastal and valley counties which were revealed by the PUR database also underscore the importance of farm economics in governing pesticide choices by growers. This factor should not be ignored when designing alternative pest management strategies. The PUR database has limitations in some aspects of understanding pest management, as it catalogs what the grower did, but not the actual pest conditions in the field. However, coupled with other data sources this resource provides valuable information for our understanding of pest management history and targeting outreach efforts. The PUR database also makes it possible to identify successful examples of reduced risk farm management practices and promote reduced risk pesticide use in winegrapes and other crops.
Acknowledgements
Authors want to thank US EPA Region 9 for the financial support (award nos. X-97930601 and PE-96958301) for this project. Authors also wish to thank Dr Cliff Ohmart, Dr Joseph Browde and Mr Mark Cady for earlier discussion and suggestions on this study. Authors greatly appreciate the comments and editorial efforts from the anonymous reviewers for their thorough review of this manuscript.