


1 Introduction
Conventional measures of responsiveness compare public opinion on a fixed set of preselected issues to downstream policy actions. While this method can illuminate whether the public is represented on salient policies that structure political divides, it constrains how representation can be observed by both obscuring preferences that are substantively important to respondents but omitted from standard survey instruments, and shifting attention away from upstream stages (drafting, committee and administrative review) where proposals are often shaped, delayed or terminated prior to any formal vote or adoption. Ideally, a measurement approach that gives meaningful consideration to citizens’ expressed priorities would extract concerns from each individual, link them to concrete proposals and evaluate whether, and how far, those concerns are incorporated into the agendas of formal institutions.
We develop a large language model (LLM)-driven retrieval-augmented survey framework that does exactly this. Respondents first state, in their own words, the single issue or policy change they care about most. They then complete a brief clarification step, selecting among concise paraphrases to confirm the scope and direction of that priority. Prior to fielding the survey, we assemble a policy database appropriate to the domain (e.g., legislative drafts, administrative rules, party platforms, municipal ordinances and budget line items) and standardize each entry into a short, neutral description suitable for survey administration. Our workflow then surfaces the top three most semantically similar policies for each respondent. For comparability to common survey practice, we benchmark retrieved items against two reference sets: a fixed battery of Cooperative Election Study (CES) policy items and an adaptive crowdsourced item bank (Velez Reference Velez2025), allowing us to assess perceived fit (whether items address the priority), support and short-term stability on a common scale.Footnote 1
To demonstrate how our work provides new perspectives on representation, we assess classic questions regarding the “second face of power” (Bachrach and Baratz Reference Bachrach and Baratz1962) by measuring the gap between citizens’ spontaneously expressed preferences and policies present in Congress. Inclusion records whether at least one retrieved policy directly and fully addresses a respondent’s stated priority (i.e., is a concrete policy analog for the respondent’s concern found in the corpus?). Progression then asks whether any policy candidate satisfying the respondent’s concern has advanced beyond a pre-specified and substantively meaningful procedural gate relevant to that domain (e.g., beyond committee in a legislature and beyond public comment in rulemaking). In a congressional application, for example, this distinction separates concerns that have plausible legislative analogs from those that stall at early gatekeeping stages. Together, these measures identify where the representation process for a particular citizen concern breaks down: through outright exclusion (no inclusion) or by stalling after introduction (included but not progressing).
We field our primary study using a national sample of U.S. adults from Verasight, supplemented by a two-wave CloudResearch Connect panel, and validate the approach on four dimensions. First, face validity: respondents rate retrieved items as mostly or fully addressing their concerns at high rates. Second, a hand-coding audit and cross-model checks of “policy satisfaction” suggest the procedure operates as intended. Third, stability: among respondents at maximum support for a retrieved item in Wave 1, roughly four-fifths remain at maximum three weeks later, versus roughly two-thirds for benchmark items. Fourth, choice relevance: in a tailored candidate-choice conjoint (Ryan and Ehlinger Reference Ryan and Ehlinger2023), alignment on a respondent’s retrieved policy yields larger effects than highly supported benchmark policies. Together, these exercises suggest that the approach captures durable, consequential preferences that traditional surveys would likely miss.
The workflow generalizes across contexts, from legislatures to rulemaking and municipal agendas, without changing the core steps. In this article, we illustrate the method using a congressional corpus; we compile recent bills from the 118th Congress, generate accessible summaries, embed the corpus and retrieve the most semantically similar items for each priority in our survey. We then measure support, perceived fit and stability for those items while coding whether any satisfying analog has moved beyond key procedural stages. However, this design does not depend on congressional data per se, and scholars could adapt our approach to studying mass-elite alignment on rules, platforms, ordinances, and budgets. Beyond improving the measurement of representation when niche and idiosyncratic preferences are involved, the workflow speaks to long-standing debates about how to study responsiveness upstream. Rather than inferring exclusion from the absence of final votes, the workflow makes comparing public preferences to earlier stages of the policymaking process more empirically tractable.
2 Measuring representation
Much of what we know from the representation literature rests on survey analyses that compare public opinion on salient issues to policy outcomes. While this approach is valuable for assessing alignment on widely discussed policies, it can produce a misleading impression of congruence if respondents agree on surveyed items yet diverge on omitted ones (Canes-Wrone Reference Canes-Wrone2015). A voter who supports the Affordable Care Act, for example, may ultimately view single-payer healthcare as their top priority; traditional batteries would count this voter as “well represented,” even if universal coverage never reaches the institutional agenda. As Wlezien (Reference Wlezien2017, 567) notes, while item-specific questions reveal whether citizens are represented on those items, “they do not allow us to see whether people are getting what they really want.”
Classic agenda-setting work distinguishes the public’s “systemic” agenda from the more formal and selective “institutional” or “decision” agendas (Cobb and Elder Reference Cobb and Elder1983; Kingdon Reference Kingdon1984), implying that studies of policy outcomes, by focusing on the tail end of the process, narrow the scope of how concerns move or are stymied through earlier stages. Thermostatic accounts likewise show that preferences and policy evolve jointly over time (Caughey and Warshaw Reference Caughey and Warshaw2022; Stimson, MacKuen, and Erikson Reference Stimson, MacKuen and Erikson1995; Wlezien Reference Wlezien2017), reinforcing the idea that responsiveness is a sequence of decisions, not a single vote.
The conversation around the “second face of power” initiated by Bachrach and Baratz (Reference Bachrach and Baratz1962) dovetails with this concern: influence is exercised not only through visible choices but also through what never comes up for deliberation or decision. As Schattschneider (Reference Schattschneider1960, 71) succinctly put it, “some issues are organized into politics while others are organized out.” Critiques grounded in a “hidden mass agenda” are compelling, but historically have been difficult to demonstrate. As Debnam (Reference Debnam1975) and Polsby (Reference Polsby1979) argued, claims about what Bachrach and Baratz (Reference Bachrach and Baratz1970) deemed “non-decisions” were methodologically unsound, and early efforts (e.g., Crenson Reference Crenson1971) relied on indirect inference that could not be cleanly validated. Even as Bachrach and Baratz acknowledged the measurement hurdles, they maintained the need for “more subtle and probing empirical research” (Lukes Reference Lukes2010, 93).
Recent work orients researchers in that direction but still conditions on agenda inclusion. Studies of majority-party control of calendars and committees show how proposals can be blocked after they are introduced (Anzia and Jackman Reference Anzia and Jackman2013), but this does not assess which issues fail to generate proposals in the first place. Text-as-data approaches connect committee deliberations to external discourse (e.g., Reddit) to study what topics enter discussion (Park et al. Reference Park, Irani, Esterling and Faloutsos2024), but those communities may reflect “issue publics” more than mass priorities (Elliott Reference Elliott2020). Aggregate tests of “representational success” using large survey databases (Ansolabehere and Kuriwaki Reference Ansolabehere and Kuriwaki2025) broaden coverage beyond a handful of items but remain dependent on what survey researchers chose to ask about and whether policies have advanced enough for inclusion.
We create a novel survey workflow that leverages LLMs, embedding models, and vector databases to capture the match (or mismatch) between policy preferences in the public and policy outcomes, such as agenda inclusion (i.e., whether a policy is present on the agenda) and agenda progression (i.e., whether a policy has advanced out of committee).Footnote 2 The method complements research on policy outcomes, allowing us to assess when prioritized policies are blocked or stall as they move through the legislative process. It provides diagnostics on whether satisfying analogs exist at all (inclusion) and whether they move beyond meaningful thresholds (progression).
3 Framework, estimation and identification
Our approach proceeds in four steps: (1) preparation of a domain corpus (e.g., policy database) with survey-style summaries for inclusion in a survey; (2) elicitation and clarification of respondent priorities; (3) retrieval of the semantically proximate “nearest neighbor” survey items for each respondent; and (4) collection of responses that support both estimation and validation. Such an approach requires translating open-ended preferences into concrete policies, budget allocations or other actionable agenda items.
While ideal-point methods can “bridge” survey responses to observed votes by placing them on a common latent scale, this approach presumes the relevant proposals exist and are observed; when a respondent’s preferred policy has no analog in the corpus, joint scaling is not feasible (Jessee Reference Jessee2016). Language offers an alternative bridge: respondent priorities and corpus items can be compared on their semantic content. For example, if a respondent endorses “building a government-run network of electric-vehicle charging stations” and the domain corpus contains no comparable proposal, this could indicate the kinds of policies that are systematically excluded from the official agenda.
3.1 Corpus preparation and standardized item-level survey questions
Before fielding a survey, one must assemble a reference corpus appropriate to the setting (e.g., legislative drafts, administrative notices, party platforms, municipal agenda items and budget lines). To ensure comparability at survey time, each corpus entry is represented by a short, neutral item summary. When official summaries exist, we abridge them with an LLM; when they do not, we use the LLM to generate short, neutral, plain-language summaries of the proposal’s main action from the underlying policy text (Pu, Gao, and Wan Reference Pu, Gao and Wan2023). This yields a library of relevant items that can be shown in a uniform format to respondents. Recent studies have found that LLMs excel at processing open-ended survey text (Mellon et al. Reference Mellon, Bailey, Scott, Breckwoldt, Miori and Schmedeman2024), and we find that human raters prefer LLM-generated summaries of policies included in the CES over human-generated summaries of the same policies (see Appendix H of the Supplementary Material).
3.2 Elicitation and clarification
Early in the survey, respondents identify, in their own words, a policy they care about most. To improve matching for terse or underspecified open-ended responses, we then administer a brief clarification step. The clarification presents several concise paraphrases that pin down scope and direction; respondents select the option that best captures what they meant. For example, a respondent who writes only “abortion” as their top policy priority is prompted to specify whether they want to expand access, restrict after a gestational limit or ban with or without exceptions. From the clarified priority, an LLM generates a one-sentence “tailored ideal” that directly reflects the respondent’s position; this is shown alongside the matched corpus items in the survey as a benchmark.Footnote 3 This allows us to assess how the retrieved items perform relative to an item generated to satisfy the participant’s policy concern.
3.3 Nearest neighbor retrieval
After respondents confirm their stance in the clarification module, we encode that stance and every entry in the domain corpus using a versioned, open-weight embedding model (Mixedbread’s mxbai-embed-large-v1). For each respondent, the system engages in a “matchmaking process,” retrieving the three most similar corpus items (nearest neighbors), ordered by cosine similarity.Footnote 4 These retrieved items are then displayed to the respondent as short descriptions for evaluation.
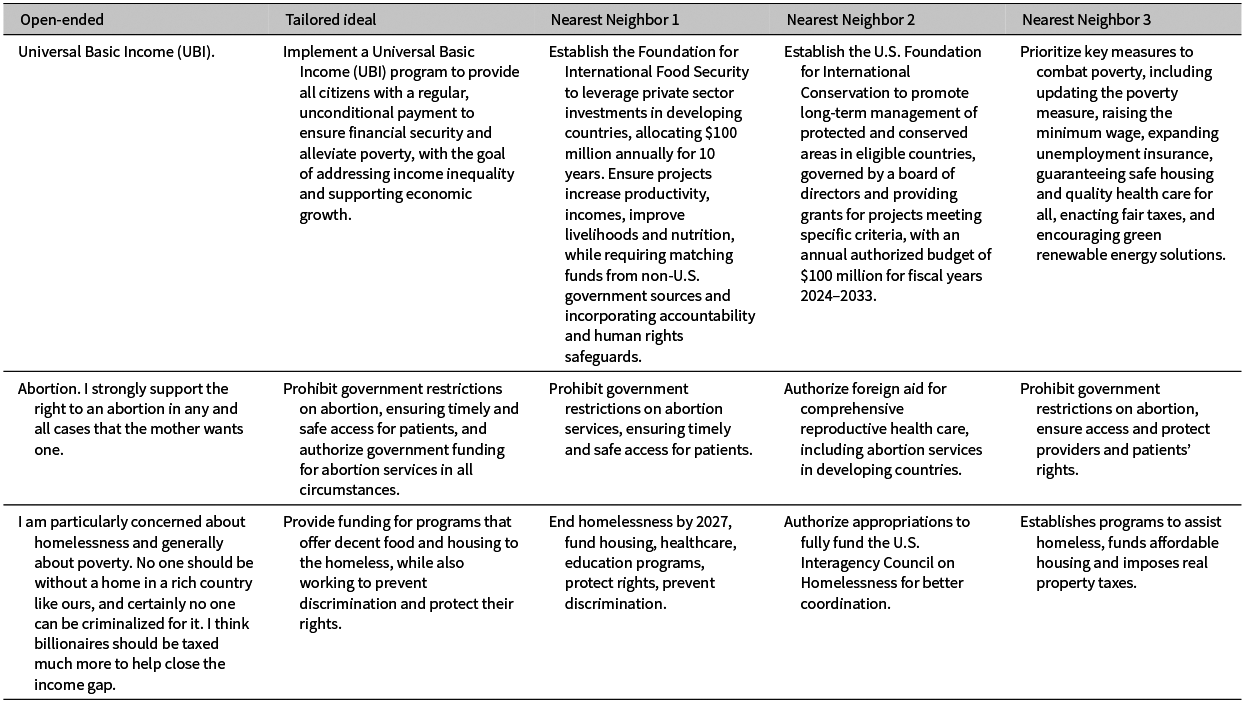
To illustrate, consider a respondent who, when asked about congressional policy, writes “I support nuclear power.” The three nearest neighbor bills in the 118th Congress are H. Res. 124, H.R. 2487 and H.R. 6544: a resolution to expand nuclear energy use to meet U.S. energy demands and promote leadership in the global nuclear marketplace, a bill mandating that the EPA recognize nuclear power as a green energy source in the Green Power Partnership, and a bill establishing a program within the Nuclear Regulatory Commission to streamline licensing and regulation for advanced nuclear technologies. From this set of semantically related policies, we can assess whether citizens’ priorities are reflected in existing legislation. In essence, our approach asks: “are there policies that address the respondent’s most deeply held concerns?” This reflects a “collective” dimension of representation where the institution is the scale at which representation is measured (Weissberg Reference Weissberg1978, 536–537). Additional illustrations appear in Table 1 and Appendix A of the Supplementary Material.
Examples of open-ended survey responses with corresponding AI-generated tailored ideal issues and top three retrieved nearest neighbor policies from congressional bills

Table 1 Long description
The table consists of five columns: Open-ended, Tailored ideal, Nearest Neighbor 1, Nearest Neighbor 2, and Nearest Neighbor 3. It contains three rows of data.
Row 1:
- Open-ended: Universal Basic Income (U B I).
- Tailored ideal: Implement a U B I program to provide all citizens with a regular, unconditional payment to ensure financial security and alleviate poverty.
- Nearest Neighbor 1: Establish the Foundation for International Food Security to leverage private sector investments.
- Nearest Neighbor 2: Establish the U.S. Foundation for International Conservation to promote long-term management of protected areas.
- Nearest Neighbor 3: Prioritize key measures to combat poverty, including updating the poverty measure and raising the minimum wage.
Row 2:
- Open-ended: Abortion. I strongly support the right to an abortion in any and all cases that the mother wants one.
- Tailored ideal: Prohibit government restrictions on abortion, ensuring timely and safe access for patients.
- Nearest Neighbor 1: Prohibit government restrictions on abortion services, ensuring timely and safe access for patients.
- Nearest Neighbor 2: Authorize foreign aid for comprehensive reproductive health care, including abortion services in developing countries.
- Nearest Neighbor 3: Prohibit government restrictions on abortion, ensure access and protect providers and patients rights.
Row 3:
- Open-ended: I am particularly concerned about homelessness and generally about poverty. Billionaires should be taxed much more to help close the income gap.
- Tailored ideal: Provide funding for programs that offer decent food and housing to the homeless, while also working to prevent discrimination.
- Nearest Neighbor 1: End homelessness by 2027, fund housing, healthcare, education programs, protect rights, prevent discrimination.
- Nearest Neighbor 2: Authorize appropriations to fully fund the U.S. Interagency Council on Homelessness for better coordination.
- Nearest Neighbor 3: Establishes programs to assist homeless, funds affordable housing and imposes real property taxes.
Though embedding models allow us to match priorities and proposed bills, handing over control to a fully automated process has several limitations. While embeddings can perform well in recovering texts with similar semantic content, they struggle with negations, such that “not supporting healthcare” and “supporting healthcare” may be close in semantic space despite signaling different stances. Though larger embedding models trained to distinguish negative pairs minimize this risk (as with our preferred model), validation is necessary to ensure that nearest neighbor policies generally match participant stances. Furthermore, instead of asserting that a policy is relevant to a participant or assuming that a certain level of similarity is sufficient, we can directly ask participants how much they support the nearest neighbor policies and agree that such policies address their concerns. To make these validation steps feasible, the retrieved items are shown using the one-sentence summaries prepared in the corpus step, so respondents can assess them quickly and on equal footing.
3.4 Inclusion and progression
3.4.1 Inclusion
To illustrate our approach, we apply our workflow to a classic question about the “second face of power”: whether citizen priorities are absent from the institutional agenda altogether or instead are present but fail to advance past early procedural gates. Given that our method retrieves survey questions for semantically similar policies and one can assess whether such policies align with participants’ expressed preferences, we can use our approach to estimate agenda inclusion and progression. Such estimates are generally conservative, given that we surface three bills and more bills would increase the likelihood of a match. We summarize this alignment using two indicators.
Inclusion records whether at least one retrieved candidate directly and fully addresses the clarified priority. This is a simple yes/no measure of whether the person’s concern has a concrete analog in the corpus. Formally,

where
$P_i$
 is the set of nearest neighbor retrieved policies for participant i, and
$S(p,i)$
 is an indicator function which returns
$1$
 if policy p satisfies participant i’s concern, and
$0$
 otherwise. We define satisfaction as directly and fully addressing the participant’s concern. For instance, a policy like “expanding eligibility for Medicare” would not be considered sufficient to satisfy a participant whose prioritized issue is to “establish a universal healthcare system,” because the core concern of universality is unmet.
3.4.2 Progression
Progression evaluates whether any satisfactory policy has advanced beyond a pre-specified point in the relevant process. The threshold is domain-specific and is defined ex-ante (e.g., beyond committee in a legislature; beyond public comment in rulemaking; beyond being placed on agenda in municipal governance). Equation (2) formalizes our coding procedure:

where
$P_i$
 is the set of nearest neighbor policies retrieved for participant i,
$P_i^{inc}=\{p\in P_i: S(p,i)=1\}$
 is the subset labeled as satisfying the participant’s clarified priority,
$\mathrm {Stage}(p)$
 is the furthest institutional step reached by policy p and
$\tau $
 is a pre-specified threshold. Agenda progression is zero for respondents with no satisfying policy.
This framework rests on three transparent assumptions. First, the retrieval step is adequate in the sense that, when a true analog exists in the corpus, at least one of the top candidates is likely to capture it after clarification and standardized summarization. This is an empirical claim that we probe using perceived-fit evaluations and cross-model checks of retrieval quality (Appendix L of the Supplementary Material). Second, inclusion is strict and applied consistently: positive labels are reserved for candidates that directly and fully address the clarified priority. Third, the process stages used for progression are properly ordered for the domain at hand and the threshold marks a substantively meaningful gate in the process. Figure 1 clarifies the survey process.
Flowchart of adaptive survey process.

Figure 1. Long description
The process begins on the far left with a box labeled Participant submits open-ended response. An arrow points right to a green box labeled Response embedded in vector space. From here, the path splits into two parallel branches.
The top branch leads to Generate personalized policy. This box has arrows pointing to Measure support and Add to adaptive question bank if unique.
The bottom branch leads to Retrieve three nearest neighbor policies and summaries. This box also has arrows pointing to Measure support and Add to adaptive question bank if unique.
Above the convergence point, two independent boxes, Obtain adaptive questions and Obtain C E S questions, both point arrows down toward Measure support.
The Measure support box receives inputs from all four previous stages. Finally, an arrow points from Measure support to the terminal box on the far right labeled Update probabilities of adaptive question bank.
In the next section, we begin by evaluating the retrieval-and-labeling pipeline empirically using four validation checks: (i) do the matches look right to respondents (face validity)? (ii) do the matches hold up under a hand-coding audit? (iii) do attitudes toward matched items persist in a re-interview wave (stability)? and (iv) do the matched items influence choices (choice relevance in a tailored conjoint)? We then use the validated pipeline to estimate aggregate rates of agenda inclusion and progression in Congress via a national Verasight study, showing that most respondents have a clear legislative analog for their top priority, but that relatively few of those satisfactory proposals advance past early procedural gates.
4 Validation and performance
4.1 Study design and procedure
This section evaluates the retrieval-and-labeling pipeline using respondent ratings, expert audits, and panel evidence, with a congressional application serving as an end-to-end illustration. We begin by fielding our primary validation study using a national sample of 2,000 U.S. adults recruited by Verasight (October 11–21, 2024). Verasight recruits participants using a mix of methods, including address-based sampling and online recruitment, and we use Verasight-provided survey weights to align the sample with national benchmarks on key demographics, partisanship, and past vote choice. The sample composition can be found in Appendix D of the Supplementary Material.
After providing consent, participants were asked to write about an issue that is important to them (see Appendix B of the Supplementary Material). This response was passed to an API that (1) generated a one-sentence, respondent-specific tailored ideal policy statement reflecting the participant’s stated priority, (2) retrieved three nearest neighbor bills most related to the participant’s issue position, (3) provided 14 roll-call questions that were slated to be included in the 2024 CES (see Appendix C of the Supplementary Material), and (4) provided a random set of three dynamic crowdsourced adaptive survey (CSAS) items (Velez Reference Velez2025).Footnote 5 Notably, participants failed to volunteer an issue in the open-ended question in 15% of cases. The inability to articulate a specific policy priority may itself be politically meaningful, reflecting forms of alienation that the literature on the “third face of power” identifies as obstacles to political voice (Lukes Reference Lukes2021), and it renders agenda representation difficult to assess for these participants. Our analyses therefore condition on the subset who offer an issue position. As shown in Appendix E of the Supplementary Material, respondents who do not state an issue tilt lower-income and less-educated, are more likely to identify as Latino, and are substantially less likely to report past or intended turnout.Footnote 6 Reassuringly, partisanship does not predict failing to state an issue, suggesting that the exclusion does not introduce partisan bias into our analytic sample. Our aggregate rates are also robust to alternative rules for coding these respondents. Even when those who fail to disclose an issue position are coded as having no represented policy, machine-coded inclusion remains a majority (63%) and progression is essentially unchanged (10%), as these respondents make up 18% of the weighted sample. Treating the issue they select in a follow-up probe as their primary concern yields rates nearly identical to our headline estimates.Footnote 7
4.2 Validation 1: Face validity
We first check whether retrieved policies reflect participants’ stated concerns. Our survey design allows for a direct validation by comparing our coded measure of agenda inclusion against participants’ own subjective assessments. Participants rated the extent to which each of the three nearest neighbor policies addressed their stated concern on a five-point Likert scale.
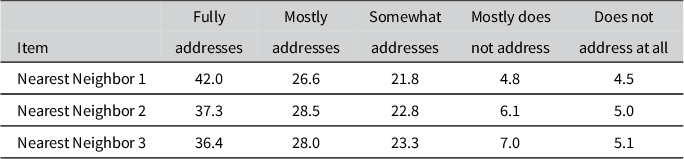
The results, presented in Table 2, reveal a high degree of perceived relevance. For the policy most semantically similar to the participant’s stated concern (Nearest Neighbor 1), a striking 69% reported that it “mostly” or “fully addresses” the issue, with 91% of nonmissing Nearest Neighbor 1 raters indicating it at least “somewhat addresses” it. This pattern largely persists for the second and third nearest neighbors, where approximately two-thirds of participants perceived the policies as mostly or fully addressing their concerns (66% and 64%, respectively). Aggregating across the three retrieved items, 81% of participants rated at least one as “mostly” or “fully” addressing their concern, and a majority (51%) identified at least one that “fully addressed” it. These evaluations corroborate our LLM-generated measure of agenda inclusion. Furthermore, because automated retrieval can occasionally miss relevant items, our estimates are likely downward-biased and therefore conservative.
Perceptions by item and response category (weighted %)

Table 2 Long description
The table consists of six columns and four rows including the header. The columns are labeled: Item, Fully addresses, Mostly addresses, Somewhat addresses, Mostly does not address, and Does not address at all. All numerical values represent weighted percentages.
* Nearest Neighbor 1: Fully addresses 42.0, Mostly addresses 26.6, Somewhat addresses 21.8, Mostly does not address 4.8, Does not address at all 4.5.
* Nearest Neighbor 2: Fully addresses 37.3, Mostly addresses 28.5, Somewhat addresses 22.8, Mostly does not address 6.1, Does not address at all 5.0.
* Nearest Neighbor 3: Fully addresses 36.4, Mostly addresses 28.0, Somewhat addresses 23.3, Mostly does not address 7.0, Does not address at all 5.1.
Note: Cell entries represent percentages.
We can also assess this correspondence at the respondent level. Participants’ assessments and an LLM coding agree in 72% of cases on whether at least one retrieved policy “mostly” or “fully” addresses the stated concern. An examination of disagreements (Appendix I of the Supplementary Material) suggests that they reflect the measures’ differing standards rather than classification error: the LLM appears to be calibrated to participants’ “mostly addresses” threshold rather than their stricter threshold for “fully addresses,” reflecting a stricter standard for the former and looser standard for the latter. Disagreements thus hinge on how much satisfaction a policy is perceived to deliver, not on whether a relevant policy was retrieved.
4.3 Validation 2: Hand-coding audit
We next conduct a hand-coding audit of the satisfaction labels that underlie inclusion and progression. While respondent “fit” ratings tell us whether the matches look right to the person who wrote the priority, we also hand-code a stratified subset using a common set of coding rules to assess labeling error, since individual respondents may interpret items differently, skim or use looser standards.
To clarify our coding procedure, we use examples from two participants. In one case, a respondent expressed skepticism toward vaccines, especially those given to newborns. Yet the closest retrieved bill addressed immunization mandates for college students, leaving the newborn-specific concern unmatched; accordingly, the issue is coded absent (0). Another respondent began with the catch-all “the economy,” refined it to “curb inflation,” and was linked to three bills explicitly targeting price stability and rising consumer prices. Because the retrieved policies align substantively with the stated priority, this issue is coded present (1). Together, the vignettes illustrate how our nearest neighbor retrieval distinguishes genuine agenda representation from merely proximate language.
When measuring agenda progression, we focus on the policies marked as satisfying the participant’s concerns and estimate their stage in the legislative process using data on the latest action, as provided by Congress.gov.Footnote 8 For the second participant, the satisfying bills (H.R. 6117 and H.R. 252) remained at initial submission or in committee referral; because neither reached the floor, agenda progression is coded 0.
We machine-code all issue-stance/nearest neighbor pairings in the sample (6,000 policies; three per participant) using Meta’s Llama 4 Scout, a 109-billion parameter “open weights” LLM. The model is instructed to classify whether a participant’s concern is “satisfied” by the retrieved policy, and we validate its classifications against independent hand-coding by both authors. Across the 213 pooled hand-coded cases (71 participants, each contributing three nearest neighbor judgments), the LLM agrees with the human coders 83.6% of the time.Footnote 9 As shown in Appendix N of the Supplementary Material, the disagreements are largely unsystematic, with one mild asymmetry: when the coders differ, the LLM is somewhat more likely than the human to classify a policy as satisfying a concern, a tendency not statistically distinguishable from chance. To correct for this one-directional error, we implement design-based supervised learning (DSL) using one author’s 150-case hand-coded set as the gold-standard benchmark, ensuring valid estimates even when LLM annotations contain systematic prediction errors (Egami et al. Reference Egami, Hinck, Stewart and Wei2023). In Appendix F of the Supplementary Material, we assess the robustness of our key findings to the use of different LLMs, finding general agreement across both open weights and proprietary models (e.g., OpenAI’s GPT-4.1 Mini, Meta’s Llama 3.1 405B Instruct and DeepSeek’s V3); the model-comparison agreement reported there uses this same 150-case benchmark.
4.4 Validation 3–4: Panel studies
Given the one-shot nature of the cross-sectional studies, participants may rate retrieved items highly simply because they align with concerns expressed in an earlier open-ended question, reflecting transient rather than deeply held views. We therefore fielded a panel study to assess the stability of these policy stances and, using hypothetical voting scenarios, the weight participants place on them relative to high-salience policies.
For this study, we collected data from a quota-based sample of 1,116 U.S. adults on CloudResearch Connect from June 4, 2024 to June 7, 2024. We then re-interviewed these participants in a subsequent wave conducted from June 24, 2024 to June 29, 2024 (
$N = 867$
 ). In the first wave, we measured support and directly asked participants whether tailored and retrieved policies satisfied their concerns. We also leveraged the multi-wave design to assess stability of their issue positions over time. Additionally, we used “tailored conjoints” to assess how participants navigated potential trade-offs between issue positions, partisanship and demographic characteristics when voting for hypothetical candidates.
4.4.1 Assessing attitude stability
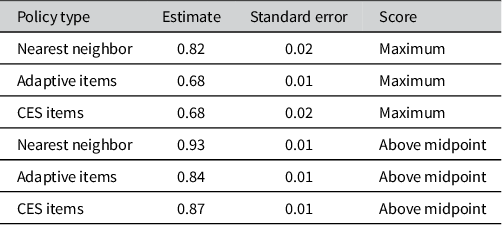
Table 3 contains estimates of attitude stability across waves, revealing substantial variation across different policy question types. Among respondents who initially expressed the strongest attitudes (i.e., those scoring at the maximum value of the policy support scale in Wave 1) and completed Wave 2, 82% continued to rate the nearest neighbor bills at the maximum, compared to 68% each for CES and adaptive items. Expanding our focus to respondents scoring above the midpoint in Wave 1, we found that the probability of maintaining this level of support in Wave 2 was 93% for the nearest neighbor policies, 84% for adaptive policies and 87% for CES items. The high degree of attitude stability observed for nearest neighbor policies, particularly in comparison to established measures like CES items, suggests that opinions toward these retrieved policies reflect enduring preferences over the re-interview window.
Stability of scores across waves for policy types at maximum and above midpoint scores

Table 3 Long description
The table consists of four columns: Policy type, Estimate, Standard error, and Score.
For the Maximum score level:
* Nearest neighbor has an estimate of 0.82 and a standard error of 0.02.
* Adaptive items has an estimate of 0.68 and a standard error of 0.01.
* C E S items has an estimate of 0.68 and a standard error of 0.02.
For the Above midpoint score level:
* Nearest neighbor has an estimate of 0.93 and a standard error of 0.01.
* Adaptive items has an estimate of 0.84 and a standard error of 0.01.
* C E S items has an estimate of 0.87 and a standard error of 0.01.
4.4.2 Assessing choice relevance
Since stability alone does not establish personal importance, in our second wave, we employed a tailored candidate-choice conjoint design to assess how voters make decisions when evaluating candidates who stake out a position on their nearest neighbor policy, while also considering potential cross-pressures from other issues or candidate attributes such as partisanship. This design has been used in recent work on issue publics (Ryan and Ehlinger Reference Ryan and Ehlinger2023) and the measurement of issue attitudes (Velez and Liu Reference Velez and Liu2025).
Participants were presented with 10 pairs of hypothetical congressional candidates and asked to indicate their preference (see Figure 2 for an example). Candidate attributes were randomly assigned across several dimensions: partisanship (Democrat and Republican), sex (Man and Woman), race/ethnicity (Black/African American, Asian American, Hispanic/Latino and White) and policy positions. Policy positions included the nearest neighbor policy identified in Wave 1, four CES policies, and three adaptive policies.Footnote
10
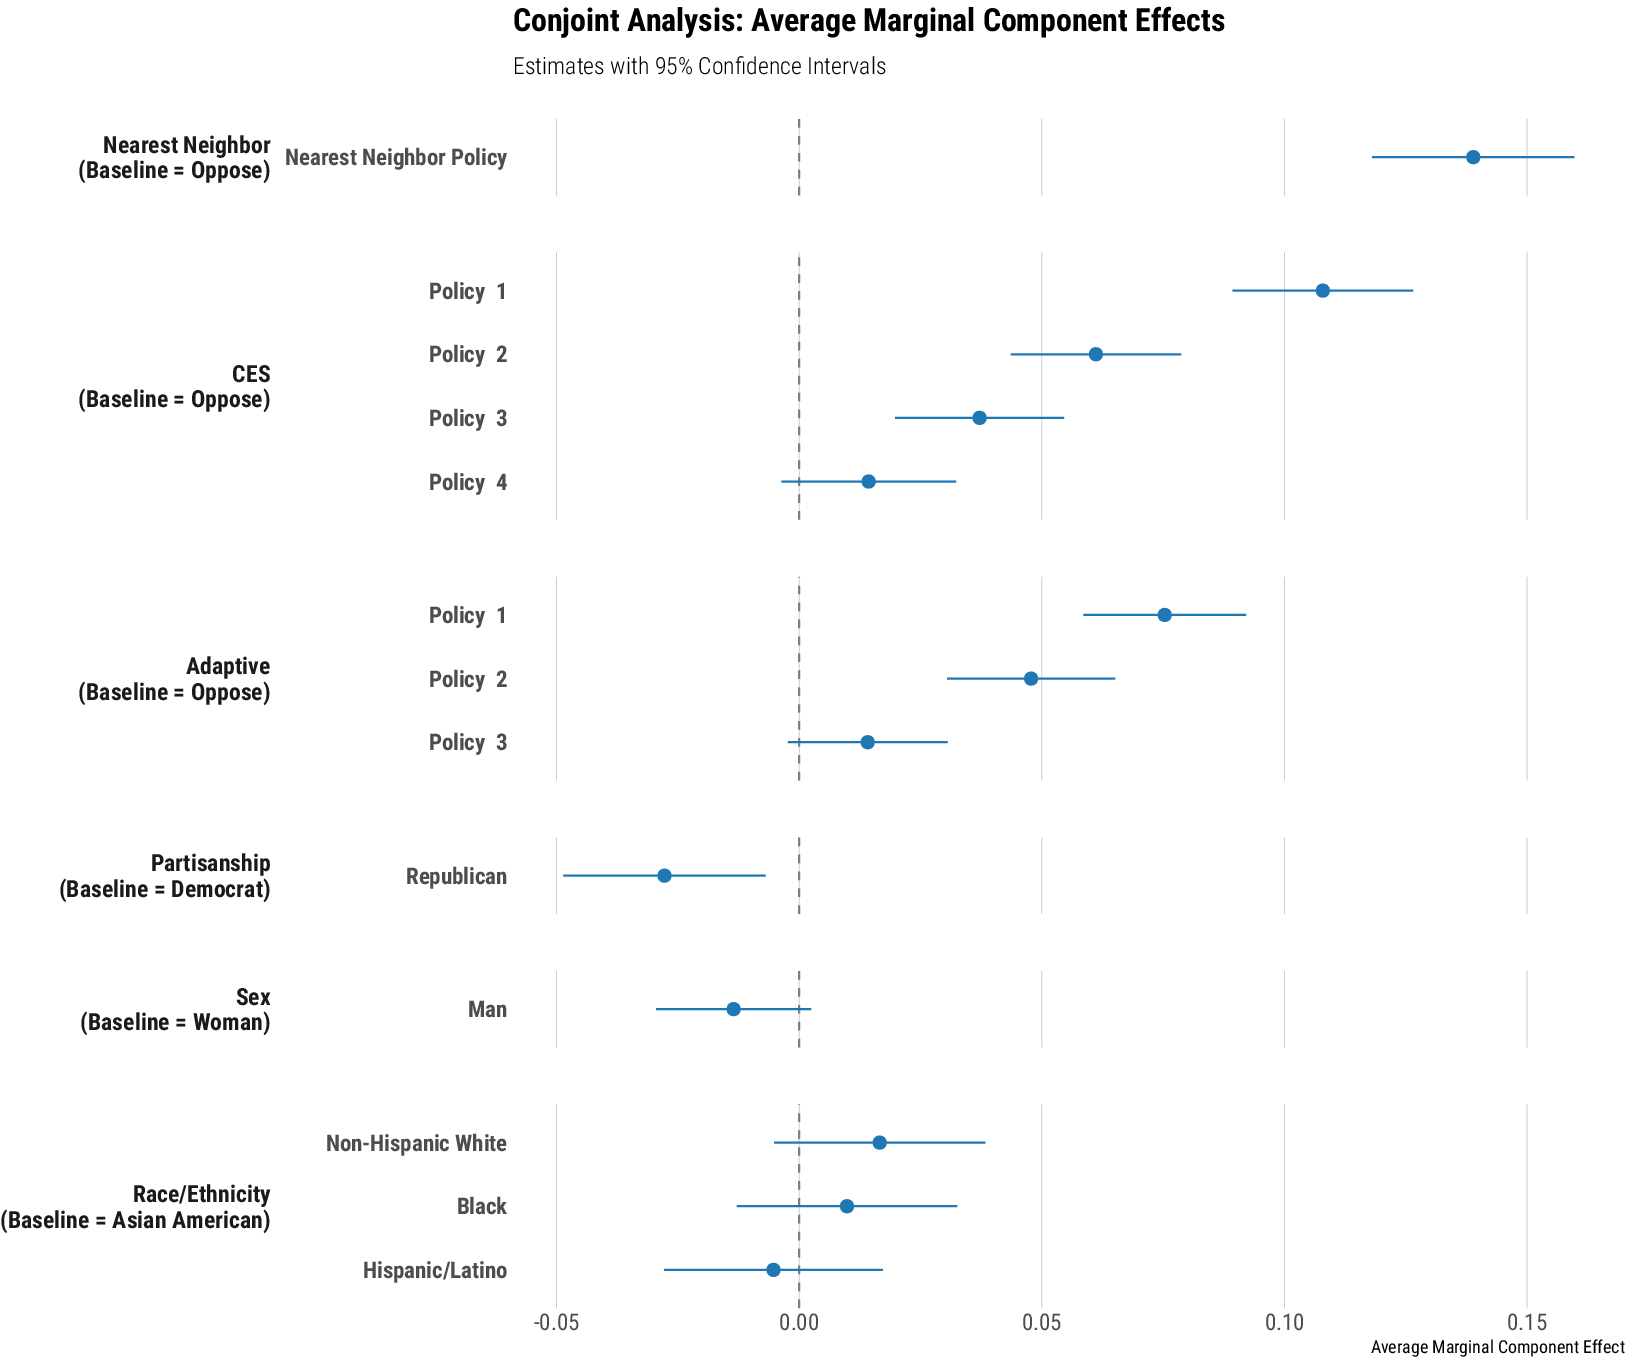
The order of these features was randomized across participants. This design allows for the estimation of average marginal component effects (AMCEs) for each attribute, revealing the effect of different factors in candidate evaluation (Hainmueller, Hopkins, and Yamamoto Reference Hainmueller, Hopkins and Yamamoto2014). Figure 3 presents the AMCEs for each attribute. AMCEs are estimated such that, for the CES and adaptive items, items are ordered in terms of baseline attitude strength. Thus, “CES 1” corresponds to the highest rated CES item in the baseline survey, “CES 2” to the second highest and so on.Footnote
11
The largest observed AMCE emerges for the nearest neighbor policy, with other high-salience policies also possessing significant AMCEs. Moreover, the gap between the AMCE for the nearest neighbor and the highest-rated CES policy is 3 percentage points (
$p = 0.03$
 ) and 6 percentage points for the highest-rated adaptively selected policy (
$p < 0.001$
 ). The nearest neighbor policy thus not only exhibits high attitude stability but also produces sizable choice-based effects.Footnote
12
Example tailored conjoint task. The participant’s nearest neighbor policy concerned homelessness assistance. Attributes vary randomly.

Figure 2. Long description
The table consists of three columns: Feature, Candidate A, and Candidate B.
* Policy: Penalize corrupt politicians. Candidate A: Support. Candidate B: Support.
* Policy: Assist homeless and housing-unstable individuals. Candidate A: Support. Candidate B: Support.
* Policy: Support E V charging in underserved areas. Candidate A: Support. Candidate B: Oppose.
* Partisanship. Candidate A: Democrat. Candidate B: Democrat.
* Policy: Remove President Trump from office. Candidate A: Support. Candidate B: Support.
* Policy: Require explicit consent for data collection. Candidate A: Oppose. Candidate B: Oppose.
* Policy: Raise minimum wage to $15/hour. Candidate A: Support. Candidate B: Oppose.
* Race/Ethnicity. Candidate A: Non-Hispanic White. Candidate B: Non-Hispanic White.
* Sex. Candidate A: Male. Candidate B: Female.
* Policy: Universal pre-K and green economy shift. Candidate A: Oppose. Candidate B: Support.
* Policy: Protect L G B T Q plus from discrimination. Candidate A: Oppose. Candidate B: Oppose.
The final row is labeled Preference, with two blue buttons at the bottom labeled A and B respectively.
Average marginal component effects (AMCEs) from conjoint analysis. Bars represent 95% confidence intervals.

Figure 3. Long description
The X-axis represents the Average Marginal Component Effect ranging from minus 0.05 to 0.15 with a dashed vertical baseline at 0.00. Data points are shown as dots with horizontal error bars representing 95 percent confidence intervals.
* Nearest Neighbor (Baseline equals Oppose): Nearest Neighbor Policy shows a positive AMCE at approximately 0.14.
* C E S (Baseline equals Oppose): Policy 1 is at 0.11, Policy 2 at 0.06, Policy 3 at 0.04, and Policy 4 is near 0.01 for respective AMCEs.
* Adaptive (Baseline equals Oppose): Policy 1 is at 0.08, Policy 2 at 0.05, and Policy 3 is near 0.01 for respective AMCEs.
* Partisanship (Baseline equals Democrat): Republican shows a negative AMCE at approximately minus 0.03.
* Sex (Baseline equals Woman): The AMCE for a Male candidate shows a slight negative AMCE at approximately minus 0.01.
* Race/Ethnicity (Baseline equals Asian American): The AMCE for Non-Hispanic White is at 0.02, Black is at 0.01, and Hispanic/Latino is slightly below 0.00.
4.5 Performance in the congressional application
We now summarize aggregate legislative inclusion and progression based on bills from the 118th Congress. In the Verasight sample, 77% of respondents who volunteer an issue stance have at least one retrieved nearest neighbor bill that our coding procedure classifies as satisfying their clarified priority (agenda inclusion). By contrast, only 12% have at least one satisfying bill that reaches floor action or beyond (agenda progression).Footnote 13 This pattern suggests that, for many respondents, the relevant barrier is not the absence of a plausible analog in the legislative agenda, but the difficulty of moving those proposals through early procedural gates.Footnote 14
Consistent with this interpretation, the maximum observed stage of satisfactory nearest neighbor bills is heavily concentrated in committee. For example, among satisfactory matches, 84% stall after being referred to committee, while less than 1% ultimately become law. This highlights that outright agenda exclusion is rare, with the key institutional gates arising at the committee stage after introduction. This pattern is consistent with a view of power that operates through agenda management and procedural discretion (Cox and McCubbins Reference Cox and McCubbins2005), enabling gatekeepers to shape the agenda so that some demands never become consequential, even if they are formally present in the system.
These aggregate findings suggest a more optimistic view of representation in Congress than outright-exclusion accounts of the second face of power might predict. The aggregate picture, however, does not tell the full story, as it may conceal disparities in whose concerns advance.
4.5.1 Disparities in inclusion and progression
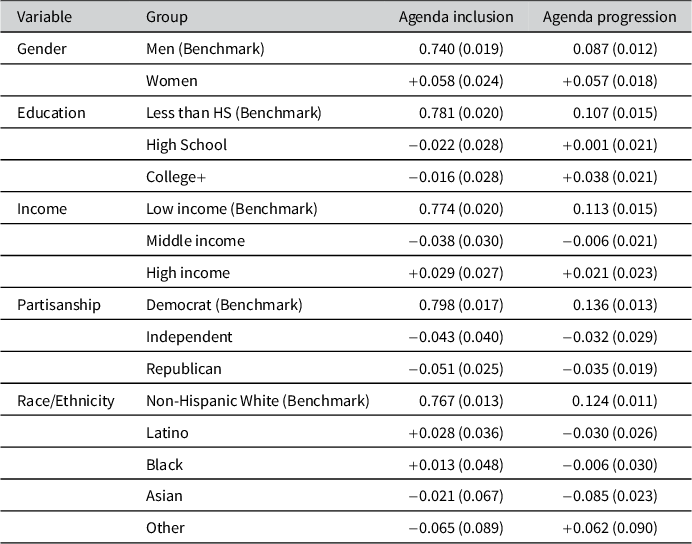
Long-standing concerns about inequalities in political representation (Gilens Reference Gilens2009; Griffin Reference Griffin2014; Mansbridge Reference Mansbridge1999) motivate examining how inclusion and progression vary across demographic and political subgroups. Because this analysis is exploratory and descriptive, we estimate separate survey-weighted linear probability models of agenda inclusion and progression for each subgroup variable, with HC2 heteroskedasticity-robust standard errors. Both outcomes are based on the machine classifications, so these estimates are uncorrected for classification error. Gender is entered as a binary indicator, while education, income, partisanship and race/ethnicity are entered as categorical factors. Race/ethnicity is coded as a mutually exclusive five-level factor with non-Hispanic White as the benchmark. Latino identification takes precedence; among non-Latino respondents, categories are then assigned, in order, to non-Hispanic White, Black, Asian or Other.
We present the resulting subgroup estimates in Table 4. Women have estimated inclusion and progression rates 0.058 (SE 0.024) and 0.057 (SE 0.018) higher than men, respectively. Relative to Democrats, Republicans have estimated inclusion and progression rates that are 0.051 (SE = 0.025) and 0.035 (SE = 0.019) lower. Relative to the non-Hispanic White benchmark, the estimated inclusion differences are +0.028 (SE 0.036) for Latino participants, +0.013 (SE 0.048) for Black participants,
$-$
 0.021 (SE 0.067) for Asian participants and
$-$
 0.065 (SE 0.089) for participants in the Other category. The corresponding progression differences are
$-$
 0.030 (SE 0.026),
$-$
 0.006 (SE 0.030),
$-$
 0.085 (SE 0.023) and +0.062 (SE 0.090).
Subgroup differences on representation outcomes.

Table 4 Long description
A single horizontal line representing a minus sign or negative operator. In the context of the provided table, it indicates a negative difference or value relative to a benchmark group.
Note: Estimates are shown with HC2 heteroskedasticity-robust standard errors in parentheses. Benchmark rows are absolute weighted rates; other rows are weighted differences from the benchmark. Both outcomes use uncorrected estimates from separate linear probability models of the machine-coded outcomes, using the Verasight survey weights.
Issue composition may help generate hypotheses about these patterns. For example, 28% of women, versus 8% of men, volunteered abortion or reproductive rights as their top concern during a period of substantial post-Dobbs legislative activity, a pattern consistent with the possibility of short-term reactive responsiveness following the Supreme Court decision. We use these analyses to illustrate how our pipeline can enable analyses of representation gaps, but encourage future studies to recruit larger subgroup samples to improve precision and assess whether these descriptive patterns replicate across contexts.
5 Discussion
This design provides a survey framework for linking open-ended priorities to concrete proposals in a policy corpus, evaluating respondent-specific nearest neighbor items using standard survey questions rather than conditioning on a fixed battery of issues. The result is a modular approach for connecting what citizens say they care about most to the proposals institutions actually consider. In practical terms, the workflow can be paired with domain-specific institutional stages to study when these priorities are reflected in formal agendas and where they stall. As documented in the article, some respondents fail to report an issue, which renders the measurement of policy representation inherently challenging. Future research could apply cognitive interviewing techniques to assess why people fail to report an issue priority.
Beyond the embedding-based retrieval we implement here, agentic retrieval architectures can handle complex sequences of retrieval operations across sources and tools, potentially improving retrieval quality at the cost of greater latency, weaker auditability, and additional stochasticity in outputs. In Appendix K of the Supplementary Material, we develop and evaluate such a workflow, finding modest but consistent retrieval gains alongside latency costs that currently favor the simpler nearest neighbor approach in survey settings, where delays could induce attrition.
For applied work, the framework supports several immediate extensions. In legislatures, one can construct dyadic representation measures by comparing constituents’ mapped priorities to a member’s sponsored or cosponsored items (and their procedural status), decompose where matched items stall in the pipeline (e.g., committee vs. floor) and study responses to shocks (e.g., whether exogenous events mechanically raise inclusion/progression in affected domains). It also accommodates general and partisan responsiveness: aggregate inclusion/progression can be compared to the overall agenda and patterns of advancement across procedural stages, and contrasted across parties to assess differences in attention, advancement, and cosponsorship. Finally, future work could use retrieved policies as interventions, making participants aware of relevant policies and assessing if this has downstream effects on perceptions of representation.
The same logic extends beyond Congress by swapping out the corpus and domain-specific classifications of meaningful progress: in rulemaking, inclusion asks whether any proposed rule directly addresses the priority and progression whether a matching rule moves past public comment; in municipal contexts, inclusion focuses on agenda placement and progression measures hearings or votes; in budgets, inclusion is the appearance of a matching line item and progression is survival to enactment; and for party platforms or manifestos, inclusion is a matching plank and progression is appearance in a coalition or governing policy program. These designs could use the same elicitation, retrieval and satisfaction coding, enabling cumulative tests of when and why respondent-defined concerns enter institutions, how far they advance—and holding institutions empirically accountable for both.
Data availability statement
Replication code and data for this article are published in the Political Analysis Harvard Dataverse at https://doi.org/10.7910/DVN/V5TUYQ (Velez and Ewig Reference Velez and Ewig2026).
Competing interests
The authors have no competing interests to disclose.
AI disclosure
This study uses large language models and embedding models as core components of the survey research workflow. Specifically, we used the following tools: (1) Anthropic’s Claude Instant 1.2 and Claude Haiku 3.0 (accessed via the Anthropic API) for congressional bill summarization; (2) Meta’s Llama 3.0 70B-Instruct, Llama 3.1 405B-Instruct, Llama 3.3 70B-Instruct and Llama 4 Scout (accessed via OpenRouter) for generating tailored ideal issues, issue clarification options, CES-style survey question transformations, conjoint abbreviations and policy satisfaction classification; (3) OpenAI’s GPT-3.5 Turbo (accessed via the OpenAI API) for CES-style transformations and tailored ideal generation in the pilot study; (4) Mixedbread’s mxbai-embed-large-v1 (accessed via the Mixedbread API) for text embedding; and (5) Pinecone for vector database hosting and nearest neighbor retrieval. The policy corpus consists of bills from the 118th U.S. Congress, with legislative data drawn from Congress.gov; benchmark survey items were drawn from the Cooperative Election Study (CES). These tools were used during survey fielding across three studies: a CloudResearch cross-section pilot study (April 19–22, 2024), a CloudResearch panel (June 4–29, 2024) and a Verasight cross-section (October 11–21, 2024). All models were accessed through their standard public APIs without fine-tuning or modification. No proprietary data or information was used. Full prompts, temperature settings and model specifications are documented in Appendix G of the Supplementary Material. Anthropic’s Claude Fable 5 was used to review the manuscript for typographical and estimation errors, with minor edits to prose for clarity. Initial drafts of Appendices K–M of the Supplementary Material were prepared with assistance from Anthropic’s Claude Opus 4.8 and subsequently reviewed by the authors for accuracy. Robustness checks leveraged additional models: GPT-4.1 Mini and DeepSeek V3.
Supplementary material
The supplementary material for this article can be found at https://doi.org/10.1017/pan.2026.10064.




 Open access

