INTRODUCTION
Parkinson’s disease (PD) is a neurodegenerative disorder that causes significant alteration to frontal-basal ganglia circuitry and disrupts a range of executive cognitive control and motivational processes. A particularly vulnerable class of deficits involve reductions in inhibitory control mechanisms that are essential for timely action restraint (e.g., Go/No-Go tasks; Cooper, Sagar, Tidswell, & Jordan, Reference Cooper, Sagar, Tidswell and Jordan1994), stopping actions abruptly (e.g., Stop-Signal tasks; Bissett & Logan, Reference Bissett and Logan2011; Gauggel, Rieger, & Feghoff, Reference Gauggel, Rieger and Feghoff2004; Obeso et al., Reference Obeso, Wilkinson and Jahanshahi2011), and suppressing impulsive and erroneous actions in times of motor conflict (e.g., Flanker and Simon tasks; Wylie, Ridderinkhof, Ellias, et al., Reference Wylie, Ridderinkhof, Elias, Frysinger, Bashore, Downs and van den Wildenberg2010; Wylie et al., Reference Wylie, van den Wildenberg, Ridderinkhof, Bashore, Powell, Manning and Wooten2009b; Praamstra & Plat, Reference Praamstra and Plat2001). The current investigation focuses on the latter form of inhibitory control, which is critical for resolving motor system conflicts that are exposed when stimulus events trigger inappropriate motor impulses that interfere with desired actions.
In times of motor system conflict, studies of PD reveal increased susceptibility to rapidly acting on strong motor impulses in error (i.e., stronger impulse capture) as well as greater difficulties suppressing the interference from these impulses (i.e., poorer response inhibition; Wylie, Ridderinkhof, Bashore, & van den Wildenberg, Reference Wylie, Ridderinkhof, Bashore and van den Wildenberg2010), which consequently slows the speed to inhibit goal-directed reactions (Gauggel et al., Reference Gauggel, Rieger and Feghoff2004; Verbruggen & Logan, Reference Verbruggen and Logan2008). However, stronger impulse capture and less proficient response inhibition have been linked to various clinical and experimental factors in PD. For example, susceptibility to stronger impulse capture (but not response inhibition) is higher among individuals presenting with predominant postural instability and gait disorder (PIGD) compared to individuals with a tremor-dominant subtype (Wylie et al., Reference Wylie, van den Wildenberg, Ridderinkhof, Claassen, Wooten and Manning2012), and the strength of impulse capture is exacerbated by subthalamic nucleus (STN) deep brain stimulation (DBS) (Wylie, Ridderinkhof, Elias, et al., Reference Wylie, Ridderinkhof, Elias, Frysinger, Bashore, Downs and van den Wildenberg2010).
Alternatively, deficits in the proficiency of inhibiting interference (but not impulse capture) worsen in the dopamine withdrawn state (van Wouwe et al., Reference van Wouwe, Kanoff, Claassen, Spears, Neimat, van den Wildenberg and Wylie2016), with advancing disease severity (Wylie, Ridderinkhof, Bashore, et al., Reference Wylie, Ridderinkhof, Bashore and van den Wildenberg2010), under speed pressure (Wylie, van den Wildenberg, Ridderinkhof, Bashore, Powell, Manning, & Wooten, Reference Wylie, Van Den Wildenberg, Ridderinkhof, Bashore, Powell, Manning and Wooten2009a), and are particularly pronounced in individuals with freezing of gait symptoms (Lewis & Shine, Reference Lewis and Shine2014; Nutt et al., Reference Nutt, Bloem, Giladi, Hallett, Horak and Nieuwboer2011; Vandenbossche et al., Reference Vandenbossche, Deroost, Soetens, Coomans, Spildooren, Vercruysse and Kerckhofs2013). Modifying dopamine medications, STN DBS, and strategic focus on response accuracy (van Wouwe et al., Reference van Wouwe, van den Wildenberg, Claassen, Kanoff, Bashore and Wylie2014, Reference van Wouwe, Kanoff, Claassen, Spears, Neimat, van den Wildenberg and Wylie2016; Wylie, Ridderinkhof, Bashore, et al., Reference Wylie, Ridderinkhof, Bashore and van den Wildenberg2010) generally improve individuals’ ability to inhibit interference from conflicting motor impulses. Thus, a picture is emerging that PD is tightly linked to response conflict control deficits, and certain interventions ameliorate some of these deficits.
A relatively unexplored influence on the expression of conflict control deficits in PD relates to individual differences in broader motivational sensitivities and tendencies. Gray’s Reinforcement Sensitivity Theory (Gray, Reference Gray1987), delineates two broad motivational systems: The Behavioral Activation System (BAS) and the Behavioral Inhibition System (BIS). The theory asserts that the BAS regulates approach motivation, which energizes action and behaviors to enhance positive or rewarding experiences. Individuals with high BAS sensitivities have heightened awareness of reward opportunities, are motivated toward action to produce rewarding outcomes, and more likely to be fun-seekers and risk-takers (Gray, Reference Gray1987).
In contrast, the BIS is thought to regulate avoidance motivation, which prioritizes withholding action or avoiding behavior that may lead to punishment or negative outcomes. Individuals with high BIS sensitivity have heightened concern about negative outcomes, are motivated to withhold action or avoid behaviors that might produce negative outcomes, and are prone toward cautiousness and higher arousal/anxiety related to potential threats (Gray, Reference Gray1982; McNaughton & Corr, Reference McNaughton and Corr2004). The BAS and BIS systems are increasingly linked to dissociable neural mechanisms, including distinct patterns of morphological and functional activity within frontal-basal ganglia and septal-hippocampal circuitries, as well as dissociable underlying genetic factors (Reuter, Schmitz, Corr, & Hennig, Reference Reuter, Schmitz, Corr and Hennig2007; Ridderinkhof, van den Wildenberg, Segalowitz, & Carter, Reference Ridderinkhof, Van Den Wildenberg, Segalowitz and Carter2004).
More recent work has demonstrated dissociable cognitive effects that accompany individual differences in BIS and BAS sensitivities (Sommer, Van Der Molen, & De Pascalis, Reference Sommer, Van Der Molen and De Pascalis2016; van Steenbergen, Band, & Hommel, Reference van Steenbergen, Band and Hommel2009). Additionally, BIS and BAS sensitivities are reportedly altered in clinical disorders commonly linked to frontal-basal ganglia dysfunction and changes in impulse control (e.g., attention-deficit/hyperactivity disorder and Tourette’s; Gomez & Corr, Reference Gomez and Corr2014; Gray & McNaughton, Reference Gray and McNaughton2000; Heym, Kantini, Checkley, & Cassaday, Reference Heym, Kantini, Checkley and Cassaday2015).
In the current study, we investigated how individual differences in BIS and BAS in a large group of PD participants (n=69) are linked to impulse capture and response inhibition. We applied Dual Process Activation-Suppression (DPAS) theory to interpreting performance on the well-known Simon response conflict task (Simon, Reference Simon1969). The DPAS theory unveils the two critical processes involved in response conflict processing, the strength of the initial activation of response impulses (i.e., impulse capture), and the reactive inhibitory control engaged to suppress these impulses (Ridderinkhof, Reference Ridderinkhof2002; see also van den Wildenberg et al., Reference van Den Wildenberg, Wylie, Forstmann, Burle, Hasbroucq and Ridderinkhof2010). We hypothesized that PD participants with a higher susceptibility to impulse capture (i.e., poorer initial impulse control leading to fast impulsive errors) would be linked with riskier, reward sensitive styles reflected in higher BAS ratings or the more disinhibited, low punishment aversion styles of individuals with low BIS ratings.
Alternatively, we predicted reduced impulse capture and more proficient response inhibition would be associated with higher BIS ratings, consistent with the notion that a more behaviorally inhibited motivation style coincides with specific cognitive mechanisms that enhance control over behavioral reactions and impulses. Establishing links between motivational sensitivities and cognitive control processes in PD could directly impact pharmacological and neurosurgical strategies known to modulate these processes.
METHODS
Participants
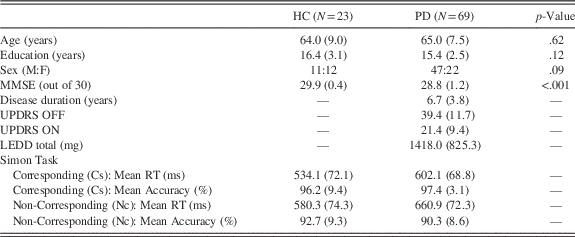
PD participants (n=69) were recruited from the Movement Disorders Clinic at Vanderbilt University Medical Center, and healthy controls (HCs; n=22) were recruited from community advertisement. HC and PD participant groups were similar in terms of age, education, and gender distribution, and there were no significant differences between group on any of these variables. All participants met the following exclusion criteria: no history of (i) neurological condition (besides PD); (ii) bipolar affective disorder or schizophrenia, (iii) medical condition known to interfere with cognition (e.g., diabetes, pulmonary disease). PD participants were diagnosed per the expert opinion of our movement disorder specialists and all participants were responding symptomatically to dopaminergic medications. PD motor symptoms were graded using the Unified Parkinson’s Disease Rating Scale (Goetz et al., Reference Goetz, Tilley, Shaftman, Stebbins, Fahn, Martinez‐Martin and Dodel2008) motor subscore; additionally, they all received a rating of stage III or less using the Hoehn & Yahr scale (Hoehn and Yahr, Reference Hoehn and Yahr1998).
Based on these data, each PD participant was experiencing mild to early moderate symptoms. PD participants were tested while on their regular medication condition. Of the 69 PD participants, 45 participants were taking dopamine agonists (i.e., pramipexole, ropinirole, and rotigotine). While there are several methods for calculating levodopa equivalence, we used the widely used method described in Weintraub et al. (Reference Weintraub, Siderowf, Potenza, Goveas, Morales, Duda and Stern2006), and dosages for dopamine medications were converted to levodopa equivalent daily dose (LEDD) values. Twenty-four participants were prescribed antidepressant medications at the time of testing. The majority of these medications were selective-serotonin reuptake inhibitors and selective norepinephrine reuptake inhibitors.
All PD participants performed at a level on the Mini-Mental State Examination (MMSE; Folstein, Folstein, & McHugh, Reference Folstein, Folstein and McHugh1975) that ruled out dementia but permitted very mild to minimal gross cognitive difficulties (Table 1). All participants reported stable mood functioning and the absence of major depression during a clinical interview, but we allowed endorsements of mild to low moderate symptoms of depression on the Beck Depression Inventory, Second Edition (BDI-II; Beck, Steer, & Brown, Reference Beck, Steer and Brown1996). All participants had corrected-to-normal vision. They all provided informed consent before participating in the study in full compliance with the standards of ethical conduct in human investigation as regulated by Vanderbilt University.
Characteristics of healthy control (HC) and Parkinson’s disease (PD) samples

Note. Mean values (standard deviations shown in parentheses).
MMSE=Mini-Mental Status Examination; UPDRS=Unified Parkinson’s Disease Rating Scale; LEDD=levodopa equivalent daily dose; RT=reaction time.
BIS/BAS Questionnaire
We used Carver and White’s (Reference Carver and White1994) BIS/BAS scale based on Gray’s reward sensitivity theory (Gray, Reference Gray1982; Gray & McNaughton, Reference Gray and McNaughton2000). This scale is composed of 20 Likert-type items on a five-point scale. The BIS scale captures motivational sensitivities and tendencies associated with inhibiting or avoiding behavior to avert punishment and loss of reward. The BAS scale captures motivational sensitivities and tendencies concerned with initiating behavior toward rewarding stimuli and outcomes and is divided into three subscales: (1) BAS-Drive, which measures task persistence in the pursuit of goals; (2) BAS-Fun Seeking, which measures spontaneity and novelty-seeking propensity, and (3) BAS-Reward Responsiveness, which is a measure of anticipatory pleasure of positive outcomes. Only PD participants completed the BIS/BAS questionnaire. HC participants did not complete the questionnaire, but did complete the Simon conflict task.
Simon Conflict Task and Procedures
The Simon task was administered on a laptop computer with a 15.5 in (39.4 cm) screen placed approximately 1 meter in front of the participant. Handheld response grips registered responses via a left or right thumb press made on a button at the end of each grip. Participants responded to a series of left and right pointing arrows that were presented one at a time on the computer screen. The beginning of a block of trials was signaled by the appearance of a small, centrally located black-colored square (i.e., a fixation point) against a dark gray-colored screen. The fixation point remained on the screen for the entire duration of a block of trials. Following the initial appearance of the fixation point, a leftward or rightward pointing arrow (length, 2.1 cm; visual angle, 1.14°) appeared 0.6 cm (0.34° visual angle) to the left or to the right of fixation and remained on the screen until the participant either made a response or a 1000 millisecond (ms) time limit elapsed. Next, a variable intertrial interval of 750 to 1250 ms elapsed before the next trial was initiated by the appearance of another arrow.
Participants were instructed to respond as quickly and as accurately to the direction of the arrow (e.g., left-pointing arrow=left button press; right-pointing arrow=right button press). Left and right pointing arrows were presented randomly and with equiprobability across each block of trials. To elicit the Simon effect, two trial types manipulated the correspondence between the spatial location of the arrow and the response signaled by the arrow direction. For Corresponding (Cs) trials, the arrow appeared to the side of fixation that matched the response side signaled by the direction that the arrow pointed (e.g., a right pointing arrow calling for a right-hand response appeared to the right visual half-field). For Non-corresponding (Nc) trials, the arrow appeared on the side of fixation opposite the side of the response signaled by the direction it pointed (e.g., a right pointing arrow calling for a right-hand response appeared to the left visual half-field). Cs and Nc trial types were presented randomly and with equiprobability within each block of trials. In total, participants completed 16 practice trials followed by 312 experimental trials (i.e., three blocks of 104 trials) equally divided among Cs and Nc trial types.
Statistical Techniques
Reaction time (RT) latencies for Cs and Nc trials faster than 180 ms (i.e., anticipatory reactions) and slower than 3 standard deviations above the mean within each condition were excluded, but these accounted for fewer than 1% of trials across participants (Wylie, Ridderinkhof, Bashore, et al., Reference Wylie, Ridderinkhof, Bashore and van den Wildenberg2010). Mean RT and accuracy rates were computed for each level of Correspondence to analyze mean interference costs on response latency and accuracy. Because accuracy rates are not distributed normally, we analyzed square-root transformed accuracy rates but report non-transformed values for ease of interpretation.
The DPAS model specifies a distributional analytical framework for dissociating two temporally distinct cognitive processes that are engaged in conflict tasks and masked in traditional mean interference costs. The first process, impulse capture, is reflected by the proportion of fast, impulsive errors that are easily visualized and measured in plots of accuracy rates against RT (i.e., a conditional accuracy function) for each level of Correspondence (Kornblum, Hasbroucq, Osman, Reference Kornblum, Hasbroucq and Osman1990; van den Wildenberg et al., Reference van Den Wildenberg, Wylie, Forstmann, Burle, Hasbroucq and Ridderinkhof2010; Wylie, Ridderinkhof, Bashore, et al., Reference Wylie, Ridderinkhof, Bashore and van den Wildenberg2010). Accuracy rates from the fastest RT bin of the CAFs for Nc trials are the most sensitive measures of the strength of initial impulse capture (see van den Wildenberg et al., Reference van Den Wildenberg, Wylie, Forstmann, Burle, Hasbroucq and Ridderinkhof2010).
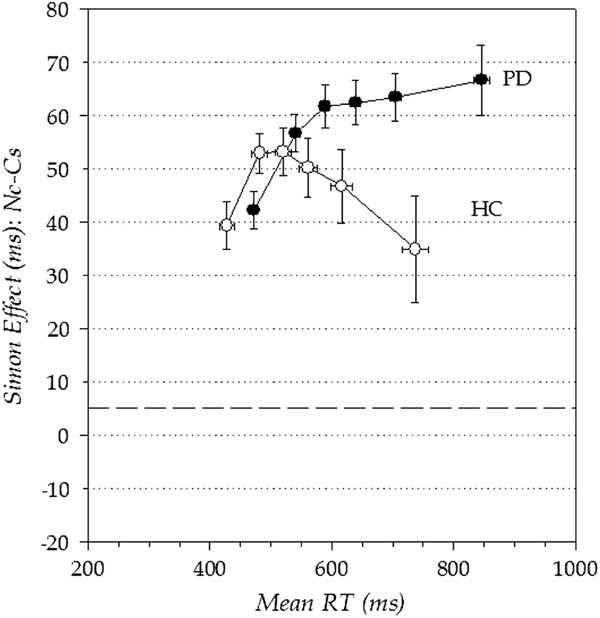
The second process reflects top–down inhibitory control that is engaged more slowly and builds up to suppress the interference produced by the conflicting action impulse (Ridderinkhof, Reference Ridderinkhof2002). Proficient inhibitory control is assumed to be most evident at the slow end of the RT distribution because it takes time for this control to build up after it has been triggered by the conflicting response impulse. Plotting the magnitude of the Simon interference effect (RT Nc trials minus RT Cs trials) as a function of response speed (i.e., a delta plot) yields a pattern of increasing interference across fast to intermediate response latencies that is followed by a dramatic and statistically deviant reduction (Luce, Reference Luce1991) in interference toward the slow end of the distribution (Proctor, Miles, & Baroni, Reference Proctor, Miles and Baroni2011).
The DPAS model asserts that the slope of the interference reduction at the slowest segment of the delta plot provides the most sensitive metric of the proficiency of inhibitory control over conflicting motor impulses, an assertion supported empirically across several studies using both non-clinical and clinical populations (Bub, Masson, & Lalonde, Reference Bub, Masson and Lalonde2006; Wijnen & Ridderinkhof, Reference Wijnen and Ridderinkhof2007; Burle, Possamaï, Vidal, Bonnet, & Hasbroucq, Reference Burle, Possamaï, Vidal, Bonnet and Hasbroucq2002; Ridderinkhof, Scheres, Oosterlaan, & Sergeant, Reference Ridderinkhof, Scheres, Oosterlaan and Sergeant2005; Wylie et al., Reference Wylie, van den Wildenberg, Ridderinkhof, Bashore, Powell, Manning and Wooten2009b; Wylie, Ridderinkhof, Bashore, et al., Reference Wylie, Ridderinkhof, Bashore and van den Wildenberg2010; for review, see Ridderinkhof, Forstmann, Wylie, & van den Wildenberg, Reference Ridderinkhof, Forstmann, Wylie, Burle and van den Wildenberg2011).
The first set of analyses compared PD participants and HC participants on mean interference effects (RT, accuracy), impulse capture (CAF), and proficiency of inhibitory control (delta plot) using separate repeated-measures analyses of variance (ANOVAs) and t tests as appropriate. This was intended to replicate effects in PD reported previously (van Wouwe et al., Reference van Wouwe, Kanoff, Claassen, Spears, Neimat, van den Wildenberg and Wylie2016; Wylie et al., Reference Wylie, van den Wildenberg, Ridderinkhof, Claassen, Wooten and Manning2012). Next, we computed correlations between BIS/BAS scores and impulse control and response inhibition in PD participants. We also examined Pearson’s correlations among our primary experimental measures, depression, and mental status scores in the PD group to ensure no significant relationships were found among these variables. Finally, we compared Simon task performance between PD participants with high versus low BIS scores using repeated-measures ANOVSs and t tests as appropriate.
RESULTS
Sample Demographics
Table 1 shows disease characteristics of the PD group and similarities in demographic variables between HC and PD groups.
Performance of PD Participants Versus HCs
Mean interference effects on RT and accuracy
Overall, PD participants were 71 ms slower to respond than HCs, but equally as accurate ([PD vs. HC: RT 631 vs. 557 ms; Accuracy 93.8% vs. 94.5%] Group: RT, F(1,90)=19.53; p<.001; Accuracy, F(1,90)=0.06; p=.808) (Table 1). A robust Simon effect was revealed by reactions that averaged 52 ms slower and 5.3% less accurate for Nc compared to Cs trials, (Correspondence: RT, F(1,90)=234.21; p<.001; Accuracy, F(1,90)=38.31; p<.001). The magnitude of the Simon effect on RT tended to be larger among PD participants (59 ms) compared to HCs (46 ms), and the Simon effect costs to accuracy rates were significantly larger among PD participants (PD: 7.1%; HC: 3.5%), (Group x Correspondence: RT, F(1,90)=3.37; p=.070; Accuracy, F(1,90)=4.51; p=.037).
Response capture by incorrect action impulses
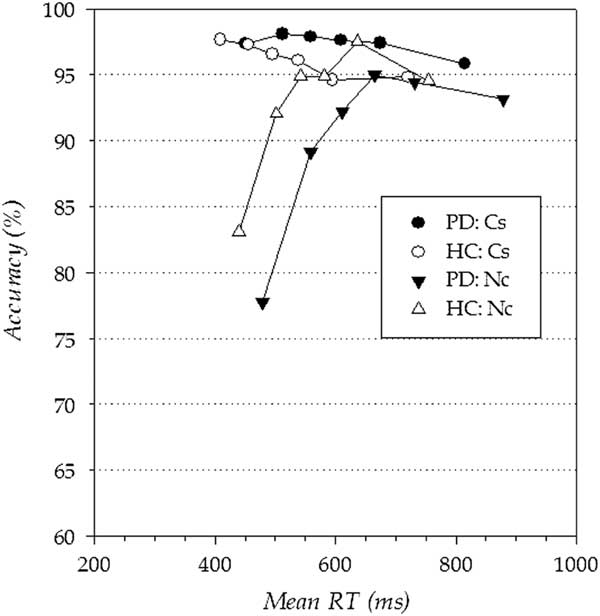
Consistent with the DPAS model, conditional accuracy functions (CAF) revealed a pattern of high rates of fast errors on Nc compared to Cs trials at the fastest bin of the RT distribution, but similar accuracy rates at intermediate and slower RT latency bins (Figure 1). As prescribed by the DPAS model, we focused our analysis on a group comparison of accuracy rates at the fastest RT bin (i.e., to measure rates of fast, impulsive action errors). This analysis showed that the higher percentage of fast impulsive errors on Nc compared to Cs trials (Correspondence, F(1,90)=60.16; p<.001) was similar across PD and HC Groups (Group x Correspondence, F(1,90)=1.08; p=.301). Within the conceptual framework of the DPAS model, these results support the conclusion that the strength of capture by incorrect response impulses was similar across PD and HC groups.
Conditional accuracy functions for Corresponding (Cs) and Non-corresponding (Nc) trial types for healthy controls (HCs) and Parkinson’s disease (PD) participants. Errors are predominantly associated with the fastest reaction times on Non-corresponding (Nc) trials. RT=reaction time.

Suppressing interference from action
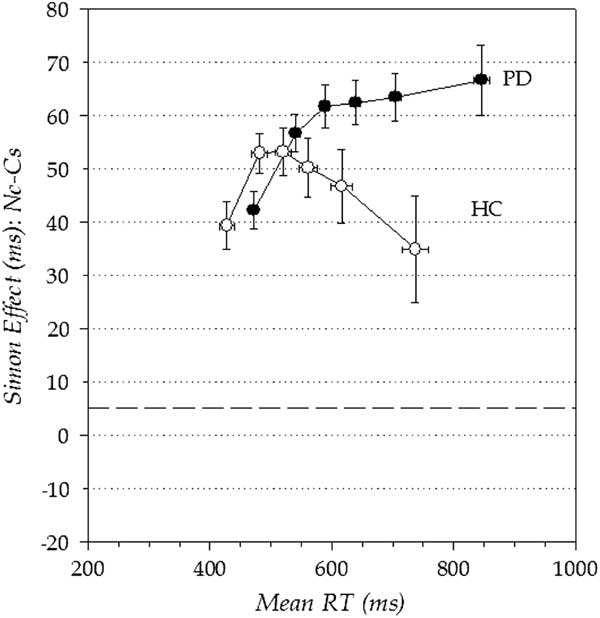
The delta plot (Figure 2) revealed the expected increase in RT interference effects across faster to intermediate response latencies that reverses toward the slow end of the RT distribution as inhibitory control builds up to suppress the incorrectly activated response impulse. The DPAS prescribes that the slope of the interference reduction between the final two bins of the delta plot is the most sensitive metric of the proficiency of inhibition, with more steeply negative-going slopes indicating more proficient inhibition (van den Wildenberg et al., Reference van Den Wildenberg, Wylie, Forstmann, Burle, Hasbroucq and Ridderinkhof2010). The slope of the final segment of the delta plot was less negative-going for PD participants (m=0.04; SEM=.03) compared to HCs (m=−0.09; SEM=.04) F(1,90)=4.65; p=.034). According to the DPAS model, this suggests that PD participants were less effective at inhibiting interference from action impulses compared to HCs.
Reaction time (RT) delta plots for healthy controls (HCs) and Parkinson’s disease (PD) participants. HC show initial increase in interference followed by a drastic suppression of interference (i.e., large negative delta slope) at the slow end of the distribution. PD participants show markedly less proficient suppression of interference from action impulses.
BIS/BAS and the expression and suppression of action impulses in PD
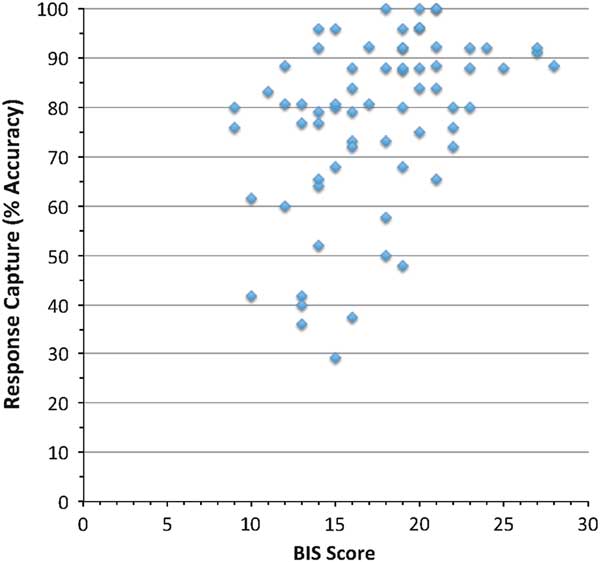
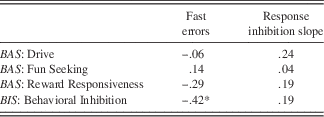
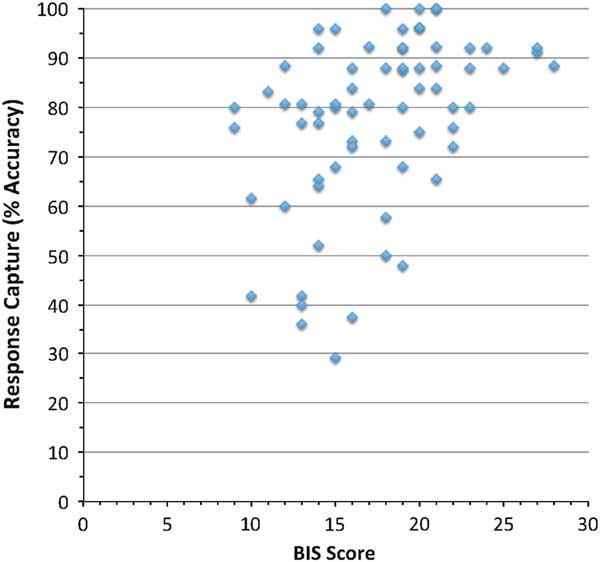
We analyzed the association between the three BAS scales, the BIS scale, and both fast impulsive error rates in the non-corresponding condition (i.e., response capture) and the final delta slope (i.e., proficiency of inhibition) (Table 2). Only one relationship was significant. Using an adjusted p-value (alpha=0.006) to accommodate the eight comparisons, BIS scores correlated significantly and positively with accuracy rates (i.e., negative correlation with fast impulsive error rates) from the fastest bin of NC trials (r=0.424; p<.001). These data are presented as a scatterplot in Figure 3.
Scatterplot showing relationship between BIS scores and accuracy rates
Correlation matrix crossing BIS/BAS with fast impulsive errors and response inhibition slope

*Pearson r-correlation significant at p-value less than .001(note: adjusted significance p-value=.006).
Thus, PD participants with low BIS sensitivity produced higher rates of impulsive errors. To rule out the possibility of a relationship between dopaminergic medication and BIS/BAS or response capture and inhibition, additional correlational analyses were performed between overall LEDD, dopamine agonist, BIS/BAS scores, and the Simon task measures. There were no statistically significant correlations between LEDD, dopamine agonist, and BIS/BAS scores or any significant correlations between LEDD or agonist with inhibition or impulse capture (rs<.20; ps>.1). Additional clinical and demographic variables (MMSE, BDI-II, age, disease duration, education) did not correlate with BIS/BAS scores or Simon task parameters either (rs<.22; ps>.06).
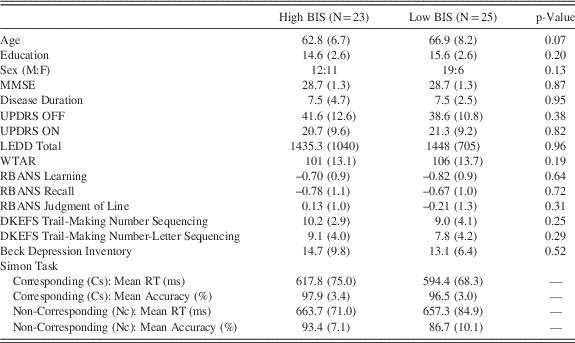
To further examine this effect and rule out influences due to clinical features, we performed a tertile split of the PD group based on BIS scores, and compared the extreme High BIS (n=23; mean BIS score=22.3; min-max=20–28) and Low BIS (n=25; mean BIS score=12.9; min-max=9–15; larger “n” due to ties) subgroups on performance data and clinical characteristics. The remaining subjects (n=21) were not included in this analysis. As shown in Table 3, the two groups did not differ in demographic, cognitive, or basic clinical features of PD.
Characteristics of sample by level of BIS sensitivity

Note. Means reported, with standard deviations in parentheses.
MMSE=Mini Mental State Exam; UPDRS=Unified Parkinson’s Disease Rating Scale; LEDD=levodopa equivalent daily dose; WTAR=Wechsler Test of Adult Reading; RBANS=Repeatable Battery for the Assessment of Neuropsychological Status; DKEFS=Delis-Kaplan Executive Function System; RT=reaction time.
Mean interference effects in high and low BIS subgroups
Overall, High and Low BIS subgroups showed similar response times, but Low BIS participants performed with lower accuracy than High BIS participants (High BIS vs. Low BIS: RT 626 vs. 641 ms; Accuracy 95.7% vs. 91.6%) (Group: RT, F(1,46)=0.49; p=.490; Accuracy, F(1,46)=6.69; p=.013) (Table 3). A robust Simon effect was revealed by reactions that averaged 54 ms slower and 5.1% less accurate for Nc compared to Cs trials (Correspondence: RT, F(1,46)=162.28; p<.001; Accuracy, F(1,46)=34.04; p<.001). The magnitude of the Simon effect on RT tended to be larger among Low BIS (63 ms) compared to High BIS (46 ms) participants, and the Simon effect costs to accuracy rates were significantly larger among Low BIS compared to High BIS participants (High BIS: 4.5%; Low BIS: 9.7%), (Group x Correspondence: RT, F(1,46)=3.97; p=.052; Accuracy, F(1,46)=5.04; p=.030).
Response capture in high and low BIS subgroups
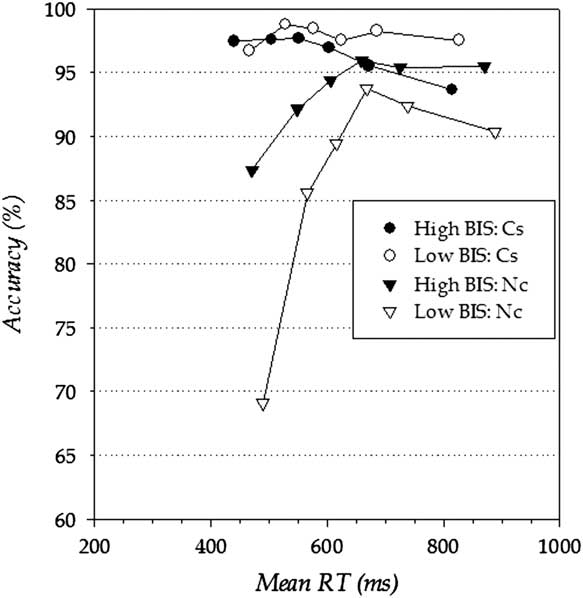
We first focused our analysis on a group comparison of accuracy rates at the fastest RT bin of the conditional accuracy functions to measure rates of fast, impulsive action errors (Figure 4). This analysis confirmed a higher percentage of fast impulsive errors on Nc compared to Cs trials (Correspondence, F(1,46)=55.64; p<.001) as well as a higher percentage of fast impulsive errors among Low BIS compared to High BIS participants, (Subgroup, F(1,46)=13.40; p=.001).
Conditional accuracy functions for Corresponding (Cs) and Non-corresponding (Nc) trial types for Parkinson’s disease (PD) participants in High BIS, Low BIS, High BAS, and Low BAS groups. RT=reaction time.
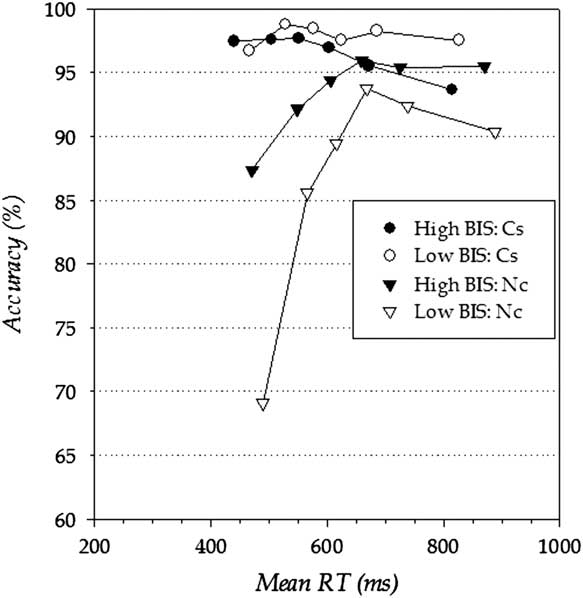
However, the magnitude of the difference in fast impulsive errors between Nc and Cs trials varied by subgroup, (Group x Correspondence, F(1,46)=16.16; p<.001), with the increase in fast impulsive error rates in Nc trials markedly higher in Low BIS participants (29% increase) compared to High BIS participants (9% increase). Within the conceptual framework of the DPAS model, these results indicate that the susceptibility to acting on strong response impulses (i.e., strength of impulse capture) is significantly more pronounced among PD participants with Low BIS scores compared to patient with High BIS scores.
The Low BIS group was much more susceptible to acting on fast incorrect response impulses compared to the High BIS group. It is important to rule out the possibility that this effect was not due to subgroup differences in the speed-accuracy tradeoff. That is, the Low BIS group may have prioritized speed of responding more than the High BIS group, which would inadvertently lead to more fast, impulsive errors in conflict tasks (van Wouwe et al., Reference van Wouwe, van den Wildenberg, Claassen, Kanoff, Bashore and Wylie2014). While the analyses above indicate that overall mean RTs did not differ between High and Low BIS subgroups, we further ruled out a speed-accuracy tradeoff explanation by showing that the subgroups did not differ in mean RTs on Nc trials (High vs. Low BIS: 663 vs. 657 ms; t(46)=−0.28; p=.782), or mean RTs associated with the fastest bin of Nc trials (High vs. Low BIS: 489 vs. 470 ms; t(46)=−1.17; p=.250).
Suppression of action impulses in high and low BIS subgroups
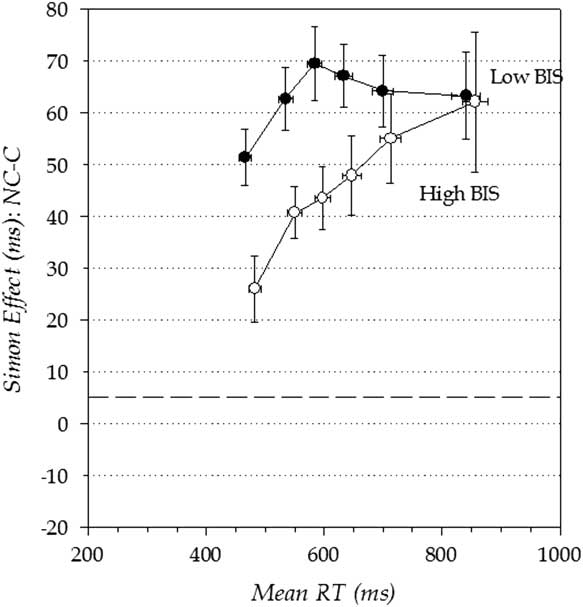
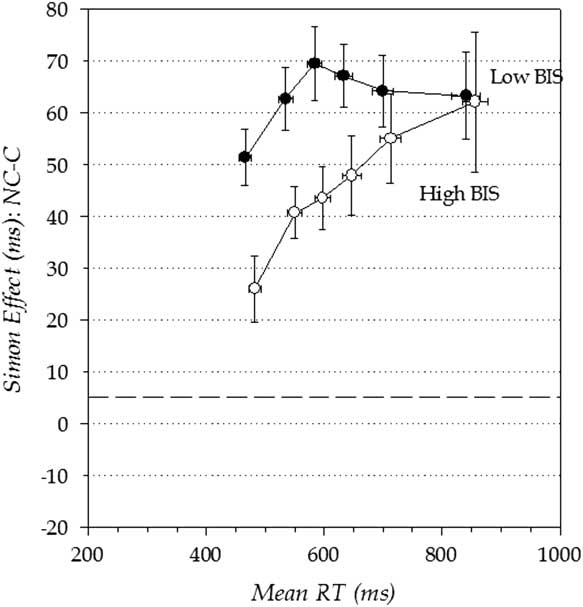
The delta plot shown in Figure 5 shows a highly similar pattern of interference effects across the RT distribution between High and Low BIS participants. As prescribed by the DPAS model, we analyzed slope of the interference reduction between the final two bins of the delta plot as the most sensitive metric of the proficiency of inhibition. The slope of the final segment of the delta plot was similar among High BIS (m=0.08; SEM=.04) and Low BIS (m=0.00; SEM=.06) subgroups, (F(1,46)=1.24; p=.271). According to the DPAS model, this suggests that the proficiency at inhibiting interference from action impulses was similar across these subgroups.
Reaction time (RT) delta plots for Parkinson’s disease (PD) participants in the High BIS vs Low BIS groups.
DISCUSSION
The present results replicate previous findings that PD participants generally show similar rates of impulse capture as HCs, but are significantly comprised in their proficiency at inhibiting interference from these impulses (Wylie et al., Reference Wylie, van den Wildenberg, Ridderinkhof, Bashore, Powell, Manning and Wooten2009b). A new twist is the demonstration that susceptibility to impulse capture (i.e., impulsive motor errors) in PD varies with motivational sensitivities. Specifically, PD participants with low BIS sensitivities are especially susceptible to acting on strong motor impulses, and this is not a by-product of differences in speed-accuracy tradeoffs. We did not observe any relationships between response inhibition proficiency and BIS/BAS motivational sensitivities.
A striking relationship between BIS sensitivity and susceptibility to acting on impulsive motor actions in PD may have important implications for how we conceptualize subtypes and individualized treatment in PD. Variations in BIS sensitivity have been linked to functional differences in the septohippocampal system as well as circuitries involving prefrontal, basal ganglia, and limbic system structures (Gray & McNaughton, Reference Gray and McNaughton2000; Shinagawa et al., Reference Shinagawa, Babu, Sturm, Shany-Ur, Toofanian Ross, Zackey and Rankin2015). These circuitries contribute to the regulation of arousal, attention, and action toward potential negative threats in the environment.
Indeed, studies show that individuals with high BIS sensitivity show increased skin conductance, decelerated EKG, and heightened dorsolateral prefrontal cortex activation in response to threat stimuli, all suggestive of heightened attentional vigilance and anxiety (Balconi, Falbo, & Conte, Reference Balconi, Falbo and Conte2012; Shackman, McMenamin, Maxwell, Greischar, & Davidson, Reference Shackman, McMenamin, Maxwell, Greischar and Davidson2009). Not surprising, individuals with high BIS are more likely to develop clinically significant symptoms of anxiety, including Generalized Anxiety Disorder, Panic Disorder, Social Anxiety, Post-Traumatic Stress Disorder (Johnson, Turner, & Iwata, Reference Johnson, Turner and Iwata2003; Maak, Tull, & Gratz, Reference Maack, Tull and Gratz2012). Low BIS sensitivity, in contrast, is accompanied by diminished responsiveness and arousal by negative threats, and consequently less anxiety and modulation of behavior to avoid negative outcomes.
The BIS has also been characterized as a system concerned with detecting and possibly adapting to behavioral conflicts (Amodio, Master, Yee, & Taylor, Reference Amodio, Master, Yee and Taylor2008; Berkman, Lieberman, & Gable, Reference Berkman, Lieberman and Gable2009). According to this notion, individuals with high BIS are more sensitive to response errors, conflicts between behavioral options, and conflicts between responses and expected outcomes (e.g., conflict between approach vs. avoidance options). Consistent with this view, Amodio et al. (Reference Amodio, Master, Yee and Taylor2008), demonstrated a positive association between BIS ratings and the amplitudes of event-related brain potentials associated with conflict detection (no-go N2 component) and response error signaling (error-related negativity).
These signals are linked to medial prefrontal and anterior cingulate sources (Botvinick, Braver, Barch, Carter, & Cohen, Reference Botvinick, Braver, Barch, Carter and Cohen2001; Carter et al., Reference Carter, Braver, Barch, Botvinick, Noll and Cohen1998; Yeung, Botvinick, & Cohen, Reference Yeung, Botvinick and Cohen2004), the volumes of which have also been linked to BIS sensitivity (Shinagawa et al., Reference Shinagawa, Babu, Sturm, Shany-Ur, Toofanian Ross, Zackey and Rankin2015). This suggests that individuals with low BIS sensitivities show diminished monitoring and detection of response conflict and errors compared to individuals with high BIS sensitivities. This corresponds with the present findings, suggesting that PD participants with low BIS sensitivity, who are much more susceptible to acting on incorrect motor impulses, may have fundamental differences in the neurocognitive circuitry critical for detecting and restraining potential motor response errors.
A linkage between BIS sensitivity and susceptibility to impulsive motor errors might help to uncover differences between individuals with PD and HCs that are not otherwise visible when comparing overall group scores (note that our original comparison between PD and HC did not reveal a difference in impulsive error rate). This relationship could also have valuable implications for treatment and preventative care in PD. For example, STN DBS has been linked to increased susceptibility to impulsive action errors (Hershey et al., Reference Hershey, Campbell, Videen, Lugar, Weaver, Hartlein and Perlmutter2010; Wylie, Ridderinkhof, Elias, et al., Reference Wylie, Ridderinkhof, Elias, Frysinger, Bashore, Downs and van den Wildenberg2010). Future research could establish whether individuals with low BIS are particularly vulnerable to STN DBS effects and whether they might represent a subset of individuals where DBS could target an alternative structure (e.g., globus pallidus interna). Individuals with predominant PIGD express greater susceptibility to acting on motor impulses, which has been proposed as an additional risk for falling (Wylie et al., Reference Wylie, van den Wildenberg, Ridderinkhof, Claassen, Wooten and Manning2012). Future research could determine if PD participants with PIGD and low BIS sensitivity are particularly vulnerable to impulsive action errors associated with walking, reaching, or driving.
The current study addressed a specific, individual motivational tendency (i.e., behavioral inhibition) and its connection to action control in patients with PD. Past attempts have been made to categorize and classify distinct personality traits associated with prodromal PD (i.e., the “Parkinson’s personality,” Todes & Lees, Reference Todes and Lees1985). However, these efforts have been met with criticism (see Ishihara & Brayne, Reference Ishihara and Brayne2006), as retrospective personality assessment of individuals with PD has proven problematic. An interesting question for future research concerns the longitudinal variability and stability of these motivational tendencies as PD progresses (as well as personality changes incurred as distinct pharmacological therapies are introduced).
Despite the replicated finding that PD disrupts reactive inhibition, we did not observe associations between inhibition and individual differences in BIS or BAS sensitivities. Amodio et al. (Reference Amodio, Master, Yee and Taylor2008) proposed that the reactive inhibition or cancellation of responses may be more connected to BAS sensitivity, a linkage supported in a recent study by Sütterlin, Andersson, and Claus (Reference Sütterlin, Andersson and Claus2011). Deficits in reactive inhibition appear to be general feature of PD, which may mask any potential associations to BAS sensitivities. Such a linkage awaits future investigation in a HC population. In fact, a limitation of the current study was that HCs did not complete BIS/BAS ratings and, therefore, we are unable to compare BIS/BAS scores of HC participants with PD participants. It is certainly possible that the observed relationship between BIS and fast, impulsive motor errors in PD exists in healthy adults as well. This gap represents an open question for future research. However, the lack of BIS/BAS data from a HC group does not detract from the relevance and importance of the present findings, particularly when considering the potential benefits (mitigating the risk of harm related to falls, driving accidents, etc.) to individuals with PD.
Another potential limitation is that PD participants were all tested in the dopamine-medicated state but the amount of dopamine medication was not related to BIS/BAS scores, or to the rate of impulsive errors. While prior studies of PD have reported no effect of dopamine modulation on impulsive error rates in the Simon task, or on other forms of inhibition as measured by the Stop task (Obeso et al., Reference Obeso, Wilkinson and Jahanshahi2011), nor a differentiation between effects of agonist and levodopa on impulsive errors, the effects of dopamine loss and dopamine therapy on BIS/BAS ratings over the course of PD is unknown (Claassen & Wylie, Reference Claassen and Wylie2012; van Wouwe et al., Reference van Wouwe, Kanoff, Claassen, Spears, Neimat, van den Wildenberg and Wylie2016). Given dopamine’s role in motivational and reward processing, an important question for future research concerns the evolution of approach and avoidance motivation across the course of PD and in response to dopamine therapies. For example, patients that develop dopamine agonist induced impulse control disorder (ICD) might show different BIS/BAS ratings before the onset of ICD compared to those who do not develop these medication-induced problems.
Our current findings suggest that individual differences in BIS are related to variations in impulse control in PD. Beyond individual differences in dopamine function, individual variations in impulse control could also reflect neural degeneration of other neurotransmitter systems. Neural degeneration associated with PD is complex and both serotonergic and noradrenergic systems have been implicated in impulsive responding in PD (Kehagia et al., Reference Kehagia, Housden, Regenthal, Barker, Müller, Rowe and Robbins2014; Ye et al., Reference Ye, Rae, Nombela, Ham, Rittman, Jones and Housden2016). Ye et al. (Reference Ye, Rae, Nombela, Ham, Rittman, Jones and Housden2016) showed that a subgroup of PD patients improved inhibitory control with atomoxetine and citalopram on a stop-signal task. The exploration of potential relationships between dissociable neurotransmission systems and individual differences in impulse control in PD is an open area for future research.
The current study suggests that the BIS-BAS scales may be a quick, cost-effective way to screen individuals with PD to determine risk for motor impulsivity, which could be helpful in treatment decisions and preventative strategies.
Acknowledgements
There are no known conflicts of interest associated with this publication, and there has been no significant financial support for this work that could have influenced its outcome. We thank Bert van Beek for programming the computer task.