Introduction
Psychopathology is operationalized in diagnostic classification systems of mental disorders that serve clinical practice. However, it is increasingly accepted that the disorders in these systems should be seen as pragmatic, man-made constructs (Kendler et al. Reference Kendler, Zachar and Craver2011; Frances & Widiger, Reference Frances and Widiger2012) that are fixed within time and within phenomenological boundaries. These constructs are meant to guide clinical decision making rather than represent true concepts underlying symptomatology. Psychopathology does not manifest itself in ‘natural types’, separated from a mentally healthy state or into different diagnostic entities by natural boundaries (Kendell & Jablensky, Reference Kendell and Jablensky2003). Rather, psychopathology may be conceptualized as varying dimensionally, extending from mild behavioral expression of liability in the general population to full-blown clinical disorder (Kendler & Gardner, Reference Kendler and Gardner1998; Carter et al. Reference Carter, Wittchen, Pfister and Kessler2001; Krueger & Piasecki, Reference Krueger and Piasecki2002; Angst et al. Reference Angst, Gamma, Benazzi, Ajdacic, Eich and Rössler2003; Kendell & Jablensky, Reference Kendell and Jablensky2003; Widiger, Reference Widiger2005; Van Os et al. Reference Van Os, Linscott, Myin-Germeys, Delespaul and Krabbendam2009; Haslam et al. Reference Haslam, Holland and Kuppens2011). High levels of co-morbidity and high within-diagnosis clinical heterogeneity (Kupfer et al. Reference Kupfer, First and Regier2002; Widiger, Reference Widiger2005; Widiger & Samuel, Reference Widiger and Samuel2005; Hyman, Reference Hyman2010; Kendler et al. Reference Kendler, Zachar and Craver2011) pose an additional challenge to categorical classification systems.
In addition to dichotomizing an essentially dimensional construct, current diagnostic systems also are based on a ‘snapshot’ approach in describing psychopathology (Bystritsky et al. Reference Bystritsky, Nierenberg, Feusner and Rabinovich2012), meaning that they are based on current, cross-sectional assessments. Psychopathological symptoms, however, are not static, but wax and wane over time, and symptoms may ‘emerge or morph’ into other symptoms over time within one individual (Bystritsky et al. Reference Bystritsky, Nierenberg, Feusner and Rabinovich2012). Thus, current diagnostic labels do not do justice to the complexity of mental illness. These diagnoses, however, still play a dominant role in psychiatric research and, as such, may hamper scientific progress in psychiatry.
To better understand psychopathology, a shift from a diagnosis-specific focus to a more trans-diagnostic focus, spanning multiple clinical syndromes, may be productive. A large body of research corroborates this notion by showing that factors of risk and resilience for psychopathology do not influence separate disorders, but commonly impact across diagnostic borders (Buckholtz & Meyer-Lindenberg, Reference Buckholtz and Meyer-Lindenberg2012). To date, no biological markers have been identified that are uniquely associated with a specific disorder (Kupfer et al. Reference Kupfer, First and Regier2002; Widiger & Samuel, Reference Widiger and Samuel2005). Instead, genetic effects appear to be small and polygenic (Buckholtz & Meyer-Lindenberg, Reference Buckholtz and Meyer-Lindenberg2012), and do not adhere to traditional diagnostic boundaries (Kendell & Jablensky, Reference Kendell and Jablensky2003). Likewise, endophenotypes such as cognitive alterations also occur in multiple disorders rather than showing disorder-specific associations (Weiser et al. Reference Weiser, van Os and Davidson2005; Hill et al. Reference Hill, Reilly, Harris, Rosen, Marvin, Deleon and Sweeny2009; Buckholtz & Meyer-Lindenberg, Reference Buckholtz and Meyer-Lindenberg2012). Additionally, many demographic and environmental risk factors for psychopathology such as rumination or the experience of stress increase risk for all diagnoses (Kessler et al. Reference Kessler, Price and Wortman1985; Breetvelt et al. Reference Breetvelt, Boks, Numans, Selten, Sommer, Grobbee, Kahn and Geerlings2010; Kessler et al. Reference Kessler, McLaughlin, Green, Gruber, Sampson, Zaslavsky, Aguilar-Gaxiola, Alhamzawi, Alonso and Angermeyer2010). To better understand the structure and development of psychopathology, it is important to explore methods revealing underlying patterns of behavior and experience, yielding quantitative rather than qualitative differences within and between individuals with different clinical syndromes.
The model that underlies the current diagnostic system is one in which psychopathological symptoms are seen as flowing from (i.e. caused by) underlying constructs. For example, depressive symptoms such as sleep problems, concentration problems and anhedonia are thought to be all caused by one underlying construct, i.e. depression (Borsboom & Cramer, Reference Borsboom and Cramer2013). However, this model may not be the best model to capture the nature of psychopathology. One important drawback of this model is that it does not assume associations between the individual symptoms, whereas this does seem plausible (e.g. sleep problems leading directly to concentration problems (Borsboom et al. Reference Borsboom, Cramer, Schmittmann, Epskamp and Waldorp2011). It has been suggested that the structure of psychopathology may be better described as a complex network of components that interact in dynamic and nonlinear ways both at biological (Buckholtz & Meyer-Lindenberg, Reference Buckholtz and Meyer-Lindenberg2012) and psychological (Kendler et al. Reference Kendler, Zachar and Craver2011) levels. A network representation of psychopathology at the symptom level proposes that mental states (referring to psychopathological symptoms, or to psychological strengths, such as positive affect or resilience) act as nodes in a network which, when activated, may trigger other mental states (Kendler et al. Reference Kendler, Zachar and Craver2011; Borsboom & Cramer, Reference Borsboom and Cramer2013). The associations are not necessarily linear, but can be reciprocal and/or (self-)enhancing, creating feedback loops in which, for example, worrying may cause someone to feel more anxious, which in turn, may cause this person to feel more down, which may temper feelings of cheerfulness. This approach to psychopathology may be useful to capture all relevant symptoms, irrespective of diagnosis, circumventing issues with diagnostic boundaries and co-morbidity. The strength of the causal connections between various mental states may differ between individuals. When several nodes keep reinforcing each other over time, vicious cycles can arise, from which it may be difficult to escape (Borsboom & Cramer, Reference Borsboom and Cramer2013; Wichers, Reference Wichers2014). Increased connectivity between mental states may be the force driving onset of mental disorder (Kendler et al. Reference Kendler, Zachar and Craver2011). Due to feedback loops and increased network connectivity, an individual may enter a downward spiral and over time develop a cluster of clinically relevant symptoms.
These ideas need empirical exploration, zooming in on the details of mental experience. This can be done by the use of momentary assessment techniques. The strength of a momentary approach is that it allows examination of the moment-to-moment experience (and fluctuation) of current mental states and their interconnections (Wichers, Reference Wichers2014). The goal of the present paper was to examine the concept of psychopathology from a network perspective, combining two approaches. First, we took a top-down approach by comparing the network structure of mental states across different diagnostic categories. For this purpose, networks of momentary mental states were compared between individuals with a diagnosis of depression, a diagnosis of psychotic disorder or no diagnosis. Based on previous work, we hypothesized that the networks of individuals with a diagnosis would have more and/or stronger connectivity between mental states over time within and between mental states compared to those of healthy individuals (Wigman et al. Reference Wigman, van Os, Thiery, Derom, Collip, Jacobs and Wichers2013b ). We also expected differences between networks of individuals with different diagnoses, each group showing more activation in the nodes that cover the symptom domains of their respective diagnostic categories (e.g. a more prominent role for feeling down in patients with depression). However, we also expected partial overlap in network activation patterns between the different diagnoses, given known high levels of co-morbidity (Kessler et al. Reference Kessler, Berglund, Demler, Jin, Merikangas and Walters2005; Kessler & Wang, Reference Kessler and Wang2008). Second, to take a different, complementary look at mental state dynamics, we used a bottom-up, data-driven approach to explore whether meaningful, empirically derived clusters of network components could be identified to effectively describe the variability in network structure across individuals of all groups taken together. We expected that similar mental state dynamics (e.g. associations between feelings of insecurity and feeling down) would cluster together. Last, to bring these two complementary approaches together, we compared the scores of these clusters across the three original diagnostic groups.
Method
Samples
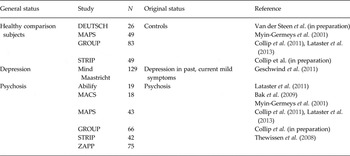
Data came from eight studies (Table 1) that used the Experience Sampling Method (ESM) protocol as described below, and were pooled for the current analyses. Individuals participating in these studies represented different diagnostic groups and were classified as follows (i) healthy subjects, (ii) individuals with a past diagnosis of depression and current mild depression and (iii) individuals with a psychotic disorder. More detailed information on the separate samples can be found in online Supplementary Table S1.
Overview of the pooled ESM studies, participant status and references to original study descriptions

ESM
ESM is a structured diary technique that addresses the daily living environment of participants and its interactions with the individual. Detailed information on ESM can be found elsewhere (Myin-Germeys et al. Reference Myin-Germeys, Oorschot, Collip, Lataster, Delespaul and van Os2009; Wichers et al. Reference Wichers, Lothmann, Simons, Nicolson and Peeters2011). Briefly, participants received a wristwatch that emitted a beep signal at quasi-random moments 10 times a day for five (Abilify study) or six (other studies) consecutive days. After each beep, participants were asked to complete a self-assessment diary, thus collecting reports of thoughts, affect, current context, and appraisals of the current situation. Adjectives of affect were rated on 7-point Likert scales ranging from 1 (‘not at all’) to 7 (‘very’). The following five items that were present in all samples were used: ‘cheerful’, ‘insecure’, ‘content’, ‘down’ and ‘suspicious’. Questions were phrased as: ‘At this moment I feel (e.g. down)’.
Analyses
Analyses were performed using Stata v. 12.1 (StataCorp, USA). Visualizations of networks were done in R (qgraph package; Epskamp et al. Reference Epskamp, Cramer, Waldorp, Schmittmann and Borsboom2011). ESM data have a hierarchical structure with multiple observations nested within individuals. Given that hierarchical clustering induces violation of the assumption of independence of observations, data were analyzed using multilevel mixed-effects regression models, adding random intercepts and random slopes to the model at the second (individual) level. The Stata xtmixed routine was used to accommodate the two levels of hierarchical clustering, yielding non-standardized regression coefficients. The covariance structure of the random intercepts and the random effects of the time component (‘beep’) was specified to be unstructured; the covariance structure of the random effects of the lagged momentary affect variables (see below) was specified as independent.
First, we took a top-down approach to explore the hypothesis that the three different groups have different networks of momentary mental states. To this end, we estimated mental state networks for each of the three groups separately and compared these, based on the method described in Bringmann et al. (Reference Bringmann, Vissers, Wichers, Geschwind, Kuppens, Peeters, Borsboom and Tuerlinckx2013). In particular, the impact of the five mental states on each other over time was examined using time-lagged variables in the multilevel regression models: all mental states at t were predicted by all other mental states at t−1 and by a ‘time’ variable (the latter controlling for time effects). For example, ‘cheerful’ at t was predicted by ‘cheerful’ at t−1, ‘insecure’ at t−1, ‘content’ at t−1, ‘down’ at t−1 and ‘suspicious’ at t−1. The same was done for the four other mental states. Each of these analyses was performed separately, resulting in five separate analyses. This procedure was repeated for the three different subsamples. In this way, a network of momentary mental states was created for each diagnostic group separately. Networks were constructed based on the fixed-effects coefficients from the lagged predictors, resulting in a weighted and directed network that also allows for self-loops (e.g. ‘content’ at t−1 predicting ‘content’ at t).
To compare the networks of the three groups, several network characteristics were assessed, in the form of five centrality indices (parameters that indicate how central the position of a node is in the total network; Opsahl et al. Reference Opsahl, Agneessens and Skvoretz2010; Epskamp et al. Reference Epskamp, Cramer, Waldorp, Schmittmann and Borsboom2011). First, node strength was calculated: the sum of the absolute weights of all (incoming and outgoing) connections that are incident in that node. This is one index of importance of a specific symptom: The higher the node strength, the more central is its position in the network. Second, outward degree was calculated as the sum of all outgoing connections. The higher this value is, the more this specific node influences other nodes. Third, inward degree was calculated as the sum of all incoming connections. The higher this value is, the more this specific node is influenced by other nodes. Fourth, closeness was calculated for each node, based on the inverse sum of shortest distances to all other nodes. An important node in the network will have high closeness, by being ‘close’ and thus being able to communicate quickly with other nodes. Last, betweenness refers to the degree to which a node lies on the shortest path between two other nodes (Opsahl et al. Reference Opsahl, Agneessens and Skvoretz2010; Epskamp et al. Reference Epskamp, Cramer, Waldorp, Schmittmann and Borsboom2011). The higher this value, the higher is the proportion of paths between other nodes in the network that this specific node is positioned on. All centrality indices were calculated based on absolute values of the significant pathways. These indices are used to describe multiple aspects of the connectedness of a network. Comparison of the indices over the three groups was done descriptively.
For the complementary bottom-up approach, we pooled data of the three diagnostic groups. Next, we derived the network connection strengths as described above using time-lagged multilevel analyses, but now for each individual separately in the pooled dataset containing all individuals and looked for meaningful clustering of these individual coefficients. So, for each individual separately 25 (5 × 5) new variables were calculated (i.e. five mental states, each predicted by the lagged versions of the same five mental states). A first obvious step for bottom-up, empirically-based clustering would be to cluster individuals based on their complete networks (i.e. at the person level). However, doing this would again imply that individuals can be segregated into distinct psychopathological groups, although this time on an empirical basis. We chose another approach that seemed more plausible and that would allow modeling of more heterogeneity and gradual differences in symptomatology between individuals: we hypothesized that network components (i.e. certain network connections) may cluster together. Using this strategy, data-reduction techniques might yield several ‘network components’ on which individuals and/or groups can show quantitative differences. We therefore conducted a principal component analysis (PCA) based on the 25 variables derived from the individual analyses described above. First, a parallel analysis was used to determine how many principal components should be extracted from the data (see O'Connor, Reference O'Connor2000 for additional information). Parallel analysis is a technique that helps to determine the optimal number of factors to retain in PCA. A PCA was then performed with the number of factors to extract based on the results of the parallel analysis, using an oblique promax rotation (assuming correlated components). These components were then interpreted. In this way, we were able to reduce the full palette of all possible network connection strengths per individual to a smaller number of network components. Finally, component scores were estimated for each individual and the original three groups (diagnosis of depression, psychotic disorder or no diagnosis) were compared on their group-average component scores.
Ethical standards
The authors assert that all procedures contributing to this work comply with the ethical standards of the relevant national and institutional committees on human experimentation and with the Helsinki Declaration of 1975, as revised in 2008.
Results
Descriptions of the samples
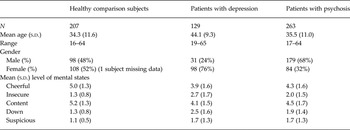
Characteristics of the different samples are presented in Table 2. The three groups differed significantly on mean scores of all five mental states (all p < 0.05). Healthy comparison subjects reported the highest levels of ‘positive’ momentary mental states (‘cheerful’, ‘content’) and the lowest levels of the ‘negative’ momentary mental states (‘down’, ‘insecure’, ‘suspicious’). Individuals with depression reported the opposite. Mean momentary mental state levels of individuals with psychosis were intermediate to those of controls and individuals with depression for both positive and negative mental states, with the exception that they reported similar mean levels of ‘suspicious’ as individuals with depression. The correlations of all mental states were moderate to substantial, ranging between 0.47 and 0.83.
Descriptions of different samples

Top-down approach: comparing networks of mental states over the three groups
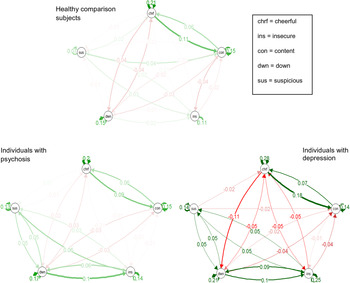
In online Supplementary Table S2, all associations between the five mental states are listed for, respectively, healthy comparison subjects, individuals with depression, and individuals with psychosis. Fig. 1 displays these mental state networks of the three different groups visually. Comparison of the networks of mental states over the three groups showed that healthy comparison subjects have fewest inter-mental state connections. Positive mental states play an important role in this group: a positive loop between ‘cheerful’ and ‘content’ is present; also, feeling more ‘cheerful’ and ‘content’ leads to feeling less ‘down’ and less ‘insecure’. The mental state network of individuals with psychotic disorder showed an intermediate number of significant interconnections compared to the other two groups. There were some similarities between the networks of individuals with depression and individuals with a psychotic disorder. In both, a strong (positive) loop between the three negative mental states was present. The main difference between these networks was that in patients with depression, many connections were present between positive and negative emotions, which were almost absent in patients with psychotic disorder. This is also an interesting difference between the comparison subjects and the individuals with psychosis: in the first group, there are connections between the positive and negative mental states that are less clear in the last group. In the individuals with psychosis, positive mental states and negative mental states seem to form two more or less separate loops.
Different networks of momentary mental states in healthy comparison subjects, individuals with depression and individuals with psychosis. In this figure, the arrows represent associations over time: for example, in the network of healthy controls, there is an arrow from ‘content’ to ‘cheerful’, meaning that there is an association from ‘content’ at t−1 to ‘cheerful’ at t. Green arrows represent positive associations and red arrows represent negative associations. The fading of the lines represents the strength of the association: the more solid the line, the stronger the association (and vice versa). For all path coefficients and their significance, please refer to online Supplementary Table S1.

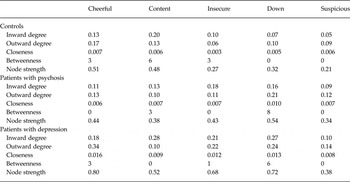
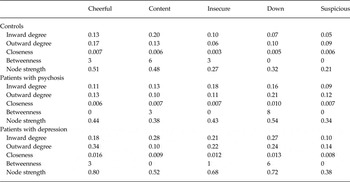
Table 3 shows the centrality indices for the three groups. Connectedness was higher in the group with depressed patients than in the other two groups as indicated by higher values of node strength and by the fact that the mental states had a higher degree of inward and outward degree than the other two groups. The mental states ‘cheerful’ and ‘down’ appeared to play a central role in individuals with depression, since in this group these states showed shorter path lengths in their connections to other mental states compared to other nodes (and to the other groups) as indicated by the closeness index. With regard to node strength, it is interesting to see that the individuals with depression always have the highest node strength, but that individuals with psychosis have the lowest node strength for the positive mental stats and the controls have the lowest node strength for the negative mental states. Finally, healthy comparison subjects differed from the groups with mental disorder in particular on the inward and outward degree of the negative mental states: compared to the two patients groups, the comparison subjects displayed less connections coming from or going to negative mental states. With regard to the positive mental states, the three groups were comparable.
Centrality indices of the mental state networks of the three groups
Bottom-up approach: exploring and comparing the components underlying network associations
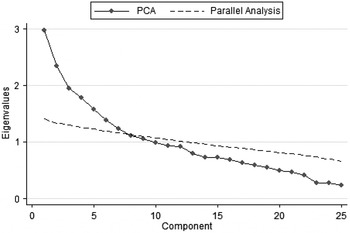
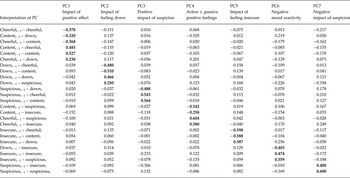
Parallel analysis suggested that the coefficients (i.e. network connection strengths) derived from the individual analyses could be reduced to seven components (Fig. 2). This means that all information that is found in all individual associations can be reduced to seven clusters. The loadings represent the relationship between the respective component and the original association (e.g. between ‘cheerful’ at t−1 and ‘down’ at t). The distribution of the coefficients’ loadings over the seven principal components and the interpretation of these components are shown in Table 4. For each element, all loadings are shown. When loadings are in bold listed underneath a certain PC, this means that particular element is assigned to that particular PC. Associations that loaded on principal component (PC) 1 all started with a positive mental state at t−1. Therefore, this component was interpreted to reflect the ‘impact of positive mental states’. This PC was less straightforward in its interpretation than the other PCs. For example, the association between ‘cheerful’ at t−1 and ‘cheerful’ at t loaded negatively on this PC, where the association between ‘content’ at t−1 and ‘content’ at t loaded positively on it. It is not completely clear why this PC is more complicated in its loading patterns. One possible explanation is that this component is the most general component, tapping also into the other PCs, as the associations that load highest on this PC also have quite high loadings on other PCs. This is less the case with other PCs, where the discrepancy between the highest loading and the lower loadings is much larger. Associations of ‘down’ at t−1 with other mental states at t all loaded on PC2 and thus suggests that this component reflects a ‘negative impact of feeling down’ on other mental states. PC3 was interpreted as representing ‘positive impact of suspicion’, since this component involved associations showing a favorable impact of suspicion on subsequent mental states. Positive associations between ‘content’ at t−1 and negative mental states at t and negative associations between ‘cheerful’ at t−1 and negative mental states at t, all loaded on PC4.This component was interpreted as representing the differential impact of ‘active v. passive positive feelings’. Associations of ‘insecure’ at t−1 with other mental states at t loaded on PC5, representing a ‘negative impact of feeling insecure’ component. Since PC6 captured associations from only connections between negative mental states, we interpreted this component as ‘negative mood reactivity’. PC7 captured only two associations, both reflecting positive associations between negative moods and originating from ‘suspicion’ at t−1. This component was thus interpreted as reflecting ‘negative impact of suspicion’. Together, these seven components represented seven core components of the networks between these specific five mental states, estimated at the individual level and over time.
The number of components as suggested by regular principal component analysis (PCA) and parallel analysis. The last number of components suggested by the regular PCA that is higher than the number of component suggested by parallel analysis, is suggested to be the best number of components to retain. In this case, the first seven components suggested by PCA have higher eigenvalues than the first seven components suggested by the parallel analysis. However, the eigenvalue of the eighth component suggested by regular PCA is lower than the eigenvalue of the eighth component suggested by parallel analysis. Thus, a solution with seven components is suggested to be the best solution.

The 25 elements that are distributed over the seven components represent the network connection strengths that appear to cluster together (per component) in the total sample of participants. Thus, for example lower connection strength between downt−1 and cheerful (PC2, connection 1) tends to co-occur with higher connection strength between downt−1 and down (PC2, connection 3)

PC, Principal component.
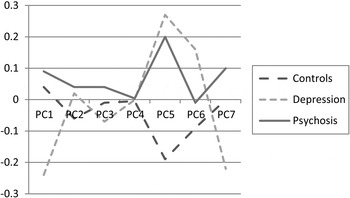
Fig. 3 shows mean component scores plotted across the three groups. Some interesting patterns can be seen. First, there are two components involving suspicion, one with positive and one with negative impact of suspicion. This suggests that suspicion can also have a ‘healthy’ function, as long as it does not persist or leads to subsequent negative mental states. Individuals with psychosis score higher on both these components, suggesting that they are more sensitive to the (positive as well as negative) effects of suspicion, but that it is mainly the negative effects of suspicion that define them as a group with psychotic disorder, distinguishing them from both the healthy comparison and the depression groups. Moreover, both groups with a psychiatric diagnosis score higher on the ‘impact of insecure’ component than the healthy comparisons, suggesting that this is a general component of mental illness that might be present across multiple psychopathological dimensions. Last, individuals with depression not only score lowest on both positive and negative impact of suspicion, but they also score lowest on the component ‘impact of positive feelings’. This may reflect (and perhaps partly explain) why this group reports depressive, and not psychotic, symptomatology.
Mean component scores for the three groups. Only the difference on PC5 is significant (p < 0.05). PC1: Impact of positive affect. PC2: Impact of feeling down. PC3: Positive impact of suspicion. PC4: Active v. passive positive feelings. PC5: Impact of feeling insecure, PC6: Negative mood reactivity. PC7: Negative impact of suspicion.

Thus, the associations of the mental state networks cluster together in several components, that can vary between individuals and/or groups, sometimes differentiating between healthy controls v. patients, sometimes between patients with different disorders, sometimes between controls and individuals with one disorder together v. individuals with another disorder and sometimes between all three groups.
Discussion
We investigated the structure of psychopathology from a dynamic network approach, showing how momentary assessment techniques can be used to expose the underlying micro-structure of psychopathology. The hypothesis that individuals with a clinical diagnosis had more strongly connected mental state network structures was confirmed. They showed stronger mental state cross-reactivity and persisting of affect over time. This finding was most robust for the depressed group. Furthermore, networks of individuals with a psychiatric diagnosis contained loops which may catch individuals into a downward spiral of negative mental states. There were also differences between the two diagnostic groups: the depressed group showed more interconnections between positive and negative mental states than the psychotic group.
This top-down approach was followed by a complementary bottom-up approach in which we derived components of psychopathology based on a clustering of the empirically derived network structures: all possible connections over time between the five mental states (‘cheerful’, ‘content’, ‘down’, ‘insecure’ and ‘suspicious’) were clustered into seven main components that together captured the main characteristics of the network dynamics. These components involved (i) the impact that specific states or groups of mental states have in the network, (ii) dynamics between negative and positive states, or active and passive states, and (iii) reactivity between negative mental states. Associations between these empirically derived components and the diagnostic groups as defined by current classification systems showed that these two approaches yield different, complementing perspectives in the field of psychopathology.
A network approach to psychopathology
Some interesting features were found in the networks of different diagnostic groups in the top-down approach. In all three groups, a positive loop between feeling ‘cheerful’ and ‘content’ was present. Of interest here is that this loop was the strongest in the depressed group, which seems unexpected; also, in individuals with psychosis, this loop seemed more ‘disconnected’ from the network of negative mental states. This suggests that positive mental states play a central role in all human mental processes, i.e. in both healthy and more pathological states. The mental state network of individuals with psychosis was dominated by two loops: a positive loop between ‘cheerful’ and ‘content’, which was similar as the one in the healthy comparison group, and another loop that involved reinforcing effects between the three negative mental states. The two loops are connected by the negative impact of feeling ‘content’ on feeling ‘down’. Once an individual ends up in the negative loop, negative mental states keep reinforcing each other. In the depressed group, a similar negative loop between the three negative mental states was found. In this group, however, negative loops also existed between ‘cheerful’ and ‘down’ and ‘cheerful’ and ‘insecure’, which were absent in psychosis. In other words, negative mental states not only reinforced each other but also impacted negatively on the active positive state of feeling ‘cheerful’ in depressed individuals. Less cheerfulness in turn fueled the negative mental state loop. Also, in the depressed group, negative mental states decreased ‘content’, whereas in the controls the opposite occurred: ‘content’ reduced feeling ‘insecure’ and ‘down’. Thus, network dynamics may explain why some individuals end up depressed whilst others do not. Some individuals have a structure in which negative mental states not only tend to accumulate but in which negative states, additionally, suppress positive emotional states. The fact that the latter was absent in the psychosis group may explain why this group, although experiencing negative mental states, was not primarily labeled with a mood disorder.
The network approach shows how both quantitative (e.g. the same association in two groups, but different in strength) and qualitative differences (e.g. presence of a certain association in one group but its absence in another) between individuals together influence vulnerability for developing certain psychopathological states. Transfer between (in particular negative) mental states is less strong (quantitative differences) in healthy individuals compared to individuals with higher levels of psychopathology, which is in line with earlier work (Wigman et al. Reference Wigman, Collip, Wichers, Delespaul, Derom, Thiery, Vollebergh, Lataster, Jacobs, Myin-Germeys and van Os2013a ). But also the specific connections and combinations of loops (qualitative differences) appear important in specifying the kind of psychopathology an individual may develop.
Traditional momentary assessment analyses show each of the effects separately. Using a network approach, we tried to bring these effects together. It shows the inherent complexity of interconnections of mental states and how certain parts of a system can influence the total system (Wichers, Reference Wichers2014). The principles of dynamic system theory may be applied to the development of psychopathological states in terms of changes in network connectivity (Borsboom & Cramer, Reference Borsboom and Cramer2013; Van de Leemput et al. Reference Van de Leemput, Wichers, Cramer, Borsboom, Tuerlinckx, Kuppens, van Nes, Viechtbauer, Giltay, Aggen, Derom, Jacobs, Kendler, van der Maas, Neale, Peeters, Theiry, Zachaer and Scheffer2013). Slow quantitative increases in network connections may reach a threshold at which a sudden qualitative change occurs. We can illustrate this with an example – based on the psychosis network structure (Fig. 1) – in which the negative connection between feeling ‘content’ and ‘down’ would slowly increase in a hypothetical individual. At first, this person is healthy, experiencing few negative mental states. When this person experiences a major stressor, this can strongly reduce the person's contentment, which in turn can trigger a large enough increase in feeling ‘down’ that the negative loop is activated. At that moment, a quick accumulation of negative mental states may arise. These mental states may keep reinforcing each other, bringing about a qualitative change that is diagnosed as psychosis. Thus, the network approach may provide us with a plausible new perspective on the mechanisms of psychopathology.
In the context of classification of psychopathology
The bottom-up approach shows the possibilities of thinking outside the boundaries of diagnostic classification, investigating psychopathology based on empirically derived network structures. These network structures expose the emotional dynamics that may form the basis of a person's vulnerability to psychopathology. Although current classification systems such as the Diagnostic and Statistical Manual of mental Disorders (DSM) are conceptually and clinically very appealing and useful, an empirical classification may offer a complementary approach to better understand the underlying dynamics that may be at the core of psychiatric symptoms. For example, person A and B may both fall in the DSM-5 category of major depression but may experience different symptom patterns. Examining their network structures as clustered in the components that were identified, these individuals may display dynamic patterns between symptoms that differ substantially. For example, for person A, who scores high on negative mood reactivity, the impact a negative emotion persists over time and may trigger a cascade of other negative emotions (PC6). Person B, on the other hand, may experience that negative emotions specifically diminish his positive emotions (PC1). These individual differences in vulnerability may explain differences in symptom reports and may require different treatment strategies. A network approach may thus complement traditional diagnostic practice, helping to better understand similarities and differences across diagnostic groups.
We wish to stress that the two approaches we used are complementary. Although Fig. 3 shows that DSM diagnostic classification is different from the bottom-up classification, there are also consistencies. In the psychosis group, for example, suspicion is more likely to trigger negative emotions (PC7). Likewise, individuals in the depressed group score on average lower on the impact of positive emotions (PC1) and higher on negative mood reactivity (PC6). The current network perspective on psychopathology may help to explain the large heterogeneity within clinical diagnostic groups as well as the fuzzy separation and existing co-morbidity between disorders. It furthermore challenges us to regard psychopathology not as a large set of different, separate mental disorders, each flowing from its own underlying cause, but as the result from one underlying explanatory principle, namely the interconnectivity between mental states that underlies these symptoms.
Strengths and limitations
An important strength of the current study is that it used data from a large, pooled dataset which allowed us to compare three large groups, representing different levels and types of psychopathology. The combination of a top-down and a bottom-up approach to psychopathology using network methodology is innovative. As data were originally collected for other research questions, the analyses of the current paper are secondary. Important limitations that follow from this are that only three diagnostic groups, and five specific mental states were included. Participants in each diagnostic group came from multiple studies. This is an advantage, since larger numbers increase statistical power, but also a disadvantage because the participants in each diagnostic group thus form a quite heterogeneous subgroup, and may have different current levels of symptomatology. The most heterogeneous group is the group with individuals with psychosis, as this group included individuals with different levels of current psychosis (i.e. acutely psychotic and not currently psychotic but nevertheless diagnosed with psychotic disorder). Therefore, interpretation of the results should be carefully considered and replicated in future work. Although diagnostic groups are in general quite heterogeneous and consist of individuals with large differences in their symptomatology (Kupfer et al. Reference Kupfer, First and Regier2002; Widiger, Reference Widiger2005; Widiger & Samuel, Reference Widiger and Samuel2005; Hyman, Reference Hyman2010; Kendler et al. Reference Kendler, Zachar and Craver2011), more research is needed to replicate and extend our findings. Future research should also include a broader spectrum of symptomatology so transdiagnostic processes can be truly investigated. This is a first, explorative study which needs replication and further research. For the current analyses, we have chosen to use PCA to reduce the total possible associations between the five mental states that were included in this study. Since there is a subjective component to this approach in the interpretation of the components, these results should be replicated and other methods, on other data, should be explored as well. Although we have used a network approach to examine the dynamics of mental states over time, we used separate analyses for each mental state. Although the covariance structure in the models was specified as unstructured for time, thus allowing for dependence across error variances where we most expected it, it was not possible to use the unstructured option for all effects in the model. Although it is possible that these effects actually are dependent, specifying them to be so led to problems with model estimation because the models then became too complicated and did not converge. Thus, the random effects of the lagged variables were specified to be independent to enable model conversion. In future research, more sophisticated techniques may be used to map mental state interconnectivity directly in one analysis. Comparison of the networks of the three groups was done descriptively. The networks could not be statistically compared because, currently, there is no reliable and valid way to do that. Network techniques combined with this type of data constitute a new field within psychiatry that is currently strongly under development. Likely, improved statistical techniques will be available within a few years and formal comparison of networks through e.g. comparison of centrality indices will be possible.
Clinical implications and future directions
This is a first attempt to explore the dynamic connectivity of basic experiential units that may underlie psychopathology. Although evidence for its validity is now starting to accumulate, more research is needed to further establish the diagnostic value of the network approach to psychopathology. Potentially, this approach may have high clinical relevance in exposing personalized vulnerability structures regarding the emotional dynamics that take place in daily life. Furthermore, it may help to better identify what specific disorder an individual is more likely to develop, an individual's capacity to recover and to assist in making personalized decisions regarding the timing and choice of intervention. More research, however, is needed to further examine the potential for the network approach to (i) assess individual changes in network structure, (ii) predict level and type of future psychopathology, and (iii) predict capacity for recovery. Future research may also explore the differences in network dynamics between genders, as our results (different male:female ratio in the different diagnostic groups), and previous research (Rosenfield & Mouzon, Reference Rosenfield, Mouzon and Aneshensel2013), suggest that problems in affect and affect dynamics differ substantially between men and women.
Appendix. Members of MERGE (in alphabetical order)
D. Collip, Ph. Delespaul, I. Germeys, N. Geschwind, C. Henquet, M. Janssens, M. Lardinois, J. Lataster, T. Lataster, C. Lothmann, M. Vannierop, M. Oorschot, C. Simons, V. Thewissen, W. Viechtbauer, M. Wichers.
Supplementary material
For supplementary material accompanying this paper visit http://dx.doi.org/10.1017/S0033291715000331.
Acknowledgements
J.T.W.W. is supported by a Netherlands Organization for Scientific Research (NWO) Veni Grant. M.W. is supported by a Netherlands Organization for Scientific Research (NWO) Aspasia research grant. The authors thank all participants in the ESM studies, as well as all the people who have, in any way, helped to set up the studies, collect the data or to assemble the merged data file.
Declaration of Interest
None.