The economics of interwar household management have attracted substantial interest from scholars.Footnote 1 However, microeconomic analysis of consumer behavior for this period has hitherto been severely limited by the lack of extensive household-level survey data on consumer expenditure and credit. Research on Britain has been particularly difficult as, unlike the United States, there are no pre-1945 national accounting data for consumer debt and its components, or detailed estimates of the volume of credit sales.Footnote 2
This article focuses on the strategies working-class British households used to “smooth” consumption over time, cope with “crisis” phases of the household life-cycle, and guard against negative contingencies such as illness, unemployment, and death.Footnote 3 As S. J. Prais and Hendrik S. Houtakker noted, typical working-class households had both negligible savings and an uncertain and irregular income stream.Footnote 4 Household financial management thus involved two major problems: coping with the volatility of income, and with the volatility of consumption. Successful income smoothing was beyond the financial means of most interwar British families and resources put aside for this purpose might reduce entitlement to welfare benefits. Not surprisingly therefore, as the following analysis will demonstrate, household management tended to focus primarily on consumption smoothing. New items of furniture, household appliances, coal deliveries, or even something as small as a new pair of shoes, often strained household finances based on a weekly budgeting cycle, with little margin for “lumpy” purchases.
The solutions households adopted were influenced by social norms and most importantly the pressure to meet the expenditure standards of their local reference groups.Footnote 5 Yet it was the level and stability of income that overwhelmingly shaped and constrained consumption-smoothing strategies, the general rule being that the poorer the household was, the more the housewife had to rely on an array of credit and savings mechanisms to make ends meet.Footnote 6 Contemporaries noted major changes in these mechanisms over the interwar years, as rising living standards allowed many families to avoid “weekly or monthly ‘crises' of complete bankruptcy.”Footnote 7 Thus the extremely expensive loan services of moneylenders and pawnbrokers were increasingly rejected in favor of credit/savings vehicles linked to particular categories of goods and services, involving regular payments suitable for the weekly household budgeting cycle.
After outlining the main retail credit and contractual savings mechanisms, the article provides the first national estimates of their use prior to 1945, using newly discovered returns from the Ministry of Labour's 1937/38 Household Expenditure Survey. We show that households made extensive us of expenditure-smoothing devices, including for some purposes that are poorly-documented in contemporary accounts, such as coal supplies and medical costs. Moreover, the extent of their use is shown to be inversely related to household income. Households are also shown to have made markedly heavier use of expenditure-smoothing during expenditure crisis phases of the family life cycle, especially the years immediately after new household formation.
CREDIT AND SAVINGS
Working-class households relied overwhelmingly on credit and savings vehicles tied to particular areas of expenditure and, in most cases, provided through—or in association with—retailers. The simplest (and, for groceries, standard) form involved general credit at local shops, housewives running up a “tab” that would be paid off at the end of each week. However, acquiring items of significant value generally involved some form of installment credit/savings, the form of which varied according to the cost and product characteristics of the good in question.
Rotating Credit
“Rotating savings and credit associations” have proved a popular solution to the adverse selection problems inherent in consumer credit, by using the social constraints of maintaining esteem within the community as a deterrent to nonpayment.Footnote 8 In Britain, these were known as “clubs” and were popular for relatively inexpensive durables which could not be readily resold except at a considerable discount, such as clothing, household textiles, and footwear.Footnote 9 One popular method was the “draw club”—with 20 people paying in, say, a shilling per week for 21 weeks—each weekly take being assigned to one member via a lottery. After 20 weeks, everyone would have received £1 and the person running the club would get the 21st payment (the “poundage”) as a reward for their effort.
Clubs were vigorously promoted by retailers; mail order firms being particularly active in this area. Mail order houses relied on community-based (often female) organizers, who recruited and vetted membership and policed payments. This policing function became more important when some mail order firms moved from draw clubs to clubs where customers only had to make the first payment to take possession— i.e., outright credit sales.Footnote 10 Clubs were also extensively used by local shops, multiple retailers, and other traders (such as coal merchants). The British retail Co-operative Movement, which accounted for about 10–11.5 percent of British retail sales in 1939, used clubs extensively; over 80 percent of the increase in their dry goods sales during 1929–1936 was attributed to mutuality (credit) clubs. These were particularly important for clothing (accounting for well over half of sales for a large proportion of societies).Footnote 11 Clubs served as savings vehicles for special occasions, such as holidays and Christmas. They were also used to cope with crisis periods of the family life cycle; for example, a 1913 survey of infant welfare centers found that many ran clothing clubs and maternity savings schemes for working-class mothers.Footnote 12
Estimating the overall importance of club credit to working-class household finances is problematic, owing to the fragmentary nature of available evidence. Small-scale contemporary studies suggest that clubs played an important role in working-class budgeting for clothing and footwear, particularly for poorer families.Footnote 13 A 1935 survey of 77 long-term unemployed families in London and Birmingham found that 22 percent bought their clothing via “clubs and tallymen,” the main alternative being secondhand clothing.Footnote 14 Conversely, the Pilgrim Trust found that the majority of unemployed families bought clothing via clubs.Footnote 15
The club system appears to have been free of any significant problem of bad debts. Mail order traders had negligible bad debts, while the Marks & Spencer variety store chain had bad debts of less than 0.1 percent on its club business.Footnote 16 Co-operative club bad debts were estimated at only 0.04 percent, as the societies had knowledge of their members' credit history and, if necessary, could recover debts from their shareholding.Footnote 17 Even clothing clubs, whose members included a disproportionate number of very poor families, appear to have avoided extensive bad debts; a former superintendent of a large clothing club stated that only around 2 percent of members failed to keep up payments, as the clubs made every endeavor to collect some amount, however small.Footnote 18 Operating costs were nevertheless high, mainly due to the costs of local agents. Commission payments to mail order club agents varied from around 10–25 percent, depending on the firm in question and whether the transactions involved deferred payments.Footnote 19 Meanwhile, the Co-operative movement estimated the cost of its mutuality clubs at around 5.8 percent of club turnover (in addition to normal retailing costs).Footnote 20
Clubs appear to have been particularly popular with working-class families. They avoided the stigma associated with other forms of credit, owing to their “associational” element (in common with friendly society and trade union saving schemes) and the fact that they combined credit with saving—indeed many families did not regard their use as going into debt. Interest rates were lower than for other forms of retail credit, as the 5 percent poundage fee was paid only at the end of the loan term. Using community-based part-time organizers also mitigated risks of long-term and growing indebtedness, associated with the higher pressure sales tactics often attributed to check trading and hire purchase agents.
Check Trading and Hire Purchase
Check traders provided vouchers on weekly installments, for use in a range of specified local shops. Customers paid a 5 percent poundage fee with their first installment, equivalent to an APR of 23.3 percent (though in practice the interest rate was lower—as customers often took 24–26 weeks to pay off an agreement that nominally ran for 20 weeks).Footnote 21 Check traders also received further income from retailers, as checks were redeemed from them at a discount to their face value. Paul Johnson estimated this at 10–15 percent, while Sean O'Connell and Chris Reid found it averaged as much as 16.5 percent for the largest check trader, Provident Clothing and Supply Co., and the “Our Towns” study gave 17.5 percent as a typical figure. Meanwhile, retailers also had to wait up to two months for payment.Footnote 22
Unlike clubs, which were often organized by community-based part-time agents, check traders used full-time canvassers/collectors. These also served an important role in managing risk, through screening potential customers and monitoring their indebtedness. Yet these services involved high costs; the “Our Towns” study claimed that canvassers took a 5 percent commission on new business and 8.3 percent for collecting installments. Shops were said to charge a higher markup to cover this commission, “so that the housewife for her 21s may get articles normally sold for 16s 6d or even less—a figure as low as 12s 6d has been mentioned.”Footnote 23 Again, there are no estimates of the annual volume of check credit, though this was clearly substantial; the largest check trader, Provident, loaned £18.1 million annually by 1939, with a customer base equivalent to just over 2 percent of the U.K. population, and agreements with 14,000 retailers.Footnote 24
Hire purchase (HP) was the dominant form of installment credit for more expensive durables with a substantial secondhand value. It differed from other forms of retail credit in that goods were technically “hired” until final payment was received and could thus be immediately repossessed following a missed payment. As with club and check credit, there are no robust estimates of the volume of HP credit. Trade sources suggest that by the late 1930s, it accounted for more than 70 percent of sales for cars and bicycles, working-class furniture, electrical household equipment, pianos, and sewing machines. A Board of Trade document put the annual value of consumer HP sales at around £100–120 million. Other forms of consumer credit were estimated at over £100 million, bringing the total value to £200–220 million, equivalent to around 7 percent of retail sales or 5 percent of total personal expenditure (though this appears to be no more than an educated guess).Footnote 25 As the main form of installment credit for expensive durable goods, its use could be expected to be particularly heavy at the new household formation stage of the family life cycle, when young couples faced the costs of furnishing their first house, or set of rooms.
HP interest rates were in excess of 25 percent in many cases (and, sometimes, considerably higher). However, “affordability” was maintained by extending repayment periods; for example, furniture HP contracts often ran for up to four years.Footnote 26 HP constituted a substantial and inflexible commitment of future income and thus made customers extremely vulnerable to poverty in the event of illness or unemployment —which was a significant risk over the lifetime of the loan.Footnote 27 The system was also rife with a number of notorious abuses, including excessive charges for “depreciation” on goods returned while under hire; contracts which exempted traders from any warrantee regarding the quality or functionality of the goods; and the “snatch-back” of items towards the end of a contract, if an installment was late by even a few hours.Footnote 28
As with club and check trading, bad debt ratios were relatively low (though much higher than for club credit). These were estimated by the Hire Purchase Traders' Association at less than 5 percent— while sales of reclaimed goods reduced losses to around 1 percent.Footnote 29 Yet retailers had high administration costs, for recording and monitoring cash payments, enquiries into the status of customers, taking up references, dealing with arrears, and particularly the employment of door to door collectors. However, while these mechanisms were less attractive in terms of interest costs than club credit, and carried much greater social stigma, they nevertheless became increasingly popular. HP credit expanded particularly rapidly (the estimated number of new contracts rising from two million in 1924 to seven million in 1936), as it provided working-class families with access to high value durables, on terms that were made “affordable” by extending payments over progressively longer terms (four-year contracts for furniture being common by the 1930s).Footnote 30
Contractual and Medical Expenditure
Working-class families also engaged extensively in various forms of insurance and savings. Chief amongst these was “industrial” life assurance (policies with weekly premiums, paid to door-to-door collectors). Benjamin Seebohm Rowntree found that, in contrast to other forms of savings, the proportion of income devoted to industrial insurance was highest among poor families.Footnote 31 This reflected the fact that industrial insurance was primarily a form of consumption, rather than income, smoothing. Funerals were expensive events, constituting major family-sponsored “festivals,” reflecting their status and esteem.Footnote 32
Estimates suggest that by the late 1930s, between 75 and 90 percent of working-class families had industrial insurance policies.Footnote 33 However these were notorious for their heavy administrative costs, which accounted for about 25 percent of premium income even for the largest provider, the Prudential, and over 40 percent for some smaller companies. Again, high costs mainly reflected the employment of door-to-door collectors—numbering some 65,000 by the late 1930s.Footnote 34 Many insurance agents also worked for check companies, offering both insurance and credit products to the same customers.Footnote 35
Working-class families were also investing increasing amounts in pensions, both via industrial insurance policies with an endowment element and pension schemes. From the late nineteenth century, the railway and gas companies had pioneered formal occupational pensions for manual workers and by 1936 these encompassed around 13 percent of the national workforce (though the proportion was lower for manual workers).Footnote 36 From 1925 most workers also faced compulsory pension contributions, with the extension of National Insurance to old age pensions (replacing the earlier noncontributory state scheme).
National insurance had been providing some compulsory state insurance against unemployment and illness from 1911, though the scope of benefits and extent of coverage was considerably widened during the interwar period. This compulsory provision led to a decline in the relative importance of trade union and friendly society insurance schemes for accidents, sickness, unemployment, and old age—though these continued to account for a significant proportion of working-class savings.Footnote 37 Working-class families also undertook significant insurance against the costs of hospitalization, via voluntary hospitals' collection and contributory schemes. During the interwar period, these hospitals, originally charitable institutions for the poor, increasingly served patients who paid for their care.Footnote 38 Schemes were originally workplace based, though after 1920 their scope widened and—particularly in Southern England—cover was often extended to the entire family for weekly payments of around 4–6d.Footnote 39 By 1938 the national membership of such schemes was substantially in excess of 12 million.Footnote 40
Just as the expansion in HP served rising demand for high value goods, working-class real wage growth (averaging 1.21 percent per annum over 1913–1938)Footnote 41 was reflected in increased demand for expenditure-smoothing vehicles for costly services such as non-pauper burials, medical care, and pensions. However, it is impossible to tell from conventional sources whether smoothing mechanisms such as HP and hospital care schemes were mainly confined to skilled workers' households or were a general feature of working-class budgeting; the extent to which their use substituted for, or coexisted with, more traditional credit devices such as clubs; and how reliance on them varied over the family life cycle.
A REDISCOVERED SOURCE
As shown above, conventional sources focus on the supply side of working-class expenditure smoothing—the various mechanisms available, the terms on which these were offered, and their interest rates, administrative expenses, and bad debt ratios. Conversely (with the partial exception of contractual savings), we have very little information on the demand side. There are no reliable estimates of the importance of retail credit in overall household budgeting, variations in credit use by income, patterns of use in relation to individual categories of expenditure, or the ways in which households combined the different credit and contractual savings mechanisms in their financial management strategies.
Contemporary accounts stress that working-class families employed a complex array of expenditure smoothing mechanisms: “Not only may sums be due to the moneylender, tallyman, clothing club, hire-purchase agent, etc., but also and at the same time to the insurance agent, Christmas club, hospital savings, and savings club.”Footnote 42 For example, in 1939 Mass Observation interviewed a relatively prosperous family comprising a retired father drawing a Post Office pension, a mother (presumably not in paid employment), and one son and four daughters, all in employment, with a weekly household income of around £7. All income was said to be passed to the housewife, from whom they received spending money (from which they undertook their own holiday savings). Each week 7s was deposited in a mills holiday savings club and 2s in another mills club; 6s in a Post Office savings account, 5s in a Co-op clothing club, and 1s (for the 20 weeks before the June holidays and the 20 weeks before Christmas) into a stores club to make up for broken weeks at holidays. Meanwhile, they paid 4s per week into various insurance policies, plus 7d into a “sick club” for their son, and payments to the Oddfellows for unemployment cover of 1d a week for the son and 4s 6d a quarter for the father.Footnote 43
Determining whether such accounts are typical of British working-class experience requires detailed, nationally based, household survey data. Fortunately—uniquely among pre-1945 British social surveys—the 1937/38 Ministry of Labour Working-Class Household Expenditure Survey provides such data. This was the largest pre-1945 household expenditure survey, providing a representative collection of budgets for U.K. households headed by manual workers and nonmanual workers with annual salaries under £250.Footnote 44 There were 10,762 sets of four weekly budgets collected at quarterly intervals, from October 1937. Households headed by people in long-term unemployment were excluded from the initial survey sample, though there was no further filtering of households during subsequent survey weeks (some were self-excluded owing to the non-return of survey forms).
Survey design and execution was supervised by an influential committee comprising relevant government departments, business and other organizations, and statisticians, who achieved a major methodological advance on earlier official and other British household budget investigations. Great care was taken to establish a random sample, which was representative of the population both in terms of geographical composition and household characteristics, while subsequent comparison of the returns against other data showed that this had been successful.Footnote 45 Participating households were asked to keep a contemporary record of all expenditure during four separate weeks (spaced at quarterly intervals) and enter the particulars on printed forms—volunteers being employed to explain the procedure to each household and to check their entries. The Second World War delayed analysis of the returns and no comprehensive survey report was published—though several early studies utilized the original data.Footnote 46
The budget returns were believed to have been destroyed, apart from 99 sets of budget summaries (each covering all four quarters) preserved at the National Archives.Footnote 47 The authors have discovered a further 524 sets of summaries, which were donated to a research project when the other records were destroyed and were eventually deposited in the University of Bangor Library Archives.Footnote 48 Of these schedules, twenty are missing information on income or geographical location, providing a usable sample of 603 households. The Bangor and National Archives records are both from the same one in ten sample of budget summaries, which originally comprised 977 sets of summaries (it appears that some of the Bangor sample budgets were lost before transfer to Bangor).Footnote 49 The surviving sample has broadly similar characteristics to the full survey, in terms of regional coverage, family size, and household expenditure (though households with expenditures of under 50s a week are overrepresented).Footnote 50
ANALYZING EXPENDITURE SMOOTHING
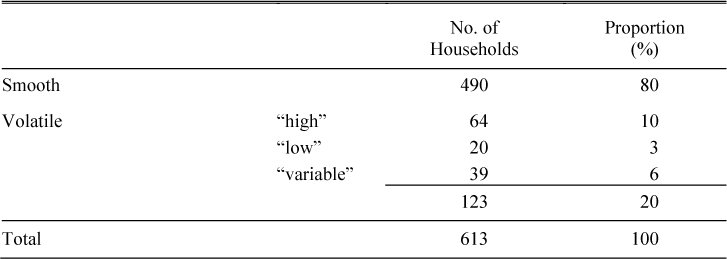
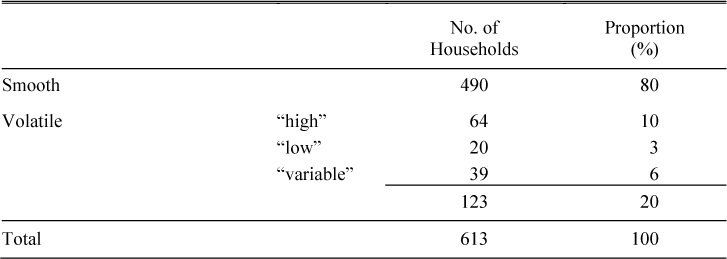
One important impact of expenditure smoothing was to increase the proportion of income that was already committed at the start of the week. Commitments are here defined as expenditures which households could not easily vary in the short term, either owing to contractual obligations or practicalities (such as the need to take a bus or train to a distant place of work). Before estimating the extent of committed expenditures, we first examined the volatility of household expenditure, to assess how smooth working-class household consumption actually was and how well the main categories of “lumpy” expenditure match to those areas where expenditure-smoothing mechanisms were common. We define household expenditure as “smooth” if it does not deviate by more than one quintile from the mean in any given quarter. This was chosen to capture expenditure variations that were of such magnitude that they could not be addressed via informal mechanisms, such as buying part of the week's food on credit. “Volatile” expenditures thus occur where expenditure in a given week is more than one quintile higher (or lower) than the mean expenditure. Table 1 shows that the vast majority of households, some 80 percent, were able to maintain smooth weekly expenditures over the four observation weeks according to this definition.
ESTIMATES OF THE STABILITY OF HOUSEHOLD EXPENDITURE
Notes:
“Smooth” being where expenditure remains within one quintile of mean expenditure; “high” (“low”) refers to instances where expenditure in a given quarter is one or more quintiles higher (lower) than the mean quarter's expenditure; and “variable” reflects instances where expenditure osculates between being “high” (“low”) then “low” (“high”), relative to the mean quarter's expenditure, in two or more quarters.
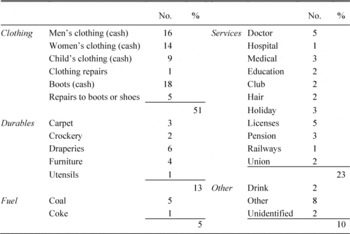
Distinguishing between “volatility” caused by above average expenditures in a single quarter, termed “high,” and situations where expenditure is below average in a given quarter, illustrates that “one-off” high expenditures are far more common than situations of unusually low or highly unpredictable expenditure patterns. We isolate the expenditures of those 64 families where there was a one off “high” expenditure (by more than one quintile from the mean). Unlike the “low” and the “residual” category, this can typically be pinned down to single, or a small number of, expenditure items. We then identify each individual expenditure category which is unusually high in the volatile quarter and has a significant value (50d or more), to show which items are most likely to be volatile and whether this is driven by single or multiple expenditure categories. Volatile items thus identify the main expenditure “shocks” arising from the absence, or failure, of expenditure smoothing. For example, one household had an average expenditure of 726d per week, but in survey week for the first quarter of 1938 spent 2,123d more than this. Examining the more than 90 nonfood expenditure categories included in the survey, we find that this higher expenditure was accounted for by four items—two categories of clothing (men's clothing, 900d; boots 951d), coal (270d), and union dues (102d); comprising a total of 2,223d.
ANALYSIS OF “HIGH” VOLATILE EXPENDITURES BY EXPENDITURE CATEGORY

Notes:
See the notes for Table 1.
Table 2 provides an analysis of “highly” volatile expenditures. We classify these into four broad groupings: clothing, durables, services, and fuel, plus a residual group made up of drink, and other/unidentified expenditures. We find that a relatively small number of items lead to volatility in expenditure—126 items of 50d or more for the 64 households, or around two items per household, and that these closely match the areas of expenditure covered by smoothing mechanisms. Clothing and footwear comprises 51 percent of these atypical items. These exclude purchases made via clothing clubs, which represent successful expenditure smoothing. Durables make up only 13 percent of lumpy expenditures—plausible because high ticket items such as furniture were occasional purchases, typically on HP. Services comprised a further 23 percent, the chief category being medical-related expenses.
The budget summaries disaggregate clothing and footwear expenditure into men's clothing; women's clothing and materials; children's clothing and materials; and boots and shoes (each category being subdivided into club and cash purchases), together with a further category: payments into clothing and footwear clubs. The budget summaries treated purchases as cash if it was not stated whether they were via cash or club; thus the data are likely to under-estimate the importance of clubs.Footnote 51 Unfortunately no similar breakdown is provided for other types of club payments. Christmas club payments were recorded under “other expenditure,” and “slate club” or “thrift club” payments—involving savings for general purposes through the club system—were omitted from the enquiry. Coal club payments were treated as coal expenditure.Footnote 52 Examining the extent to which weekly payments for such items involved regular sums over the four quarters allows us to estimate the value of most club/check payments. Similarly, small, regular, holiday expenditures can be taken as indicative of holiday club payments or other types of regular savings towards holidays.Footnote 53
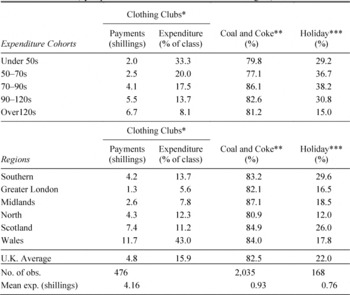
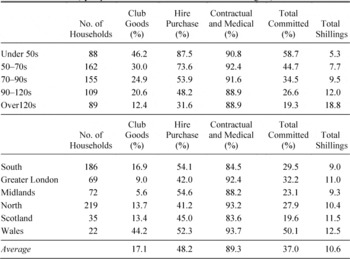
Table 3 examines committed (club) expenditure on clothing, fuel, and holidays, by level of household expenditure and U.K. 1980 Standard Economic Region. In this and Tables 4–5, the categories shown match those used in the budget summaries (with the exception of the aggregation of coal and coke expenditure). Clubs are estimated to account for over one-third of clothing and footwear expenditure for families with incomes under 50s and for a significant but declining proportion of expenditure for higher income groups (with a marked decline for families on over 120s per week). Regional data indicate no clear north-south divide—with relatively high rates of club use in the North but low levels in another traditional stronghold of club credit, the Midlands. Meanwhile, Greater London has particularly low rates, in contrast to the rest of southern England. The reliance on clubs for men's and children's clothing is greater for lower-income groups, in contrast to women's clothing—where the use of clubs broadly increases with income.
For items which are not disaggregated into committed and other expenditures in the survey, we adopt a strategy for identifying committed payments based on the fact that these occur regularly over the course of the year and are typically of similar amounts. Given that committed expenditure would be subject to a certain amount of variation in level, and to initiation, termination, or interruption over the survey period, we need to assess what constitutes a “regular” pattern of payments. We utilize two sources of information. The first involves the data on clothing club payments, which—by definition—constituted “committed expenditure.” Secondly, we utilize contemporary estimates for the furniture sector, which indicate that at least 65 percent of working-class furniture was purchased on HP during the 1930s.Footnote 54 Using the furniture and club payment variables, we experimented with incorporating regularity of payments (where payments are made in consecutive quarters) and variation in the amount paid. A lag of two quarters and coefficient of variation of 0.4 was found to account for 82 percent of the variation of club payments and 66.5 percent of furniture payments, thus providing a reasonable conservative estimate for the committed component of expenditures.
CLOTHING, FUEL, AND HOLIDAY EXPENDITURES (by expenditure cohort and standard economic region)

* Aggregates men's, women's, and children's clothing and footwear categories.
** Included if there are positive values for at least three of the four quarters and a coefficient of variation between quarters of 0.2 or below.
*** Holiday expenditure is taken to be committed where less the 100d is spent.
Notes:
For regional data, “South” includes the South East and South West; “Midlands” the East and West Midlands; “North” Yorkshire and Humberside, Northern and the North West. Regional data are weighted by regional populations using, Greater London – Royal Commission on the Distribution of the Industrial Population, Report (Cmd. 6153 of 1940); other regions, C. H. Lee, British Regional Employment Statistics, 1841–1971 (Cambridge, 1980). In this and subsequent tables, data for “average” or “mean” expenditure values include only those families registering some expenditure in the given category over the period of the survey.
In the case of coal and coke, which is likely to have been purchased more regularly than durable and semi-durable items, we adopt more stringent criteria—treating expenditure as committed only where there are positive values for at least three of the four quarters and a coefficient of variation between quarters of 0.2 or below. Even under those stringent criteria, coal clubs appear to be far more ubiquitous than clothing clubs, accounting for some 82.5 percent of expenditure on coal and coke. While coal clubs are mentioned in the literature, there is little evidence regarding their prevalence. Our finding—that they were one of the most widely used forms of expenditure smoothing—is plausible, given that there were considerable cost advantages in buying coal in bulk, rather than having smaller, more frequent, deliveries. The data on holiday clubs is more difficult to interpret, as four survey weeks do not adequately capture an activity highly clustered in the summer. However, as more than a quarter of families reported positive expenditures, these were clearly significant.
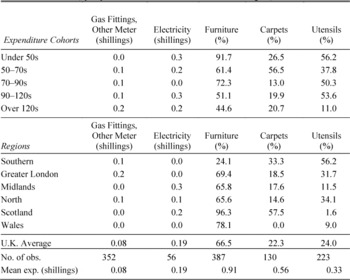
Hire purchases (HP) are only disaggregated for domestic appliances and fittings purchased from gas and electrical supply undertakings and included in their utility bills. Utility suppliers dominated the HP market for power-intensive labor-saving appliances such as cookers and wash-boilers, but had little role in marketing two other electrical appliances frequently purchased via HP—radios and vacuum cleaners. Hire purchase payments for other categories of goods were treated in the same way as purchases in the summaries and assigned to the appropriate expenditure group.Footnote 55 However, these can again be estimated by looking at the extent to which expenditure constituted small, regular payments. As Table 4 shows, using our conservative methodology, HP purchases are estimated to account for some 66.5 percent of furniture purchases, 22.3 percent of expenditure on carpets, and 24 percent on utensils. Carpets were not ideal for HP finance, as they had limited resale value. Meanwhile “utensils” included a large number of relatively inexpensive items, in addition to less frequent purchases of major household appliances.Footnote 56
HIRE PURCHASE (by expenditure cohort and standard economic region)

Notes:
Carpets include “Carpets, Floorcloth, Mats, &c.”; Utensils include “Other Utensils, Furnishings and Household Equipment.” Furniture, carpets, and utensils are included if there are positive values for at least two consecutive quarters and a coefficient of variation between quarters of 0.4 or below. Details on regional aggregation and sources are provided in Table 3.
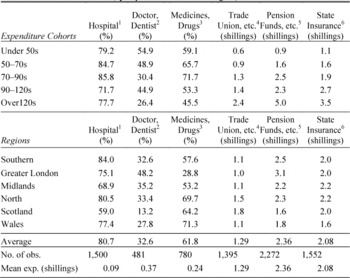
Table 5 examines contractual savings and medical-related costs. The largest categories of expenditure—trade union, friendly society, and burial club subscriptions; pension funds and insurance premiums; and National Health, pensions, and unemployment insurance contributions; are contractual by definition. However, the survey also reveals widespread use of regular payments to cover directly incurred medical costs. These account for 80.7 percent of payments to hospital funds, hospital fees, nursing home charges, etc.; 61.8 percent for medicines and surgical appliances; and 32.6 percent of payments to doctors and other medical staff, plus nursing fees. Extensive use of contributory and savings schemes for these items is again plausible, given their high and unpredictable costs.
CONTRACTUAL AND MEDICAL (by expenditure cohort and region)

Notes:
1. Hospital: “Payments to Hospital Funds, Hospital Fees, Nursing Home Charges &c.”; 2. Doctor, Dentist: “Doctor, Dentist, Nurse, Midwife, Optician, &c.”; 3. Medicines, Drugs: “Medicine, Drugs, &c., and Medical and Surgical Appliances (including Pharmaceutical Preparations).” Hospital, doctor and medical are included if there are positive values for at least two consecutive quarters and a coefficient of variation between quarters of 0.4 or below; 4. Trade Union, etc.: “Trade Union, Friendly Society, Burial Club, &c. subscriptions”; 5. Pension Funds, etc.:”Payments to Pension Funds, Insurance Premiums &c.”; 6. State Insurance, etc.: “Pension Insurance, National Health, and Unemployment Benefit, &c.”
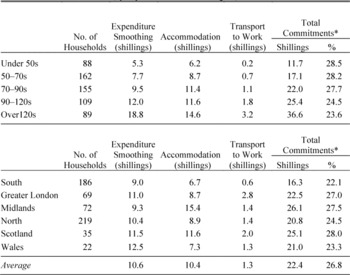
Table 6 examines the relative importance of smoothing mechanisms for the broad expenditure categories discussed above. Committed expenditure on clubs; HP; and on contractual savings, insurance, and medical expenses, is found to represent around 37 percent of aggregate expenditure under these three headings. Expenditure-smoothing mechanisms were particularly important for low-income families, accounting for almost 60 percent of aggregate expenditure on these items for households with incomes under 50s, but under 20 percent for families on over 120s. Lower-income families had greater need for consumption smoothing, as even items such as a new pair of shoes for a child could have constituted an expenditure shock. Meanwhile, families towards the top of the working-class income spectrum had greater scope for either meeting such expenditures from discretionary income, or from savings in more financially efficient, but less contractually disciplined, vehicles, such as savings bank or building society accounts.

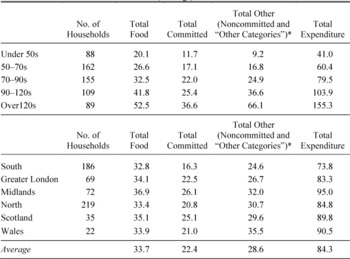
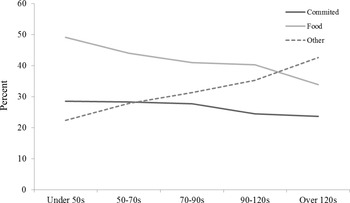
Tables 7 and 8 show the contribution of expenditure smoothing to total “committed” expenditure, by comparing such expenditure with the two categories of spending most commonly identified as committed in household studies—accommodation and travel to work costs. Expenditure-smoothing mechanisms are shown to account for 47.3 percent of total committed expenditures under these three headings. The tables also show the variation of committed, food, and other expenditure by income and region; the variation by income is also illustrated in Figure 1.
Total commitments, as a proportion of all household expenditure, decline from 28.5 percent for families with incomes under 50s per week to 23.6 percent for those with incomes above 120s. Thus, from an aggregate perspective, the increased utilization of expenditure smoothing by poorer households appears to have relatively little impact on overall household budgets. However, these had a major impact on that part of budgets which households could devote to durable and semi-durable goods and to contractual savings/insurance. After deducting expenditure on “basic needs” (proxied by accommodation, food, fuel and light), households on less than 50 shillings per week had only 29 percent of total expenditure left for clothing and all other costs, compared to 45 percent for households on 90–120 shillings and 54.1 percent for those on over 120 shillings.Footnote 57 Their greater reliance on expenditure-smoothing devices for many of these items, and the consequent increase in their costs, thus impacted on a section of their household budget which was already squeezed by the priorities of food, fuel, and shelter.

FOOD, COMMITTED, AND OTHER EXPENDITURE: BY EXPENDITURE COHORT AND REGION (shillings)

Note:
* “Other categories” refers to other expenditure items where expenditure smoothing does not occur, or cannot be identified. Definitions of the full set of 40 additional variables that constitute the category, and the data underlying this study, will be made available via the U.K. Data Archive.
LIFE CYCLE IMPACTS
The intensity with which expenditure-smoothing devices were used can also be expected to vary over the family life cycle. Rowntree famously identified a pronounced life cycle element to poverty, which was a particular risk during childhood, the early years of marriage, and old age. From the perspective of a household headed by person of working age, there were two major negative expenditure shocks. Setting up a new household, which was sometimes delayed until the birth of the first child, had a major impact on expenditure. An exhibition by the Council for Art and Industry, showing how a small home could be furnished cheaply, nevertheless proposed a budget of £50, for a two bedroom house. This was equivalent to almost three months' total expenditure for the average family in the Ministry of Labour survey, and markedly more for a typical “new household” family, with only the head of household in paid employment.Footnote 58 The arrival of children constituted further negative shocks, which typically peaked just before the oldest child entered employment.Footnote 59
BREAKDOWN OF EXPENDITURE BY COHORT

Unfortunately, the Ministry of Labour survey contains no information on the ages of adults, or their dates of marriage. However, it provides the ages of children under 14, together with the number aged 14–17.Footnote 60 For families with no child aged over 17, the age of the oldest child can be taken as a rough proxy for the time lapsed since the establishment of the household. Given the absence of age data for adults, the analysis is restricted to families with one male and one female adult (assumed to be a married couple). Households composed only of adults are also problematic, as these might represent newly established households, “empty nest” households, or adults who were never to have children, and so are excluded from the main analysis (though their expenditures are included in Table 9, for reference). This prohibits analysis of households towards the end of the family life cycle—though, as the survey was restricted to households headed by people of working age, the full life cycle distribution was never captured.
HOUSEHOLD CONSUMPTION SMOOTHING FOR “YOUNG FAMILIES,” FAMILIES WITH A DEPENDENT CHILD, AND FAMILIES WITH A WORKING-AGE CHILD (pence per household member)

Notes:
The analysis is restricted to families with one child, or those with no children. “Clothing Club” comprises men's, women's, and children's clothing clubs and boots clubs. Hire purchase combines hire purchases on furniture, carpets, and utensils. Prais and Houthakker's (Analysis of Family Budgets, p. 141, table 29) adult male equivalence scale is as follows: Male 14–17, 0.81; Female 14–17, 0.65; children aged 10–13, 0.71; aged 5–9, 0.57; aged 1–4, 0.52; aged < 1, 0.35.
Source:
See the text.
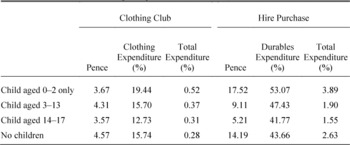
Table 9 examines life cycle patterns for two major forms of expenditure smoothing, clothing clubs, and HP. Coal clubs were excluded as their use was found to be ubiquitous, while contractual payments largely concern insurance against the direct costs of illness or death, risks which were strongly and directly linked to the number and ages of children. We show the expenditures of households with one child, for “newly formed” households (with a child under the age of 3); those with a child aged between 3 and 13; and those with an adolescent of working age. Given younger families have, on average, lower incomes, we provide information on expenditures relative to all purchases in the category and as a proportion of total expenditure. To capture the positive relationship between children's ages and their maintenance costs, we utilize an adult male equivalence scale, derived from the Ministry of Labour survey by Prais and Houthakker.Footnote 61 This was designed to capture age-specific changes only in food consumption, but does provide some proxy for the variation in child maintenance costs by age.
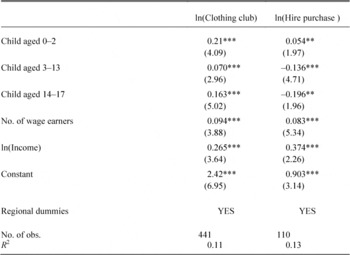
“New” households, with a child aged under 3, are shown to make greater use of clothing clubs and HP, supporting the hypothesis that the incidence of expenditure smoothing is higher for households facing heavy life cycle-specific expenditures (in addition to those with low incomes, discussed earlier). Households with a child aged 3–13 also make greater use of these than families with a working-age child, though the difference is much less marked. To examine lifestyle effects more rigorously, we undertake regression analysis of household clothing club and HP expenditure, using the same age cohort variables (0–2, 3–13, and 14–17). We also control for the number of wage earners per household, for regional differences, and as is typical in the literature, we utilize total expenditure as a proxy for income.Footnote 62
The estimates, summarized in Table 10, are derived using OLS. Income and the number of wage earners are shown to be positively related to expenditure on both clothing clubs and HP. Regional dummies (unreported) are jointly significant at the 0.01 percent level. Since both the estimations are in log-log form, the coefficients can be interpreted as elasticities. The results are qualitatively similar to the descriptive findings: relative to households without children, clothing clubs are 21 percent more extensively used by recently formed households, falling to 7 percent for those with a 3–13 year old child and 16 percent higher for those with a working-age adolescent. Higher clothing club expenditure for families with 14–17 year olds than with younger children (after accounting for income differences) may reflect the costs of clothing required for juveniles to enter paid employment. Family formation also has a significant impact on the use of HP, which is 5.4 percent higher than in the childless reference group. There is no statistically significant influence for those with a child between 3 and 13 years of age, while families with adolescents spend less than childless families.
Our principal finding, that newly formed households were much more likely to encounter expenditure crises than those whose oldest child was approaching school leaving age, is again plausible. Establishing a new household involved costs which were both particularly heavy and were tightly clustered at the time of household formation. HP payments could stretch these over several years, though this would have knock on effects on the family's ability to meet other lumpy expenditures—such as clothing—from current income. Older children incurred greater costs, but the family's lumpy expenditures would not normally be clustered at one time to anywhere near the same extent as when setting up a household.
DETERMINANTS OF EXPENDITURE ON CLOTHING CLUBS AND HIRE PURCHASE

* = Significance at the 10 percent level.
** = Significance at the 5 percent level.
*** = Significance at the 1 percent level.
Notes:
Results are robust to heteroskedasticity. Standard Economic Regions are East Anglia, East Midlands, Greater London, North, North West, Scotland, South East, South West, Wales, West Midlands, and Yorkshire.
CONCLUSIONS
Working-class households are shown to have made extensive use of mechanisms for smoothing “bulky” expenditures, which assumed greater prominence in their financial planning than income-smoothing mechanisms to insure against financial hardship during spells of illness, unemployment, or old age. Their contribution to total expenditure on particular goods and services is shown to be highest for high ticket items, such as furniture; insurance against potentially heavy expenditure liabilities (such as the costs of medical care); and goods where there were clear advantages from purchasing in bulk, such as coal. For less expensive items, such as clothing and footwear, there was a strong inverse relationship between household income and the proportion of relevant expenditure financed by these devices. An inverse relationship between income and expenditure smoothing was also evident for household durables.
Expenditure smoothing focused on items which made up only a small proportion of average household budgets: the Ministry of Labour survey showed that clothing and footwear averaged 9.2 percent of aggregate expenditure, coal and coke 3.8 percent, and furniture, carpets and utensils only 2.8 percent.Footnote 63 However, these (together with the services that contractual savings/insurance vehicles were used to finance) accounted for most of the volatility in household expenditure and, therefore, posed the greatest threats to budgets which were fully deployed each week. Reliance on such mechanisms is also shown to be strongly related to the household life cycle, particularly the costs associated with new household formation, which represented the most important expenditure (rather than income) “crisis” over the lifetime of the typical working-class household.
Consumption-smoothing mechanisms were inefficient, in as much as they incurred high interest rates, reflecting heavy administrative costs. Club and check credit “poundage” payments were equivalent to an APR of around 23 percent, typical HP interest rates were 25 percent or more, while administrative costs for burial insurance were also equivalent to at least 25 percent of premium income. Meanwhile, true interest costs were greater, as prices for goods on HP and checks were said to be often substantially higher than for equivalent goods sold for cash (the evidence for clubs is less conclusive). High interest costs were inevitable; postwar lenders in the United States and France also found that the inflexibility of administrative costs with respect to the size of the loan made consumer credit unprofitable except at such rates.Footnote 64 Yet for poorer families, inflating the costs of durables and semi-durables by 25 percent or more had a significant impact on quantities purchased, given that food and rental costs already tightly constrained available budgets for these items.
Expenditure smoothing thus substituted the constraint on consumption imposed by the lumpiness of expenditure with the weaker, but substantial, constraint of higher effective prices. Substantial commitments relating to earlier purchases would further limit “discretionary” expenditure in any given week. Meanwhile, interruptions in earnings could often threaten both current consumption and accumulated “investment” in ongoing club/check, HP, and insurance payments. Such problems remain a reality for many families with very low incomes and/or poor credit histories. Mail order catalogue companies, “Christmas club” firms, specialist credit retailers, and doorstep lenders, still flourish by serving a market where households with poor access to credit are prepared to pay high interest rates in return for “affordable” weekly payments.