I. INTRODUCTION
Material flow behaviors during hot deformation are often very complex, and the control of microstructure is of great importance to optimize the final mechanical properties of the products.Reference Lin and Chen1 It is well known that work hardening, dynamic recovery (DRV), and dynamic recrystallization (DRX) often occur in the metals and alloys with low stacking fault energy during hot deformation.Reference Zhang, Zhang, Lu, Zhao and Yang2,Reference Momeni, Kazemi and Bahrani3 Among them, DRX can lead to grain refinement and the decrease of deformation resistance during hot deformation, which is beneficial to obtaining fine grains and improving the mechanical properties of the products.Reference Lin, Chen and Zhong4,Reference Mandal, Bhaduri and Sarma5 In addition, DRX is a kind of dynamic softening mechanism, which can produce new grains with high angle grain boundaries (HAGBs). The presence of a large fraction of HAGBs is advantageous, because these boundaries can contribute to the strength and toughness of the products.Reference Zhang, Zhang, Jiang, Zhou, Zhao and Yang6 Meanwhile, DRX is significantly affected by the deformation parameters, such as deformation temperature, strain, and strain rate. Ebrahimi et al.Reference Ebrahimi, Keshmiri, Momeni and Mazinani7 studied the DRX behavior of a stainless steel and proposed that the increasing temperature or decreasing strain rate can lower the driving force for DRX. Fatemi-Varzaneh et al.Reference Fatemi-Varzaneh, Zarei-Hanzaki and Beladi8 studied the effects of temperature and strain rate on the microstructure evolution of AZ31 alloy and found that the amount and size of DRX grains increased as Zener–Hollomon parameter decreased. Poelt et al.Reference Poelt, Sommitsch, Mitsche and Walter9 investigated the DRX behavior of Alloy 80A and observed that the strain had an important effect on the DRX evolution of the alloy. As mentioned above, a given combination of deformation parameters can determine the final microstructures and properties of the products. Therefore, understanding of the relationship between deformation parameters and DRX behavior in metals and alloys is of great importance for the better control of microstructure during hot deformation.
Ni–18.3Cr–6.4Co–5.9W–4Mo–2.19Al–1.16Ti superalloy is a kind of γ′-hardened superalloy with low stacking fault energy, which has been widely used in combustion systems, gas turbines, and other related high temperature applications due to its excellent high-temperature strength, creep resistance, and corrosion resistance. In particular, the highest service temperature of the alloy can reach about 1000 °C. The alloy is kind of wrought alloy, and it contains many alloying elements. For example, the elements Ti and Al are very important for the mechanical properties of the alloy, due to the fact that they can make a great contribution to form the main strengthening phase (γ′ phase). Furthermore, W, Mo, and Co are used as solution strengthening elements, and B, Ce, and Mg are used as grain boundary strengthening elements.Reference Zhang, Zhang, Lu, Zhao and Yang2 Better control of the DRX behavior is of great importance for the alloy to obtain a superior performance.Reference Sun, Liu and Yang10,Reference Seyed Salehi and Serajzadeh11 However, it is more difficult to get DRX organization due to the increase of DRX temperature with increasing strengthening elements.Reference Mitchell, Preuss, Hardy and Tin12 Thus, it is significant to investigate the DRX evolution and kinetics of the alloy for better control of the DRX behavior during hot deformation.
There are two main nucleation mechanisms of DRX in the nickel-based superalloys, i.e., discontinuous DRX (DDRX) and continuous DRX (CDRX).Reference Belyakov, Tsuzaki, Miura and Sakai13,Reference McQueen14 In general, DDRX is relevant with a bulging mechanism operating in the materials with low or medium stacking fault energy, which involves the nucleation of new grains and subsequent grain growth. CDRX is considered as a recovery process and proceeds by continuous absorption of dislocations in subgrain boundaries, which will result in the formation of high angle boundaries and new grains.Reference Gourdet and Montheillet15 Moreover, it is widely known that CDRX and DDRX can occur simultaneously in superalloys.Reference Guo, Li, Guo, Peng and Hu16 Guo et al.Reference Guo, Li, Guo, Peng and Hu16 proposed that DDRX is the primary mechanism of DRX, while CDRX can only be considered as an assistant mechanism at the early deformation stage at higher deformation temperatures for superalloy 625. Wang et al.Reference Wang, Shao, Zhen and Zhang17 found that the different nucleation mechanisms of DRX are closely related to deformation parameters in superalloy 718.
In this study, the DRX evolution of Ni–18.3Cr–6.4Co–5.9W–4Mo–2.19Al–1.16Ti superalloy is studied in a wide range of deformation temperature and strain rate, and the nucleation mechanisms of DRX during hot deformation are discussed. Based on the experimental results, the DRX kinetics equations for the studied alloy are developed to describe the DRX evolution during hot deformation in an initially solution annealed state. The validity of the established DRX kinetics equations is confirmed by microstructure observation.
II. EXPERIMENTAL PROCEDURES
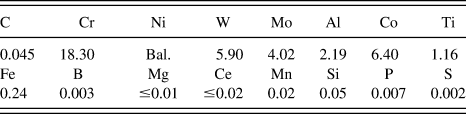
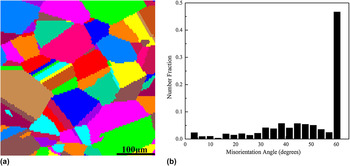
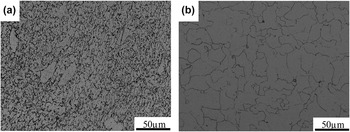
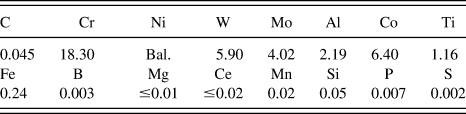
Table I lists the chemical composition (wt%) of the studied alloy. Cylindrical specimens of 8 mm in diameter and 12 mm in height were machined from a cylindrical forging bar with a diameter of 32 mm. Before compression tests, the specimens were solution treated at 1100 °C for 30 min, and then air-cooled to room temperature. In the authors' previous publication,Reference Zhang, Zhang, Jiang, Zhou, Zhao and Yang6 it was found that a high amount of small γ′ phase was formed in the cooling process in air. Figure 1(a) shows the microstructure of the specimen after solution treatment, which is composed of equiaxed grains and a few annealing twins. Figure 1(b) shows the distribution of misorientation angles, and it can be found that the majority of the grain boundaries are HAGBs with misorientation angles larger than 15°.
The chemical composition of the alloy (wt%).
The unique grain color map of the alloy after solution treatment (a) and the misorientation angle map (b).

The isothermal compression tests were carried out on a Gleeble-1500D thermomechanical simulator in the temperature range of 1010–1160 °C and strain rate range of 0.001–1 s−1. All the specimens were heated and held for 3 min at the deformation temperature, which was controlled to ±2 °C. During compression tests, the load–stroke curves were converted into true stress–true strain curves using standard equations. After isothermal compression, the deformed specimens were quenched to room temperature immediately by water. The specimens for microstructure observation were sectioned parallel to the compression axis, and microstructure examination was conducted with an Olympus-PMG3 optical microscope (OM). The Electron Backscattered Diffraction (EBSD) measurements were performed using a TSL system attached to a Quanta 200FEG scanning electron microscope. The samples for EBSD investigation were electropolished with a solution of 10% perchloric acid in ethanol at 20–30 V for 30 s at room temperature. The foils for transmission electron microscope (TEM) examination were prepared by hand grinding to a thickness of 70 μm and then thinned using twin-jet electropolishing with a solution of 10% perchloric acid in ethanol. TEM examination was conducted with a Tecnai G2 F30 microscope operated at 300 kV.
III. RESULTS AND DISCUSSION
A. Flow behavior
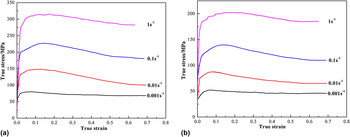
The typical true stress–true strain curves of the alloy obtained at 1060 and 1160 °C are presented in Fig. 2. Typically, the flow stress curves exhibit similar features, i.e., an obvious work-hardening stage at the strain less than 0.2, followed by a flow softening stage and then sometimes a steady stage at high strain zone. Such flow behaviors are consistent with the previous results for nickel-based superalloys with low stacking fault energy, indicating the occurrence of DRX during hot deformation.Reference Guo, Li and Guo18
True stress–true strain curves of the alloy obtained at different deformation temperatures: (a) 1060 °C and (b) 1160 °C.

In the work-hardening stage, the dislocation density continually increases and dislocations rapidly accumulate, resulting in the rapid increase of flow stress.Reference Cai, Xiong, Liu, Sun and Yao19 In the softening stage, the effect of work hardening can be partially neutralized by the occurrence of dynamic softening mechanisms, such as DRV and DRX,Reference Li and Wang20 which can lead to the decrease of flow stress. In the steady stage, the flow stress is constant due to the dynamic balance between the work hardening and dynamic softening.
B. Effect of strain on dynamic recrystallization
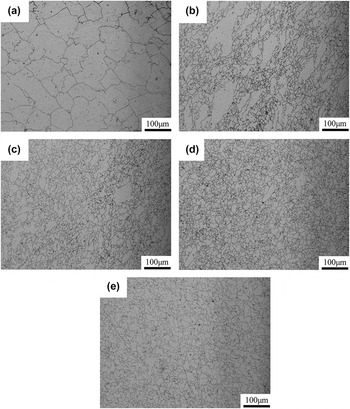
Figure 3 shows the microstructure evolution of the alloy deformed to various true strains ranging from 0.1 to 0.9 at 1160 °C with a strain rate of 0.1 s−1. It can be found that at a strain of 0.1, the grain boundaries become serrated and bulged, indicating the initiation of DRX owing to the strain-induced boundary migration,Reference Rollett, Humphreys, Rohrer and Hatherly21 as shown in Fig. 3(a). Moreover, almost no newly formed DRX grains can be observed at the primary grain boundaries and the triple junctions, indicating that the thermal energy and strain at this stage are not sufficient to promote DRX. However, once the deformation degree is larger than the critical strain, the nucleation and growth of DRX grains will take place near the grain boundaries, twin boundaries, as well as the deformation bands.Reference Chen, Lin, Wen, Zhang and He22 At a strain of 0.3, a lot of small DRX grains are formed along the deformed grain boundaries and form the necklace structures, as shown in Fig. 3(b). With increasing strain, the initial large grains gradually disappear and more DRX grains are formed, as shown in Figs. 3(c) and 3(d). As the strain increases to 0.7, almost all the original grains have been replaced by the DRX grains. At a strain of 0.9, the specimen has been fully recrystallized, as shown in Fig. 3(e). It is seen that the microstructure is composed of uniform and fine DRX grains, which is propitious to the properties of the products. Additionally, the DRX grain size remains almost constant with increasing strain, which is in good agreement with the previous reports based on the necklace mechanism.Reference Rollett, Humphreys, Rohrer and Hatherly21
The DRX evolution of the alloy at 1160 °C and 0.1 s−1 with various true strains: (a) 0.1, (b) 0.3, (c) 0.5, (d) 0.7, and (e) 0.9.

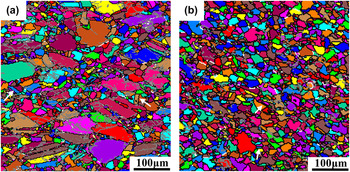
More detailed information about the nucleation mechanisms of DRX for the alloy during hot deformation can be obtained from the orientation imaging microscopy (OIM) maps, which utilizes rapid, direct measurements of local lattice orientation on a grid of points fixed upon flat surfaces sectioned from polycrystals.Reference Adams23Figure 4 shows the OIM maps of the alloy deformed to true strains of 0.3 and 0.7 at 1160 °C with a strain rate of 0.1 s−1, in which HAGBs and low angle boundaries (LAGBs) with misorientation angles lower than 10° are represented by black lines and gray lines, respectively. Furthermore, the grain boundaries with misorientation angles between 10° and 15° are represented by white lines, which are defined as medium angle boundaries (MAGBs) here. At a true strain of 0.3, the typical characteristics of CDRX can be observed, such as a large number of subgrains with LAGBs and some individual HAGBs in the interiors of grains. Meanwhile, the serrated and bulging grain boundaries can also be observed, along which lots of DRX grains with HAGBs are formed, suggesting the occurrence of DDRX. Jia et al.Reference Jia, Zhang and Lu24 have reported that when the dislocation density beyond the absorption capacity of grain boundaries, dislocations will pile up and a local stress concentration form, which results in the serrated grain boundaries. When the strain increases to 0.7, the amount of subgrains with LAGBs seems to be smaller, as shown in Fig. 4(b). Moreover, it is found that twins are formed in the deformed microstructure, as shown in Figs. 4(a) and 4(b) marked by arrows. As we know, twinning can play an important role in improving the process of DRX.Reference Gottstein25 The nucleation of twins is mainly caused by the higher mobility of grain boundary, which occurred through the dissociation of an initial migrating grain boundary into an immobile coherent twin part, mobile incoherent twin segment, and a low angle boundary.Reference Mahajan, Pande, Imam and Rath26 Furthermore, the twins can also accelerate the bulging and separation of bulged parts from original grains.Reference Wang, Shao, Zhen, Yang and Zhang27
OIM maps of the alloy deformed to true strains of 0.3 and 0.7 at 1160 °C with a strain rate of 0.1 s−1.

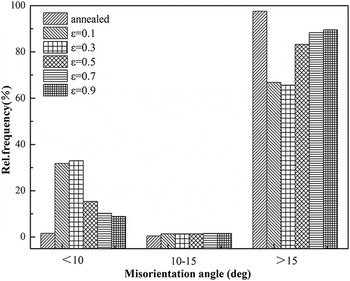
Figure 5 shows the relative frequency of different misorientation angles for the alloy deformed to different strains at 1160 °C with a strain rate of 0.1 s−1. It can be found that the fraction of LAGBs is relatively low in the annealed specimen. However, at the early stage of deformation, the fraction of LAGBs increases sharply due to dislocation generation and the dissociation of the original HAGBs, most of which occur in the vicinity of original grain boundaries and twin boundaries.Reference Li, Guo, Guo, Peng and Wu28 With further deformation, the fraction of LAGBs decreases gradually by transforming into HAGBs to eliminate the stored energy. Moreover, the fraction of MAGBs increases from 0.9% to 1.4% with the strain increasing to 0.1, but does not change significantly at larger strain. As we know, the increase of MAGBs is believed to be necessary for the nucleation of CDRX.Reference Ponge and Gottstein29 Therefore, the effect of CDRX strengthens rapidly at the early stage of hot deformation, which can lead to the formation of nuclei in the subgrain structures.
Relative frequency of different misorientation angles for the alloy deformed to different strains at 1160 °C with a strain rate of 0.1 s−1.

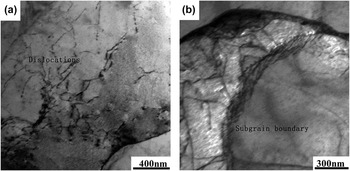
TEM observation was carried out to have a clearer insight into the mechanism of CDRX at the early stage of hot deformation. TEM micrographs of the alloy deformed to a true strain of 0.3 at 1160 °C and 0.1 s−1 are shown in Fig. 6. A lot of dislocations near the grain boundary can be clearly seen in Fig. 6(a). Meanwhile, the piled up dislocations rearranged in the vicinity of grain boundaries and formed low angle subgrain boundaries, which can reduce the stress concentration. Subsequently, subgrain boundaries constantly absorb dislocations in the interior of grains, which can transform into HAGBs of new grains, as shown in Fig. 6(b). Therefore, the process of CDRX includes three stages: the accumulation and rearrangement of dislocations, the formation of subgrain boundary, and the conversion to HAGBs from subgrain boundary, which is consistent with the results of previous study.Reference Jia, Zhang and Lu24
TEM micrographs of the alloy deformed to a true strain of 0.3 at 1160 °C and 0.1 s−1.

C. Effect of deformation temperature on dynamic recrystallization
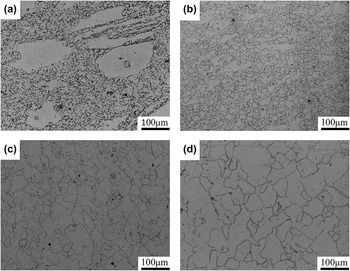
Figure 7 shows the microstructure evolution of the alloy deformed at different deformation temperatures with a strain rate of 0.001 s−1 and a true strain of 0.7. Obviously, the microstructure evolution is closely related to deformation temperature. It can be found that the volume fraction of DRX grains increased with the increase of deformation temperature, indicating that the DRX behavior occurred easily at the higher deformation temperature. Such phenomenon is related to the lower driving force and higher mobility of grain boundaries at the higher deformation temperature.Reference Imbert and McQueen30 On the other hand, the condition for the occurrence of DRX is thought to be dependent on the distribution and density of dislocations. The increase of deformation temperature would lead to the decrease of critical dislocation density and thus lower the critical strain for the occurrence of DRX. Moreover, it can be found that the DRX grain size increases with increasing deformation temperature, which is mainly related to the higher mobility of DRX grain boundaries at the higher deformation temperature.Reference Li, Guo, Guo, Peng and Wu28 Meanwhile, the dissolution of γ′ phase can also lead to the grain growth at the higher deformation temperature. It should be mentioned that a high amount of γ′ phase begins to be dissolved at 1080 °C in the alloy.Reference Zhang, Zhang, Lu, Zhao and Yang2 As shown in Figs. 7(c) and 7(d), the grain growth is more obvious when the deformation temperature is above 1080 °C.
The DRX evolution of the alloy at a true strain of 0.7 and 0.001 s−1 with various deformation temperatures: (a) 1010 °C, (b) 1060 °C, (c) 1110 °C, and (d) 1160 °C.

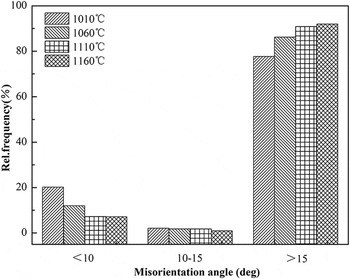
To investigate the effect of deformation temperature on the orientations of grains and subgrains, the specimens deformed at different deformation temperatures were analyzed by an EBSD technique. Figure 8 shows the relative frequency of different misorientation angles for the alloy deformed to a true strain of 0.7 at different deformation temperatures with a strain rate of 0.001 s−1. It can be found that the fraction of HAGBs increases with increasing deformation temperature, and the fraction of LAGBs decreases with increasing deformation temperature. It is well known that MAGBs are considered as the transition zone from low angle to high angle boundaries.Reference Rollett, Humphreys, Rohrer and Hatherly21 As shown in Fig. 8, the fraction of MAGBs decreases gradually with increasing deformation temperature, indicating the rapider migration rate from low angle to high angle boundaries at the higher deformation temperature. Hence, the variations of HAGBs and LAGBs with deformation temperature are mainly caused by the rapider transformation from LAGBs to HAGBs at the higher deformation temperature. As mentioned above, the large fraction of LAGBs is necessary for the occurrence of CDRX. Hence, the lower fraction of LAGBs at the higher deformation temperature will weaken the effect of CDRX.
Relative frequency of different misorientation angles for the alloy deformed to a true strain of 0.7 at different deformation temperatures with a strain rate of 0.001 s−1.

D. Effect of strain rate on dynamic recrystallization
Figure 9 shows the microstructure evolution of the alloy deformed at 1160 °C/1 s−1 and 1160 °C/0.01 s−1 with a true strain of 0.7. Comparing Figs. 3(d) and 7(d), it can be found that the DRX process is controlled by the strain rate. In other words, the volume fraction and size of DRX grains are strongly influenced by the strain rate. The volume fraction and size of DRX grains increase with decreasing strain rate. Such phenomenon is mainly because that there is enough time for energy accumulation to reduce the driving force under the lower strain rate, which can promote the DRX process. On the other hand, DRX is considered to be driven by the potential of distortion stored inside the alloys during deformation.Reference Guo, Li, Peng, Guo, Hu and Du31 Hence, there is enough time for the full diffusion of the alloy atoms under the lower strain rate, resulting in the release of sufficient potentials of distortion to stimulate the nucleation of DRX process.
The DRX evolution of the alloy at a true strain of 0.7 and 1160 °C with various strain rates: (a) 1 s−1 and (b) 0.01 s−1.

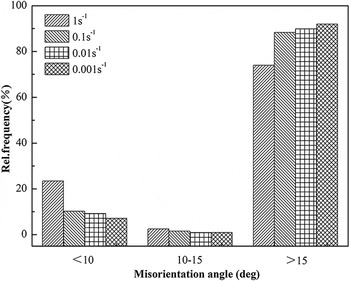
Figure 10 shows the relative frequency of different misorientation angles for the alloy deformed to a true strain of 0.7 at 1160 °C with different strain rates. It can be found that the fraction of LAGBs increases with the increasing strain rate, indicating that the dissociations of the original HAGBs and the generations of dislocations are more effective at the higher strain rates. Meanwhile, such a trend implies that the effect of CDRX is gradually strengthened with increasing strain rate. The fraction of MAGBs increases gradually with increasing strain rate, indicating that the lower strain rate is in favor of the transition from low angle to high angle boundaries.
Relative frequency of different misorientation angles for the alloy deformed to a true strain of 0.7 at 1160 °C with different strain rates.

In addition, the combined effects of deformation temperature and strain rate on the DRX grain size can be characterized by Zener–Hollomon parameter (Z), which can be expressed as,Reference Balasubrahmanyam and Prasad32
 $$Z = \dot \varepsilon \exp ({Q \mathord{\left/ {\vphantom {Q {RT}}} \right. \kern-\nulldelimiterspace} {RT}})\quad {\rm{,}}$$
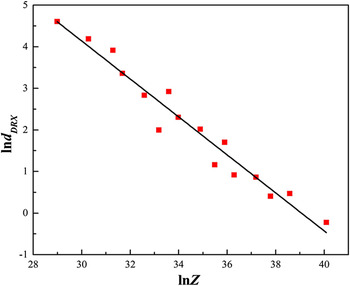
where  $\dot \varepsilon$ is the strain rate (s−1), R is the gas constant, T is the absolute temperature (K), and Q is the activation energy of the alloy during hot deformation (J/mol), which has been estimated as 427,626 J/mol in authors' previous publication.Reference Zhang, Zhang, Lu, Zhao and Yang2 The plot of the DRX grain size versus Z parameter is shown in Fig. 11, and their relationship can be represented as:
 $${d_{{\rm{DRX}}}} = 5.5 \times {10^7}{Z^{ - 0.46}}\quad {\rm{.}}$$
Relationship between lnd DRX and lnZ.

In Eq. (2), d DRX is the DRX grain size, which can be determined accurately by using the software of TSL OIM analysis.
E. Conventional DRX kinetics model
Usually, the DRX kinetics can be described by the following exponent-type equation,Reference Lin, Chen, Wen and Chen33
 $${X_{{\rm{DRX}}}} = 1 - \exp \left[ { - {K_{\rm{d}}}{{\left( {{{\varepsilon - {\varepsilon _{\rm{c}}}} \over {{\varepsilon _{\rm{p}}}}}} \right)}^{{n_{\rm{d}}}}}} \right]{\rm{\ }}\left( {\varepsilon \ge {\varepsilon _{\rm{c}}}} \right)\quad {\rm{,}}$$
where X DRX is the volume fraction of DRX grains. εc is the critical strain for the initiation of DRX, and εp is the peak strain. K d and n d are the material constants. There are two characteristic strains (εc and εp) and two material constants (K d and n d) to be determined in Eq. (3), which will be calculated based on the experimental stress–strain data in the following sections.
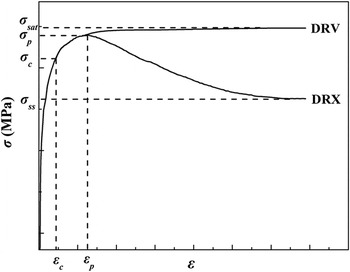
In the authors' previous publication,Reference Zhang, Zhang, Lu, Zhao and Yang2 DRV and DRX are the main dynamic softening mechanisms during hot deformation for the alloy, which can occur simultaneously. As shown in Fig. 12, the curve marked with ‘DRV’ assumes that DRV is the main softening mechanism and DRX is unavailable to take place. It can be found that the flow stress increases with increasing strain and finally reaches a saturation stress (σsat) due to the dynamic balance between the DRV and work hardening. Meanwhile, the curve marked with ‘DRX’ assumes that DRX is the dominant softening mechanism and DRV is weak. It can be seen that the flow stress drops gradually once the deformation degree exceeds the peak strain (εp) and finally reaches a steady stress (σss) due to the dynamic balance between the working hardening and dynamic softening (including DRV and DRX). In addition, it should be noted that DRX will take place as the deformation degree exceeds the critical strain (εc).
Sketch map of flow stress–strain curves.

Laasraoui and JonasReference Laasraoui and Jonas34 pointed out that when DRX is the main softening mechanism during hot deformation, the flow stress can be expressed as:
 $$\sigma = {\sigma _{{\rm{rec}}}} - \left( {{\sigma _{{\rm{sat}}}} - {\sigma _{{\rm{ss}}}}} \right){X_{{\rm{DRX}}}}\left( {\varepsilon \ge {\varepsilon _{\rm{c}}}} \right)\quad {\rm{,}}$$
where σrec is the flow stress when DRV is the main softening mechanism during hot deformation. σsat and σss are the saturation stress and steady stress, respectively. Hence, the expression of X DRX can also be represented as:
 $${X_{{\rm{DRX}}}} = {{{\sigma _{{\rm{rec}}}} - \sigma } \over {{\sigma _{{\rm{sat}}}} - {\sigma _{{\rm{ss}}}}}}\left( {\varepsilon \ge {\varepsilon _{\rm{c}}}} \right)\quad {\rm{.}}$$
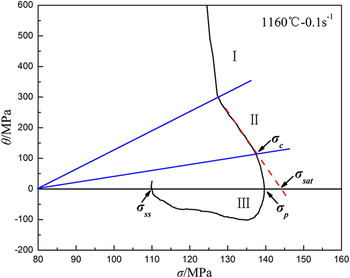
In Eq. (5), there are three characteristic stresses (σrec, σsat and σss) to be determined. It is well known that the critical stress (σc), peak stress (σp), saturation stress (σsat), and steady stress (σss) can be obtained from the work hardening rate (dθ = dσ/dε) versus the flow stress (σ) curves, which can also reflect the microstructure evolution during hot deformation.Reference Lin, Chen, Wen and Chen33 The θ–σ curve of the alloy at 1160 °C and 0.1 s−1 is plotted based on the flow stress–strain data, as shown in Fig. 13. Obviously, there are three stages in the θ–σ curve, i.e., two approximately linear stages (I and II) and one curvilinear stage (III). The value of θ decreases linearly at a high speed in stage I, which corresponds to the deformation stage from the beginning of hot deformation to the onset of subgrain formation. The subgrain formation can lower the increment speed of softening rate induced by DRV,Reference Chen, Lin and Ma35 which lead to the decreasing slope of the θ–σ curve. Hence, the θ–σ curve enters the second approximately linear stage. In stage II, the value of θ linearly decreases at a lower speed toward an inflection point of the curve, which is known as the critical stress (σc) for the onset of DRX. In other words, stage II corresponds to the deformation stage from the onset of subgrain formation to the onset of DRX. In addition, stage III corresponds to the deformation stage from the onset of DRX to the end of deformation. In this stage, the value of θ drops rapidly to zero when the flow stress increases to the peak stress (σp), and then the value of θ decreases to negative owing to the softening effect of DRX. As a new dynamic balance between the work hardening and dynamic softening induced by DRX and DRV is reached, the value of θ will increase to zero again and the flow stress reaches to the steady stress (σss). Moreover, supposing DRX does not occur in the alloy, the curve will go along the red dotted line. The value of θ would reduce linearly to zero and the flow stress gradually increases to the saturation stress (σsat).
Relationship between hardening rate and flow stress under the deformation temperature of 1160 °C and strain rate of 0.1 s−1.

In addition, σrec can be calculated by the following equationReference Liu, Li and Luo36:
 $${\sigma _{{\rm{rec}}}} = {\left[ {\mathop {{\sigma _{{\rm{sat}}}}}\nolimits^2 + \left( {\mathop {{\sigma _0}}\nolimits^2 - \mathop {{\sigma _{{\rm{sat}}}}}\nolimits^2 } \right){{\rm{e}}^{ - \Omega \varepsilon }}} \right]^{0.5}}\quad {\rm{,}}$$
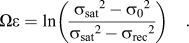
where σ0 is the yield stress, and Ω is the coefficient of DRV. It should be mentioned that DRV is the main softening mechanism when the true strain is smaller than the critical strain.Reference Chen, Lin, Wen, Zhang and He22 Therefore, the value of Ω can be calculated on the basis of the flow stress–strain curve before critical strain. Taking the logarithm on both sides of Eq. (6), and it can be written as:
 $$\Omega \varepsilon = \ln \left( {{{\mathop {{\sigma _{{\rm{sat}}}}}\nolimits^2 - \mathop {{\sigma _0}}\nolimits^2 } \over {\mathop {{\sigma _{{\rm{sat}}}}}\nolimits^2 - \mathop {{\sigma _{{\rm{rec}}}}}\nolimits^2 }}} \right)\quad {\rm{.}}$$
Figure 14 shows the relationship between  $\ln \left[ {{{\left( {\mathop {{\sigma _{{\rm{sat}}}}}\nolimits^2 - \mathop {{\sigma _0}}\nolimits^2 } \right)} \mathord{\left/ {\vphantom {{\left( {\mathop {{\sigma _{{\rm{sat}}}}}\nolimits^2 - \mathop {{\sigma _0}}\nolimits^2 } \right)} {\left( {\mathop {{\sigma _{{\rm{sat}}}}}\nolimits^2 - \mathop {{\sigma _{{\rm{rec}}}}}\nolimits^2 } \right)}}} \right {\left( {\mathop {{\sigma _{{\rm{sat}}}}}\nolimits^2 - \mathop {{\sigma _{{\rm{rec}}}}}\nolimits^2 } \right)}\right\big]$ and ε under a deformation temperature of 1160 °C and strain rate of 0.1 s−1. The value of Ω can be determined by the linear regression method. Therefore, the value of σrec can be obtained by taking the value of Ω into Eq. (6). Finally, X DRX can be calculated by taking the values of σrec, σsat, and σss into Eq. (5).
Relationship between  $\ln \left[ {{{\left( {\mathop {{\sigma _{{\rm{sat}}}}}\nolimits^2 - \mathop {{\sigma _0}}\nolimits^2 } \right)} \mathord{\left/ \kern-\nulldelimiterspace} {\left( {\mathop {{\sigma _{{\rm{sat}}}}}\nolimits^2 - \mathop {{\sigma _{{\rm{rec}}}}}\nolimits^2 } \right)}}} \right{\big]}$ and ε under the deformation temperature of 1160 °C and strain rate of 0.1 s−1.

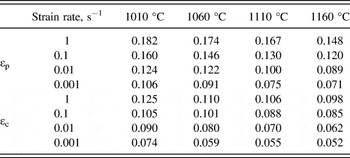
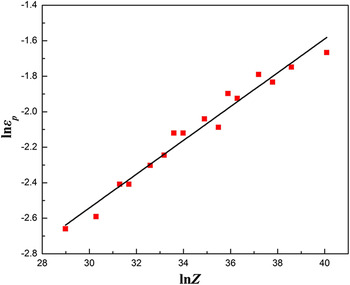
Based on the critical stress, peak stress, and the flow strain–stress curves, the values of εp and εc can also be obtained, which are listed in Table II. It can be found that the values of εp and εc are dependent on the deformation temperature and strain rate. In other words, the values of εp and εc decrease with the increase of deformation temperature or the decrease of strain rate, indicating that the DRX behavior occurs easier at the higher deformation temperature or the lower strain rate. Moreover, the combined effects of deformation temperature and strain rate on the critical strain and peak strain of the alloy can be characterized by the parameter Z. Figure 15 shows the relationship between lnεp and lnZ for the alloy. Therefore, εp can be represented as a power function of the parameter Z,
 $${\varepsilon _{\rm{p}}} = 0.00453{Z^{0.09518}}\quad {\rm{.}}$$
Values of peak strain and critical strain.

Relationship between lnεp and lnZ.

In addition, the relationship between εc and εp can be usually represented asReference Chen, Lin and Ma35:
 $${\varepsilon _{\rm{c}}} = k{\varepsilon _{\rm{p}}}\quad {\rm{,}}$$
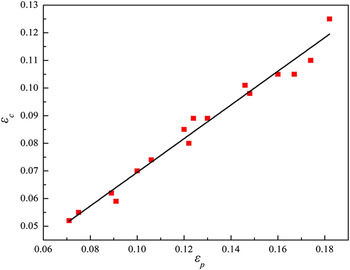
where k is the constant between 0.6 and 0.85. Figure 16 shows the relationship between εc and εp for the alloy. The value of k can be determined as 0.6 by the linear regression method. Hence, the relationship between εc and εp of the alloy can be expressed as:
 $${\varepsilon _{\rm{c}}} = 0.6{\varepsilon _{\rm{p}}}\quad {\rm{.}}$$
Relationship between εc and εp.

Taking Eq. (10) into Eq. (8), and then Eq. (10) can be written as:
 $${\varepsilon _{\rm{c}}} = 0.00272{Z^{0.09518}}\quad {\rm{.}}$$
Taking logarithm on both sides of Eq. (3), which can be written as:
 $$\ln \left[ { - \ln \left( {1 - {X_{{\rm{DRX}}}}} \right)} \right] = \ln {K_{\rm{d}}} + {n_{\rm{d}}}\ln \left( {{{\varepsilon - {\varepsilon _{\rm{c}}}} \over {{\varepsilon _{\rm{p}}}}}} \right)\quad {\rm{.}}$$
Figure 17 shows the relationship between  $\ln \left[ { - \ln \left( {1 - {X_{{\rm{DRX}}}}} \right)} \right]$ and
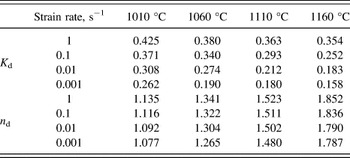
 $\ln \left( {{{\varepsilon - {\varepsilon _{\rm{c}}}} \over {{\varepsilon _{\rm{p}}}}}} \right)$ for the alloy under the deformation temperature of 1160 °C and strain rate of 0.1 s−1. The values of n d and K d can be determined by the linear regression method. By applying the above method, the values of n d and K d under different conditions are determined and listed in Table III.
Relationship between  $\ln \left[ { - \ln \left( {1 - {X_{{\rm{DRX}}}}} \right)} \right]$ and
 $\ln \left( {{{\varepsilon - {\varepsilon _{\rm{c}}}} \over {{\varepsilon _{\rm{p}}}}}} \right)$ under the deformation temperature of 1160 °C and strain rate of 0.1 s−1.

Values of K d and n d.

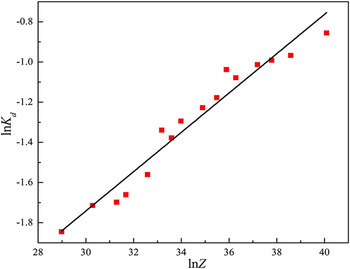
It is notable that the values of K d are dependent on the deformation temperature and strain rate. The relationship between K d and the parameter Z is illustrated in Fig. 18. K d can be represented as a power function of the parameter Z,
 $${K_{\rm{d}}} = 0.00931{Z^{0.09784}}\quad {\rm{.}}$$
Relationship between lnK d and lnZ.

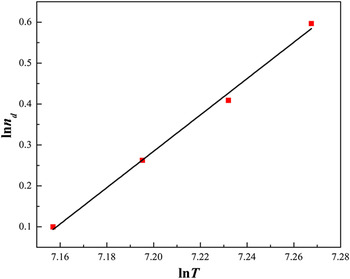
On the other hand, from Table III it can be found that the values of n d are mainly dependent on the deformation temperature. At 1010 °C, the values of n d are calculated in the range of 1.077–1.135, and the average value is 1.105. Similarly, the average values of n d at other deformation temperatures can be calculated. Figure 19 shows the relationship between the average values of n d and the deformation temperature. Hence, n d can be represented as a power function of deformation temperature,
 $${n_{\rm{d}}} = 1.76663 \times {10^{ - 14}}{T^{4.43774}}\quad {\rm{.}}$$
Relationship between lnn d and lnT.

Summarily, the DRX kinetics equations (ε > εc) of the studied alloy can be expressed as,
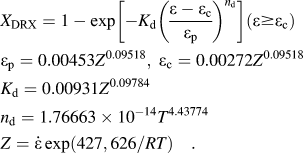 $$\eqalignb{{X_{{\rm{DRX}}}} = 1 - \exp \left[ { - {K_{\rm{d}}}{{\left( {{{\varepsilon - {\varepsilon _{\rm{c}}}} \over {{\varepsilon _{\rm{p}}}}}} \right)}^{{n_{\rm{d}}}}}} \right]\left( {\varepsilon \ge {\varepsilon _{\rm{c}}}} \right) \cr{\varepsilon _{\rm{p}}} = 0.00453{Z^{0.09518}},\;{\varepsilon _{\rm{c}}} = 0.00272{Z^{0.09518}} \cr{K_{\rm{d}}} = 0.00931{Z^{0.09784}} \cr{n_{\rm{d}}} = 1.76663 \times {10^{ - 14}}{T^{4.43774}} \crZ = \dot \varepsilon \exp ({{427,626} \mathord{\left/ {\vphantom {{427,626} {RT}}} \right. \kern-\nulldelimiterspace} {RT}})\quad {\rm{.}} \cr}$$
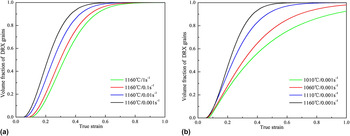
By applying the above DRX kinetics equations, the kinetics models of DRX at different deformation conditions can be obtained. Figure 20 shows the curves of DRX kinetics under different deformation temperatures and strain rates. It can be found that DRX did not occur when the strain was less than the critical strain. Moreover, the volume fraction of DRX grains increases with increasing strain and the DRX evolution exhibits “slow–rapid–slow” growth trend in terms of S-curves. At a given strain, the volume fraction of DRX grains is larger at the higher deformation temperature or lower strain rate. Meanwhile, Chen et al.Reference Chen, Lin, Wen, Zhang and He22 reported a similar DRX evolution for a typical nickel-based superalloy, which was also strengthened by the γ′ phase in the face centered cubic matrix (γ phase). However, the strengthening mechanism of the alloy is also ascribed to the γ″ phase, which is usually unstable and it can be transformed into the δ phase.
The curves of DRX kinetics under different conditions, (a) 1160 °C with different strain rates and (b) 0.001 s−1 with different deformation temperatures.

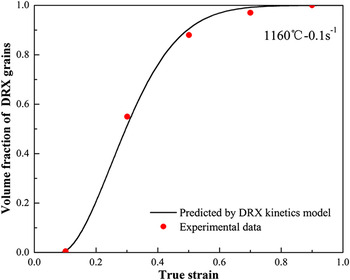
The comparison between the proposed DRX kinetics model and the statistical data from the microstructure examination at 1160 °C and 0.1 s−1 is shown in Fig. 21. It can be found that the theoretical results of DRX volume fraction correlate well with experimental results, which indicates that the proposed kinetics model can give an accurate estimate of DRX behavior for Ni–18.3Cr–6.4Co–5.9W–4Mo–2.19Al–1.16Ti alloy during hot deformation.
The comparison between the predicted and experimental data.

IV. CONCLUSIONS
In this work, the DRX behavior of Ni–18.3Cr–6.4Co–5.9W–4Mo–2.19Al–1.16Ti alloy has been investigated systemically in the temperature range of 1010–1160 °C and strain rate range of 0.001–1 s−1. The main points resulted from the present work are presented as follows:
(1) The nucleation mechanisms of DDRX and CDRX occurred simultaneously in the alloy during hot deformation, and the effect of CDRX was closely related to the deformation parameters. At 1160 °C/0.1 s−1, it was found that the effect of CDRX strengthened rapidly at the early stage of hot deformation, leading to the formation of nuclei in the subgrain structures. Moreover, the effect of CDRX grown weaker with increasing deformation temperature or decreasing strain rate. On the other hand, twinning can also play an important role in improving the process of DRX.
(2) The volume fraction of DRX grains increased with increasing deformation temperature or decreasing strain rate, indicating that DRX behavior occurred easier at higher deformation temperature or lower strain rate for the alloy. Moreover, the DRX grain size also increased with increasing deformation temperature or decreasing strain rate, and the relationship between the DRX grain size and the parameter Z was determined to be
 ${d_{{\rm{DRX}}}} = 5.5 \times {10^7}{Z^{ - 0.46}}$.
(3) On the basis of the flow stress–strain data, the relationships between critical strain (εc) and peak strain (εp) were determined to be εc = 0.6εp. In addition, the peak strain can be characterized by the parameter Z, i.e.,
${\varepsilon _{\rm{p}}} = 0.00453{Z^{0.09518}}$.(4) The DRX kinetics equations were developed to evaluate the volume fraction of DRX grains for the alloy during hot deformation. Microstructure observation revealed that the theoretical results of DRX volume fraction correlated well with the experimental results, indicating that the proposed kinetics equations can give a precise estimate of the DRX evolution during hot deformation for the alloy.


ACKNOWLEDGMENTS
This work has been supported by the National Natural Science Foundation of China (No. 51305100), the Program for Changjiang Scholars and Innovative Research Team in University (No. IRT1229).