Introduction
Toxin production by cyanobacteria is a worldwide phenomenon, and adverse health effects due to consumption of, or contact with, toxic cyanobacteria have been reported for humans and livestock in many temperate and tropical countries (Dietrich et al. Reference Dietrich, Fischer, Michel and Hoeger2008). On a global scale, toxic cyanobacteria are predicted to invade new habitats, and to produce higher concentrations of toxins, as a consequence of climate change generating more favourable growth conditions (Sinha et al. Reference Sinha, Pearson, Davis, Burford, Orr and Neilan2012). However, in the polar regions where extensive benthic mats of cyanobacteria dominate freshwater systems (Vincent & Quesada Reference Vincent and Quesada2012), toxin production has received little research attention (Hitzfeld et al. Reference Hitzfeld, Lampert, Späth, Mountfort, Kaspar and Dietrich2000, Jungblut et al. Reference Jungblut, Hoeger, Mountfort, Hitzfeld, Dietrich and Neilan2006, Wood et al. Reference Wood, Mountfort, Selwood, Holland, Puddick and Cary2008a, Kleinteich et al. Reference Kleinteich, Wood, Küpper, Camacho, Quesada, Frickey and Dietrich2012, Reference Kleinteich, Wood, Puddick, Schleheck, Küpper and Dietrich2013).
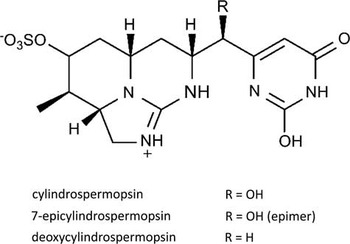
The production of toxic secondary metabolites is a feature of all orders of cyanobacteria (Chorus & Bartram Reference Chorus and Bartram1999). The cyanobacterial toxin cylindrospermopsin (CYN), a cytotoxic alkaloid (Fig. 1), is produced by a number of freshwater cyanobacteria worldwide (Seifert et al. Reference Seifert, McGregor, Eaglesham, Wickramasinghe and Shaw2007), but has never been reported in cyanobacteria from the polar regions (Sinha et al. Reference Sinha, Pearson, Davis, Burford, Orr and Neilan2012). The cyclic polypeptide microcystin (MC) and the alkaloid saxitoxin (STX) have recently been found in Arctic and Antarctic cyanobacterial mats by using molecular and toxicological approaches (Kleinteich et al. Reference Kleinteich, Wood, Küpper, Camacho, Quesada, Frickey and Dietrich2012, Reference Kleinteich, Wood, Puddick, Schleheck, Küpper and Dietrich2013). The genes involved in toxin production are encoded on large gene clusters, cyr (43 kb), mcy (55 kb) and sxt (>35 kb) for CYN, MC and STX production, respectively (for review see Pearson et al. Reference Pearson, Mihali, Moffitt, Kellmann and Neilan2010). Phylogenetic analysis of these gene clusters can provide valuable information relating to the evolutionary development of species-specific traits (Rantala et al. Reference Rantala, Fewer, Hisbergues, Rouhiainen, Vaitomaa, Börner and Sivonen2004, Murray et al. Reference Murray, Mihali and Neilan2011), especially when they are derived from species originating from geographically isolated habitats, such as Antarctica. Despite the ancient origin of the toxins (Rantala et al. Reference Rantala, Fewer, Hisbergues, Rouhiainen, Vaitomaa, Börner and Sivonen2004, Murray et al. Reference Murray, Mihali and Neilan2011), the physiological function within the cyanobacterial group remains unclear. In the benthic mats of polar freshwaters, toxins may be involved in species interaction (communication, quorum-sensing), protection against UV radiation and oxidative stress (for review see Kaplan et al. Reference Kaplan, Harel, Kaplan-Levy, Hadas, Sukenik and Dittmann2012), and/or influencing the grazing behaviour of higher organisms (Ernst et al. Reference Ernst, Hitzfeld and Dietrich2001) and, therefore, the community composition. The polar freshwater ecosystems, in general characterized by simple trophic relationships, may provide a unique model to study the complex interactions of toxin-producing and non-toxic cyanobacteria.
Chemical structure of cylindrospermopsin (CYN) and known variants.

A previous study demonstrated that toxin production, as well as diversity, was increased in laboratory-cultured Arctic and Antarctic cyanobacterial mats when exposed to higher constant temperatures (8–16°C) (Kleinteich et al. Reference Kleinteich, Wood, Küpper, Camacho, Quesada, Frickey and Dietrich2012). It is hypothesized that the increased toxin production may result from better growth conditions for toxin-producing cyanobacteria at higher temperatures (Davis et al. Reference Davis, Berry, Boyer and Gobler2009). Alternatively, higher species diversity or abundance could intensify inter-species competition at higher temperatures. In the latter case, increased toxin concentrations would possibly serve as a means for quorum-sensing, intra-species communication or as allelopathic compounds. However, to date, no direct connection between diversity and toxin production in a natural or artificial cyanobacterial community has been demonstrated.
Benthic mats in Antarctica generally contain a diverse range of cyanobacterial species (e.g. Taton et al. Reference Taton, Grubisic, Balthasart, Hodgson, Laybourn-Parry and Wilmotte2006, Wood et al. Reference Wood, Rueckert, Cowan and Cary2008b). However, most of these studies have used morphological species identification, individual microbial culturing or cloning techniques. With these methods, the most dominant taxa are frequently identified whereas a large number of non-culturable species or species present in low abundance may be overlooked (Pearce et al. Reference Pearce, Newsham, Thorne, Calvo-Bado, Krsek, Laskaris, Hodson and Wellington2012). Due to the limitations of the techniques, it is plausible that such mats contain a greater diversity than previously described. Furthermore, small-scale or gradual effects on diversity, such as the loss of redundant taxa in response to changing environmental conditions, may be difficult to detect. As next-generation sequencing techniques (NGS, e.g. 454 or illumina) deliver a much larger sequence depth, and thus also detect rare taxa, they may enable the detection of such changes in microbial diversity. Even recognizing their current limitations, including PCR amplicon size, selective sequencing, identification of operational taxonomic units (OTUs) from erroneous sequences or over-aggressive clustering (Lee et al. Reference Lee, Herbold, Polson, Wommack, Williamson, McDonald and Cary2012, Pearce et al. Reference Pearce, Newsham, Thorne, Calvo-Bado, Krsek, Laskaris, Hodson and Wellington2012), these technologies may allow identification of associations between environmental factors (e.g. temperature, water availability, dispersal rates or water characteristics), toxin concentration and certain cyanobacterial taxa.
To identify potential links between diversity patterns and cyanobacterial toxicity in Antarctic freshwaters, 30 cyanobacterial mats from Adelaide Island and nearby islands off the Antarctic Peninsula were analysed for cyanobacterial toxins and genetic taxonomic diversity. Cyanotoxins (CYN, MC and STX) were analysed using immunological, chemical and molecular methods, and diversity was assessed using a comparative approach of 454® NGS and automated ribosomal intergenic spacer analysis (ARISA).
Material and methods
Study sites and sample collection
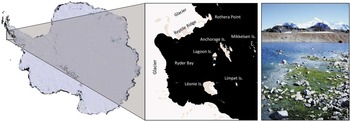
Cyanobacterial samples were collected close to the British Antarctic Survey’s Rothera Research Station (67°34'S, 68°08'W), Adelaide Island, off the Antarctic Peninsula (Fig. 2), between December 2010 and February 2011. Sampling sites were located at Rothera Point (RO), Anchorage Island (AN), Léonie Island (LE) and Lagoon Island (LA), all within 10 km distance of the Rothera Research Station. Early in the growth season (end of December 2010) the rocky landscape was covered with snow and few phototrophic organisms were visible (mostly red and green snow algae). When snow melt occurred, rapid cyanobacterial growth was observed in the meltwater runoff which provided a highly variable and fluctuating habitat. Larger ponds (up to 4 m in diameter) seemed to provide a more stable habitat and accumulated more biomass. By late January and February extensive cyanobacterial mats had developed at several sites. At RO, most samples were collected at ‘east beach’ (unofficial name), a flat area of raised beach close to the shore and impacted by seals and seabirds. Three areas were sampled at AN: i) an extensive mat close to the shore, ii) a shallow but large meltwater pond c. 20 m in diameter, impacted both by elephant seals and seabirds, and iii) several mats along a meltwater stream in an area less impacted by large animals. Due to a steeper shoreline, LE was less influenced by seals and the formation of standing water bodies was more restricted, thus fewer cyanobacterial mats were located. Samples from LA were obtained from: i) a flat and protected south-facing coastal area (inside the lagoon) that was located adjacent to an elephant seal haul-out and bird nesting area, and ii) a larger, shallow pool of 30 m diameter. The appearance of the mats was highly diverse, displaying different colourations (from bright green to black or orange-red), textures and sizes (Table I, Fig. S1 found at http://dx.doi.org/10.1017/S0954102014000145).
Map of sampling locations. The sampling sites are located on the Antarctic Peninsula (left panel). All sites are within 10 km the Rothera Research Station (Rothera Point) and on Anchorage, Lagoon and Léonie islands (middle panel). Images are modified from the Landsat Image Mosaic of Antarctica (LIMA, USGS). The photograph (right panel) shows the typical landscape of the Antarctic Peninsula and cyanobacterial mat habitat (Lagoon Island, 20 January 2011 by Julia Kleinteich).

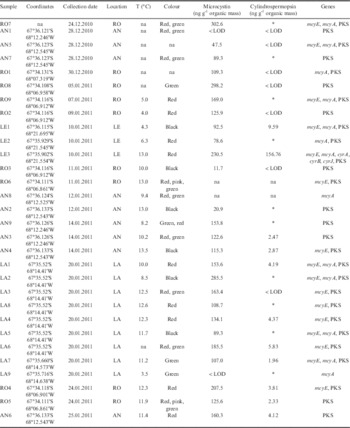
Toxicity data: geographical origin, water temperature, detected microcystin and cylindrospermopsin concentrations, and distribution of mcy and cyr genes detected in each sample.

AN=Anchorage Island, LA=Lagoon Island, LE=Léonie Island, RO=Rothera Point; na=not analysed, LOD=limit of detection.
* Samples tested positive for cylindrospermopsin in a preliminary ELISA assay (n=1) but concentrations were not determined.
Thirty samples of cyanobacterial mats from the various sites were collected for DNA extraction and toxin analysis, sealed in sterile tubes or bags and frozen (-20°C) within 24 hours of collection until further analysis. Samples were usually collected between 11h00 and 16h00, when daily temperatures and radiation levels were highest. The variability of daily temperature over the duration of several weeks was determined in three independent mats (two at RO and one on AN) using temperature loggers (iButton®, Maxim, CA, USA). Water temperature was recorded using a hand-held thermometer (TFA Wertheim, Germany).
Toxin extraction
Frozen cyanobacterial material was thawed, homogenized with a sterile glass spatula and lyophilized. From each sample, three replicate aliquots of lyophilized material were processed as follows. Varying amounts of material (0.06–1.2 g organic mass) were combined with 5 ml of 75% methanol and ground to a fine paste using mortar and pestle. An additional 75% methanol (10 ml) was added to each tube before being placed in an ice-cold ultrasonic bath (30 minutes). Following centrifugation (30 minutes, 4000 x g) the supernatant was collected for further processing. The latter extraction step was repeated three times on the same pellet, all supernatants were combined and subsequently dried under continuous nitrogen flow. The resulting pellet was re-suspended in 15 ml H2O (15 minutes in an ultrasonic bath for complete solubilization) and cleaned twice using C18 cartridges (Sep-Pak, Waters, Dublin). The extract on the C18 cartridges was eluted with 15 ml methanol (100%). The methanolic eluate was dried under nitrogen flow and the dried extract re-dissolved in 3 ml methanol (20%). The extract was centrifuged (20 minutes, 13000xg) to remove residual particles and frozen (-20°C) until further analysis. Three technical replicate extracts were prepared per sample and combined before toxin analysis to minimize variability incurred by toxin extraction.
Following the detection of CYN in the 30 samples from the Rothera area, 39 additional cyanobacterial samples obtained during previous polar expeditions at ten Arctic and Antarctic locations (Table S1 found at http://dx.doi.org/10.1017/S0954102014000145), that had been stored frozen, were tested for CYN. These samples were extracted and analysed following a modified protocol as described by Wörmer et al. (Reference Wörmer, Cirés, Carrasco and Quesada2008), using smaller initial amounts of dry mass (0.05 g organic mass) and Milli-Q water as the extraction solvent instead of methanol.
Determination of organic content
The samples collected were heterogeneous in composition, containing organic material as well as sand, stones and other inorganic material. To reduce this source of variability, toxin concentrations were calculated relative to the organic content of the respective sample (percentage organic mass of each sample). Extracted sample residual pellets were lyophilized and their dry mass recorded. Subsequent to combustion at 600°C for 7 hours, the dry inorganic mass was recorded. The organic proportion of each sample was then calculated as the difference between the total mass and inorganic mass for each of the three technical replicate pellets and the average organic content established as the mean of the three technical replicates. Toxin concentrations were standardized to this value.
Toxin analysis
The 30 original sample extracts from Rothera were screened for CYN using a CYN ELISA (microtitre plate; ABRAXIS, PA, USA) according to the manufacturer’s protocol. Absorption of the colour reaction was recorded at 450 nm using a TECAN infinite M200 plate reader. The assay has a limit of detection (LOD) of 0.05 ng CYN ml-1. Based on the preliminary results, 12 samples that generated a strong CYN signal were selected for replicate analysis. The 12 selected extracts were tested in a minimum of three independent CYN ELISA assays, with each sample being determined in two technical replicates per ELISA plate. In addition, in the sample (LE3) that contained the highest concentration of CYN according to the ELISA the presence of CYN and analogues was analytically confirmed via liquid chromatography-mass spectrometry (LC-MS), as described in Wood et al. (Reference Wood, Rasmussen, Holland, Campbell and Crowe2007). The additional 39 samples from other polar locations were analysed for CYN only by LC-MS/MS (as described by Cirés et al. Reference Cirés, Wörmer, Timón, Wiedner and Quesada2011), with an LOD of 0.9 ng ml-1.
The 30 original sample extracts from Rothera were analysed for MCs and STXs using the MC ADDA ELISA microtitre plate and the STX (PSP) ELISA (both from ABRAXIS, PA, USA) following the manufacturer’s instructions. These assays have an LOD of 0.15 ng MC ml-1 and 0.02 ng STX ml-1, respectively. For each sample a minimum of three independent ELISA assays (including two technical replicates per ELISA) were carried out.
DNA extraction
DNA was extracted from each sample in three individual extractions using three different extraction methods. The extracts were subsequently combined for downstream applications.
As a first extraction method, the MO BIO PowerSoil® DNA Isolation Kit (MO BIO laboratories, CA, USA) was used to extract DNA from 5–10 mg of frozen mat material following the manufacturer’s instructions.
In a second extraction method, DNA was isolated from 5–10 mg of sample using the hot-phenol method. Briefly the mat material was combined with 700 µL TES buffer (10 mM Tris HCl pH 8, 1 mM EDTA, 2% sodium dodecyl sulfate (SDS)) and 70 µg Proteinase K (Qiagen, Germany) and incubated at 50°C for 1 hour. The salt concentration of the solution was adjusted to 400 mM NaCl. An equal volume of phenol/chloroform/isoamylalcohol (25:24:1) was added and a DNAse-free metal bead (Qiagen, Germany) supplied to each tube. The samples were vortexed (15 minutes) and the phases separated by centrifugation (10 000xg, 2 minutes). The aqueous phase was transferred to a new tube and the phenol extraction repeated. The DNA in the resulting aqueous phase was precipitated with 0.1 volume of 3 M sodium acetate and 1 volume of cold isopropanol (incubation at -20°C for 2 hours). The precipitated DNA was recovered by centrifugation (13 000xg, 15 minutes at 4°C). The isopropanol was removed and the pellet washed with 70% ethanol and air dried. The DNA pellet was re-dissolved in sterile, DNAse-free water.
In the third extraction method, DNA was extracted using xanthogenate following the modified protocol of Jungblut et al. (Reference Jungblut, Lovejoy and Vincent2010). Subsamples (5–10 mg) of frozen mat material were combined with 1 ml XS buffer (0.1 M Tris HCl, 20 mM EDTA, 1% w/v potassium-ethyl-xanthogenate, 1% w/v SDS, 0.8 M ammonium acetate) in garnet-bead-containing tubes (MO BIO laboratories, CA, USA). These were then incubated at 65°C for 3 hours with a 30-minute vortexing step after 1 hour. Samples were subsequently placed on ice for 10 minutes and centrifuged (12 000xg, 10 minutes). The supernatant was collected in a clean tube and extracted with phenol/chloroform/isoamylalcohol, precipitated and washed as described above for the hot-phenol-protocol (2nd method).
All resulting DNA extracts were dissolved in sterile DNAse-free water, their quality (purity and concentration) tested using NanoDrop™ (NanoDrop 3300 Fluorospectrometer, ThermoScientific) and subsequently frozen (-20°C) until further use.
Equal volumes of extracted DNA from each extraction method were combined, measured in NanoDrop and stored at -20°C for long-term storage or at 4°C for subsequent experiments.
Detection and phylogeny of genes involved in toxin synthesis
Several PCRs were performed on genes in the mcy, sxt and cyr operon involved in MC, STX and CYN synthesis, respectively (primers and annealing temperatures are listed in Table S2 found at http://dx.doi.org/10.1017/S0954102014000145). For all reactions either Master Mix™ (Fermentas, Germany) or Phusion™ polymerase (NEB, MA, USA) were used with the addition of bovine serum albumin, dimethyl sulfoxide and MgCl2 (Fermentas or NEB). Bands of interest were excised from 1.5–2% agarose-gels (TAE-buffered) using a sterile scalpel, purified with a Gel Extraction Kit (Fermentas, Germany) and bi-directionally sequenced by Eurofins MWG Operon (Ebersberg, Germany) (primers listed in Table S2 found at http://dx.doi.org/10.1017/S0954102014000145). Microcystis aeruginosa Kützing CCAP 1450/16 served as a positive control for mcy genes (tested positive for MC production, data not shown), Aphanizomenon ovalisporum Forti UAM290 for cyr genes (Cirés et al. Reference Cirés, Wörmer, Timón, Wiedner and Quesada2011) and an Arctic cyanobacterial sample for sxt genes. The sequences obtained were aligned and manually edited using Geneious™ software (Geneious Pro 5.5.6). The closest phylogenetic match was identified for each sequence using the BLAST (megablast) search of GenBank (phylogenetic affiliations and accession numbers are given in Table S3 found at http://dx.doi.org/10.1017/S0954102014000145).
Automated ribosomal intergenic spacer analysis
The intergenic transcribed spacer regions of the 16S–23S rRNA gene of the total community DNA was amplified by PCR as described in Kleinteich et al. (Reference Kleinteich, Wood, Küpper, Camacho, Quesada, Frickey and Dietrich2012) with a set of cyanobacteria-specific oligonucleotides (Wood et al. Reference Wood, Rueckert, Cowan and Cary2008b). Intergenic spacer lengths were detected by MWG eurofins (Ebersberg, Germany) and statistically analysed as described previously (Wood et al. Reference Wood, Rueckert, Cowan and Cary2008b). Signal intensities <200 fluorescence units (FU) were deemed background noise and thus discarded. Consequently, only fragments of >200 bp were regarded to be true intergenic transcribed spacer signals and statistically analysed using the PRIMER-E 6 software (PRIMER-E). A resemblance matrix was created based on the Bray–Curtis similarities and plotted as a multi-dimensional scaling (MDS) plot (number of restarts 100, minimum stress value 0.01).
Pyrosequencing and bioinformatic analysis
The DNA extracts (mix of three different extractions) were used for pyrosequencing using a 454 Sequencing System (Roche 454 Life Sciences) at the Research and Testing Laboratories, Texas, USA. Approximately 0.6 µg of total DNA was used for each run. The standard protocol for cyanobacterial diversity, based on 16S rRNA gene sequencing, was used with the following primers: forward 5’-CGGACGGGTGAGTAACGCGTGA-3’ and reverse 5’-GTNTTACNGCGGCKGCTG-3’. On average, 5000 reads per sample were obtained. Despite the utilization of cyanobacteria-specific primers, non-cyanobacterial 16S rRNA genes were also retrieved in the sequencing. All OTUs not belonging to the phylum ‘Cyanobacteria’, along with those classified as ‘Chloroplast’ at class level were filtered for further analysis; sample RO8 was excluded as 1094 reads were assigned to chloroplasts (out of 1107 cyanobacterial reads).
Raw 16S rRNA gene reads were quality filtered to ensure minimum length of 150 bp, not more than eight homonucleotides, no ambiguous bases and an average read Phred quality equivalent of 25. Thus 167469 out of 404051 reads were retained and, of these, 24080 sequences were trimmed because the 3’ end fell below a quality of 25 in a 10 bp window. The OTUs were computed from quality-filtered reads with a customized re-implementation of otupipe, following the updated parameters given on drive5.com/usearch/manual/otu_clustering.html, using the default options and uclust 6.0.307 (Edgar Reference Edgar2010). The OTUs were clustered at 97% identity. Taxonomy based on BLASTn sequence identity to the Greengenes May 2013 database (McDonald et al. Reference McDonald, Price, Goodrich, Nawrocki, DeSantis, Probst, Andersen, Knight and Hugenholtz2012) was assigned to the OTUs, using the following identity cut-offs to determine the respective taxonomic level: species >97%, genus >95%, family >90%, order >85%, class >80% and phylum ≥77%. All OTUs not matching to a Greengenes sequence with a cut-off threshold of 77% were discarded from further analysis. A phylogenetic tree including all sequences was built (Fig. S2 found at http://dx.doi.org/10.1017/S0954102014000145).
Data analysis was conducted with R 2.13. To correct for differential sequencing depth of single samples, the number of reads in each sample has to be rarefied (randomly downsampled) to the same number of reads in each sample. This is necessary to compare the number of different species (i.e. richness) in each sample. Single samples were rarefied to 1325 (all phyla) or 450 (only cyanobacteria) reads per sample for richness and alpha-diversity analysis, this cut-off was chosen to include all samples. Using the rarefied matrix, Shannon diversity and Chao1 richness estimates were calculated using the R-package vegan (Oksanen et al. Reference Oksanen, Blanchet, Kindt, Legendre, Minchin, O’Hara, Simpson, Solymos, Stevens and Wagner2012). This was repeated five times per sample and the average used as the reported richness or diversity estimate. For ordination and statistical testing, samples were normalized to the proportional taxa abundance within each sample.
All ordinations (non-metric multi-dimensional scaling (NMDS), distance-based redundancy analysis (dbRDA)) and subsequent statistical analyses were carried out using the R-package vegan with Bray–Curtis distance on the rarefied and log-transformed taxa abundance and visualized with custom R scripts (Hildebrand et al. Reference Hildebrand, Ebersbach and Nielsen2012, Reference Hildebrand, Nguyen, Brinkman, Yunta, Cauwe, Vandenabeele, Liston and Raes2013). Community differences were calculated using a permutation test on the respective NMDS reduced feature space, as implemented in vegan. Differences among inter-group microbiota were calculated using PERMANOVA (Anderson Reference Anderson2001) as implemented in vegan. This test compares the intra-group distances to the inter-group distances in a permutation scheme and thus calculates a p-value. For all PERMANOVA tests we used 5 000 000 randomizations. PERMANOVA post-hoc p-values were corrected for multiple testing using the Benjamini–Hochberg false discovery rate (q-value) (Benjamini & Hochberg Reference Benjamini and Hochberg1995).
Univariate testing for differential abundances of each taxonomic unit between two or more groups was carried out using a Kruskal–Wallis test (p-value), corrected for multiple testing using the Benjamini–Hochberg false discovery rate (q-value). Taxa with less than ten reads over all samples were excluded from this analysis to avoid artefacts. Post-hoc statistical testing for significant differences between all combinations of two groups was conducted only for taxa with a significance of P<0.2. Wilcoxon rank sum tests were calculated for all possible group combinations and corrected for multiple testing using the Benjamini–Hochberg false discovery rate (q-value).
To test the correlation between ARISA- and pyrosequencing-derived intra-sample distances, the Bray–Curtis 16S rRNA gene distances were calculated as described above for the ordinations. The 16S rRNA gene and ARISA distance matrices were tested for statistically significant correlations using Mantel’s test (Mantel Reference Mantel1967) and visualized accordingly.
Results
Temperatures logged over several weeks demonstrated extreme variation between day and night, ranging from below freezing to c. 20°C during the middle of the day (Fig. S3 found at http://dx.doi.org/10.1017/S0954102014000145). During the collection of samples, the temperatures in shallow, freshwater ponds and streams ranged between 4–16°C (Table I), generally being 2–3°C higher on the direct surface of the mat.
Cyanotoxin analyses
In a preliminary ELISA assay, CYN was detected in 21 out of 30 cyanobacterial mat samples and confirmed by replicate analysis in 11 of these samples (Table I). Concentrations determined ranged between 2–10 ng g-1 organic mass in ten mats. Due to the high number of CYN positive mats, an additional 39 samples, from previous expeditions, were subjected to LC-MS analysis, but none of these samples tested positive for CYN (Table S1 found at http://dx.doi.org/10.1017/S0954102014000145). One mat (LE3 from Léonie Island) showed significantly higher levels of CYN (156 ng g-1 organic mass) than the other mats analysed. An LC-MS/MS analysis of LE3 confirmed the presence of CYN as well as the deoxy-CYN variant. The presence of CYN in sample LE3 was additionally confirmed via the detection of cyr genes involved in CYN production. A 2200 bp product of the cyrAB gene and a 584 bp product of the cyrJ gene (Table S3 found at http://dx.doi.org/10.1017/S0954102014000145), coding for an amidinotransferase (cyrA), a mixed NRPS/PKS (cyrB) and a putative sulfotransferase (cyrJ) (Mazmouz et al. Reference Mazmouz, Chapuis-Hugon, Mann, Pichon, Méjean and Ploux2010), were found to be most similar (96% for cyrAB and 93% for cyrJ) to the cyr gene cluster of Oscillatoria sp. (FJ418586), the only published cyr sequences of the order of Oscillatoriales.
A specific ADDA ELISA assay detected MC in 26 of 27 mats (Table I). Levels of MC varied between 10–300 ng g-1 organic mass. The presence of MC was indirectly corroborated by the detection of genes involved in MC synthesis (mcyE, mcyA, bacterial PKS gene) in 20 mats (Table I). The identity of the mcyA gene was verified by sequencing the products of two different mats, LE3 and LA1. The mcyA genes amplified were found to be most similar to the amino acid adenylation domain of Nostoc punctiforme (Kützing) Hariot (80%, CP001037) in a BLASTn search (Table S3 found at http://dx.doi.org/10.1017/S0954102014000145). For mat RO7, which had the highest MC concentration of 303 ng g-1 organic mass, bands of the correct size for the two mcy genes (mcyE, mcyA), as well as a general bacterial PKS, were amplified (Table I). In mat LE3, which contained the highest levels of CYN, MC was found in high concentrations (231 ng g-1 organic weight). Moreover, bands of the correct size for the mcyE and the mcyA genes were amplified from the same mat. However, the resulting gene sequences were of poor quality, possibly due to the presence of multiple MC producing species being present in the mats resulting in a mixed signal. Therefore, the gene sequences were not used for detailed phylogenetic analysis nor were they deposited in GenBank. Nevertheless, their detection indicates the presence of potentially toxin-producing cyanobacteria.
No STX was detected and the genes involved in STX production were not identified in the mats analysed.
Cyanobacterial genetic diversity
Analysis of the sequences derived from 454 NGS, that passed quality filtering, delineated a total of 1504 OTUs; each sample consisted on average of 2941±1912 reads. Despite the use of cyanobacteria-specific primers, c. 27% of all sequences were of non-cyanobacterial origin. A total of 274 cyanobacterial OTUs were used for this analysis, consisting of 2151±1808 reads per sample. Of these cyanobacterial OTUs, 100% could be identified at order, 97.9% at family and 81.4% at genus, but only 3.2% at the species/strain level. An average of 23.8 cyanobacterial OTUs and 4.3 cyanobacterial genera were observed per sample on 450 rarefied sequences. ARISA data indicated between 4–18 ARISA fragment lengths (AFLs) with an average of 11 AFLs per sample.
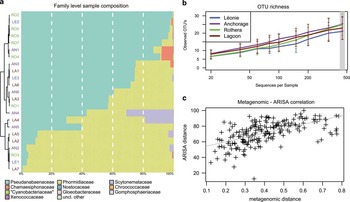
Based on the analyses of the 454 sequencing dataset, samples were generally dominated by the cyanobacterial families Pseudanabaenaceae (average of 55% among all samples) and Phormidiaceae (average of 41%), with Scytonemataceae the third most abundant family (average of 2.5%) (Fig. 3a). The genera Leptolyngbya (Pseudanabaenaceae) and Phormidium (Phormidiaceae) predominated in most mats. The Leptolyngbya-specific OTUs made up 0.9–99.3% and the Phormidium-specific OTUs 0.4–96.1% of cyanobacterial OTUs in our samples (Fig. S4 found at http://dx.doi.org/10.1017/S0954102014000145). Other genera present in low abundance included Nostoc, Scytonema, Snowella and Nodularia, which could not be identified at species level. The composition of most mats was comparable. However, sample LA7 was dominated by OTU_30 that was only present in this sample and only classifiable at family level to Phormidiaceae (Fig. S4 found at http://dx.doi.org/10.1017/S0954102014000145). The OTU richness was highest for the mats collected on AN, RO and LA, and lowest for LE, although the differences were not statistically significant (Kruskal–Wallis test, Fig. 3b), with similar Chao1 estimates being obtained. The Shannon diversity index was highest in samples from LA and AN, and lowest from LE and RO (data not shown).
Next-generation sequencing results. a. Taxonomic composition of individual samples from Rothera Point (RO), Anchorage Island (AN), Lagoon Island (LA) and Léonie Island (LE) at family level, with a hierarchical clustering of the samples. The term ‘Cyanobacteriaceae’ was derived from the Greengenes database. b. Rarefaction curve of observed OTUs up to 450 rarefied sequences per sample, showing consistent but non-significant differences between sample locations. c. The correlation of 16S rDNA compositional data at OTU level and ARISA data was highly significant (P<1e-4).

The two dissimilarity matrices derived from the 454 OTU level data and the ARISA data were compared across samples, demonstrating a highly significant correlation to each other (Spearman Rho=0.5839, Mantel’s test P<0.0001, Fig. 3c), showing that composition estimates were similar using both methods. However, no correlation was found for the richness estimates of individual samples between the two methodologies (data not shown).
Correlation of sequencing data and environmental data
The cyanobacterial sample compositions were correlated to various environmental factors (metadata) of the individual mat samples. Out of 88 tested OTUs, ten were significantly correlated to the surface colour of the mat, as were the two dominant families. Red and red/green samples were dominated by Pseudanabaenaceae and black samples were dominated by Phormidiaceae. Three families were significantly correlated to the substratum. Chroococcaceae and Phormidiaceae were more abundant on rock and gravel (P=0.01, q=0.08 and P=0.03, q=0.08, respectively), whereas Pseudanabaenaceae were more frequent on sand (P=0.034, q=0.08). Higher temperatures were linked with higher cyanobacterial Shannon diversity at genus level (P<0.05), with Scytonemataceae in particular benefiting from higher temperature (P=0.01) and Chroococcaceae being impacted negatively (P<0.01).
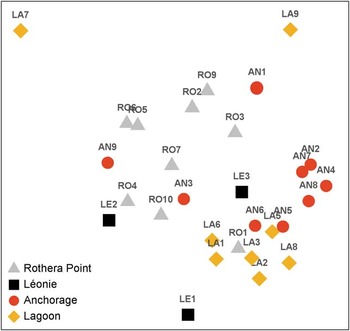
A large fraction of the observed beta diversity, measured as Bray–Curtis distance between log-transformed taxa abundances, was explained by the sample location. An NMDS ordination of the 454 data (Fig. S5 found at http://dx.doi.org/10.1017/S0954102014000145) showed a similar picture to the MDS based on the ARISA data (Fig. 4). Samples from LA and AN clustered together, whereas the samples collected from RO grouped separately. Using all cyanobacterial OTUs obtained from a given location and a PERMANOVA test, we tested whether the sample composition (diversity) was significantly different between locations. This was the case at family level (P=0.016), although in post-hoc testing only the differences between RO and LA were significant (P=0.006, q ≤ 0.036). At genus and OTU level, no significant differences were detected between sample composition and location.
Community composition of cyanobacterial mats from Rothera Point and nearby islands, shown as a two-dimensional non-metric multi-dimensional scaling ordination (stress value of 0.12) based on Bray–Curtis similarities of ARISA fingerprints in relation to the geographical sample origin.

The CYN concentrations showed a significant positive correlation with the family Scytonemataceae (P=0.0139; q=0.097), but after multiple testing correction no OTU could be identified to be correlated significantly with CYN. As it contained the highest levels of CYN, the species composition of mat sample LE3 was analysed in detail. However, the sample was not clearly different in composition to the other samples examined (data not shown) and, therefore, did not provide information about the potential producer of CYN.
Microcystin did not significantly correlate with the cyanobacterial species richness based on 454 data at genus or OTU level. However, six individual cyanobacterial OTUs were positively correlated to MC concentration (q<0.2), all belonging to Leptolyngbya or Pseudanabaenaceae (Table S4 found at http://dx.doi.org/10.1017/S0954102014000145). One specific OTU (Pseudanabaenaceae) was only present when MC was detectable in the sample. A positive and significant correlation (P<0.0001, q=0.005, Spearman test) of this OTU with MC concentrations was present. Four OTUs were present only in samples that had no detectable MC (P<0.0001, q<0.1, Kruskal–Wallis test), these were identified as Leptolyngbya and Nostoc.
Discussion
Cylindrospermopsin and deoxy-CYN are more commonly associated with cyanobacterial blooms in tropical and temperate regions (Sinha et al. Reference Sinha, Pearson, Davis, Burford, Orr and Neilan2012) and have, to our knowledge, never been recorded in a polar environment. The concentration of CYN found in this study (2–156 ng g-1 organic mass) is low when compared to those detected in benthic species of warmer climatic zones (up to 20x103 ng CYN g-1 dry mass and up to 547x103 ng deoxy-CYN g-1 dry mass; Seifert et al. Reference Seifert, McGregor, Eaglesham, Wickramasinghe and Shaw2007). However, finding CYN in several cyanobacterial mats around Rothera confirms that this toxin is produced by species inhabiting diverse temperature ranges and various climatic zones, including cold habitats. It is noteworthy that none of the samples from other Arctic and Antarctic habitats tested positive for CYN. This may be due to the methodology (a higher LOD of the LC-MS/MS compared to the ELISA) and a lower initial biomass used for extraction, but could also indicate that CYN is absent in these samples. The latter may suggest that CYN production is a feature geographically restricted to certain Antarctic regions. None of the known CYN producers (Mazmouz et al. Reference Mazmouz, Chapuis-Hugon, Mann, Pichon, Méjean and Ploux2010), with the exception of the genus Oscillatoria, is described abundant on the Antarctic continent (e.g. Jungblut et al. Reference Jungblut, Wood, Hawes, Webster-Brown and Harris2012). Despite an inability to successfully isolate or identify the CYN producer, the homology of the identified cyrAB and cyrJ genes to Oscillatoria sp. could suggest that the CYN producer belongs to the order Oscillatoriales.
Previous studies have reported the presence of MC on the McMurdo Ice Shelf in Continental Antarctica (Hitzfeld et al. Reference Hitzfeld, Lampert, Späth, Mountfort, Kaspar and Dietrich2000, Jungblut et al. Reference Jungblut, Hoeger, Mountfort, Hitzfeld, Dietrich and Neilan2006), as well as on Bratina Island and in the McMurdo Dry Valleys (Wood et al. Reference Wood, Mountfort, Selwood, Holland, Puddick and Cary2008a). While Jungblut et al. (Reference Jungblut, Hoeger, Mountfort, Hitzfeld, Dietrich and Neilan2006) reported MC in only one microbial mat, Hitzfeld et al. (Reference Hitzfeld, Lampert, Späth, Mountfort, Kaspar and Dietrich2000) and Wood et al. (Reference Wood, Mountfort, Selwood, Holland, Puddick and Cary2008a) detected the toxin in a large number of samples. When added to these previous reports, the high proportion of MC-positive cyanobacterial mats in the samples analysed here from the Antarctic Peninsula suggests a wide distribution of MC production in the Antarctic. Although the concentrations of MC were low (11–303 ng g-1 organic mass) when compared to cyanobacterial blooms in temperate regions (up to 10x106 ng g-1 dry mass, Chorus & Bartram Reference Chorus and Bartram1999) they are in the range of those reported for other Antarctic (11.4x10³ ng MC-LR g-1 dry mass, Jungblut et al. Reference Jungblut, Hoeger, Mountfort, Hitzfeld, Dietrich and Neilan2006; 1–16x103 ng g-1 dry mass, Wood et al. Reference Wood, Mountfort, Selwood, Holland, Puddick and Cary2008a) and Arctic habitats (106 ng MC g-1 dry mass, Kleinteich et al. Reference Kleinteich, Wood, Puddick, Schleheck, Küpper and Dietrich2013). Accepting that the presence of the mcy gene cluster is not proof of active toxin production, mcy gene cluster presence in most cyanobacterial mats sampled (Table I) supports the ubiquitous distribution of potential toxin producers in the areas sampled. Many species have been reported to produce the heptapeptide MC (Chorus & Bartram Reference Chorus and Bartram1999), some of which have been described in Antarctica. Nostoc sp. has been reported as a potential producer of MC in both the Antarctic and Arctic (Wood et al. Reference Wood, Mountfort, Selwood, Holland, Puddick and Cary2008a, Kleinteich et al. Reference Kleinteich, Wood, Puddick, Schleheck, Küpper and Dietrich2013). In this study, Nostoc is considered a probable candidate MC producer based on our sequencing data (Fig. 3a), the presence of the mcyB gene product, which was most similar to the amino acid adenylation domain of N. punctiforme, and the identification of Nostoc sp. by microscopic observation (data not shown). However, OTUs of other potential MC-producing genera, including Snowella, Pseudanabaena and Leptolyngbya, were present in the samples, thus the precise identification of a single or multiple MC producer(s) was not possible.
Based on the 454 analyses, the cyanobacterial species diversity appears higher compared to data from previous studies in the Antarctic that employed morphological and more traditional molecular methods (Taton et al. Reference Taton, Grubisic, Balthasart, Hodgson, Laybourn-Parry and Wilmotte2006, Jungblut et al. Reference Jungblut, Lovejoy and Vincent2010). Jungblut et al. (Reference Jungblut, Lovejoy and Vincent2010) detected 5–14 phylotypes per cyanobacterial community on the McMurdo Ice Shelf. Taton et al. (Reference Taton, Grubisic, Balthasart, Hodgson, Laybourn-Parry and Wilmotte2006) detected 17 morphotypes and 25 OTUs in five samples originating from four lakes of the Larsemann Hills, Vestfold Hills and Rauer Islands. These numbers correspond to the data obtained here by ARISA indicating an average of 11 AFLs per sample, but contrast the OTU and sequence data where an average of 23.5 OTUs and 4.3 genera were observed per rarefied mat sample, and a total of 274 OTUs. Sequencing depth ranged from 491–7557 cyanobacterial sequences per sample, therefore a minimum threshold of 450 rarefied sequences was applied. The high variation in sequencing depth between samples and the low threshold level probably prevented the detection of an even higher diversity. ARISA, based on the lengths of the intergenic spacer gene region of the 16S-23S gene (Wood et al. Reference Wood, Rueckert, Cowan and Cary2008b), was employed to confirm the community composition of the cyanobacterial mats as obtained by 16S metagenomics. Although ARISA does not provide any phylogenetic information, its applicability for diversity analyses in cyanobacterial mats has been demonstrated in previous studies (Wood et al. Reference Wood, Rueckert, Cowan and Cary2008b, Kleinteich et al. Reference Kleinteich, Wood, Küpper, Camacho, Quesada, Frickey and Dietrich2012). Both ARISA and 454 sequencing provided similar outcomes for inter-sample distances (Fig. 3c).
Based on the pyrosequencing data, Oscillatoriales (i.e. Leptolyngbya and Phormidium) dominated the cyanobacterial mats examined here. This corresponds to previous studies, which have also shown benthic communities in polar freshwaters to be Oscillatoriales-dominated using different methodologies (Vincent & Quesada Reference Vincent and Quesada2012 and references therein), as well as our own microscopic observations of the mat samples (data not shown). Therefore, in conclusion, even though the sequencing depth did not capture the total diversity, the overall species composition may appropriately be displayed in the pyrosequencing dataset.
Based on the OTUs for which identification at the species level was possible, cyanobacteria typically found in cold biotopes were identified (e.g. Phormidium murrayi (West & West) Anagnostidis & Komárek, Leptolyngbya frigida (Fritsch) Anagnostidis & Komárek), and few cosmopolitan species appeared to be present in the mats. An increasing number of species previously thought to be endemic to the Antarctic continent, such as Leptolyngbya antarctica (West & West) Anagnostidis & Komárek, are also now being found in other cold regions, such as in mountain areas and the Arctic (Jungblut et al. Reference Jungblut, Lovejoy and Vincent2010). Thus, as previously proposed by Bahl et al. (Reference Bahl, Lau, Smith, Vijaykrishna, Cary, Lacap and Lee2011), it can be hypothesized that cold-tolerant cyanobacteria may be distributed throughout cold regions and that cold-tolerance developed in the different cold locations at a similar evolutionary speed. A high percentage of the OTUs detected here were not attributable to a given species or genus, most probably due to the small number of Antarctic microbial species deposited in public databases at present. This emphasizes the benefits of undertaking microbial biodiversity studies using these new sequencing technologies and the assembly of molecular descriptors and the corresponding species characteristics/identifiers in publicly accessible databases.
Several environmental factors (water availability and characteristics, weather, dispersal events e.g. birds, wind direction and speed) may influence the species composition of microbial communities in the polar regions (Taton et al. Reference Taton, Grubisic, Balthasart, Hodgson, Laybourn-Parry and Wilmotte2006, Jungblut et al. Reference Jungblut, Wood, Hawes, Webster-Brown and Harris2012, Magalhães et al. Reference Magalhães, Stevens, Cary, Ball, Storey, Wall, Türk and Ruprecht2012). To identify potential driving forces of cyanobacterial diversity, both the ARISA and the 454 dataset were correlated with environmental factors including geographical location, temperature and water depth. Using both methods, cyanobacterial diversity correlated best with the geographical location of each mat sample (Fig. 4 and Fig. S5 found at http://dx.doi.org/10.1017/S0954102014000145). This local distribution may be the result of individual species dispersal rates (Michaud et al. Reference Michaud, Šabacká and Priscu2012) or specific selection pressures given by individual microhabitats, e.g. nutrients, pH or salinity. The availability of freshwater and, therefore, the influence of freezing and desiccation appear to be important factors in shaping community composition (Vincent & Quesada Reference Vincent and Quesada2012). The presence of freshwater was highly dynamic at the study site, creating a flexible system of damp and desiccated cyanobacterial mats. Nevertheless, all samples were collected from benthic mats with comparable freshwater availability and light penetration that could, in agreement with the broad habitat tolerance of Antarctic cyanobacteria (Jungblut et al. Reference Jungblut, Wood, Hawes, Webster-Brown and Harris2012), explain the overall homogeneous species composition (Fig. 3a). This hypothesis is consistent with two outliers (LA7 and LE1) that were distinctly different from the others in the 454 sequencing and the ARISA. LA7 had the lowest OTU richness (8.4) and both outliers originated from distinctly different freshwater habitats, e.g. a large lake and a very cold, fast-flowing stream.
Due to the similarity of cyanobacterial communities in cold habitats, a large-scale change in environmental conditions, such as a temperature shift as a consequence of climate change, may result in similar transitions of cyanobacterial diversity and/or physiology on a global scale. Antarctic cyanobacteria are considered ‘psychrotrophs’ rather than ‘psychrophiles’ (Tang et al. Reference Tang, Tremblay and Vincent1997). Metabolic rates, nitrogen fixation and photosynthesis of Antarctic cyanobacteria are thought to be optimal at c. 15°C (Velázquez et al. Reference Velázquez, Rochera, Camacho and Quesada2011). This may also apply to secondary metabolite production, as shown in a previous study of the cyanobacterial toxin MC (Kleinteich et al. Reference Kleinteich, Wood, Küpper, Camacho, Quesada, Frickey and Dietrich2012), where it was hypothesized that cyanobacterial toxin production may be linked to diversity, through a direct effect of temperature, the presence/absence of toxin-producing species and/or increased production as a response to higher species interactions.
Acknowledgements
We acknowledge the Carl Zeiss Stiftung and the Excellence Initiative of the University of Konstanz, Germany, for funding the PhD project of JK. JK is now a BeIPD Marie-Curie COFUND research fellow at the University of Liège. We are grateful to UK Natural Environment Research Council (NERC) and British Antarctic Survey (BAS) for funding the AFI-CGS-70 grant and the field trip to Antarctica, as well as all BAS staff for their logistic and scientific support, especially the team of Rothera Research Station. FCK gratefully acknowledges further funding support from NERC (Oceans 2025 WP 4.5 and NF-3 core funding to the Culture Collection of Algae and Protozoa). We thank the Antarctic Science Bursary for funding the 454® sequencing. This research was supported by a Marie Curie International Research Staff Exchange Scheme Fellowship within the 7th European Community Framework Programme (DRD and SAW). For technical support and stimulating discussion, we are very grateful to Dr David Schleheck, Dr Dominik Martin-Creuzburg, Lisa Zimmermann, Julia Stifel, Martina Sattler and Dr Anne Jungblut. FH is supported by the Research Foundation – Flanders (FWO). We would also like to thank the reviewers for their valuable comments on the manuscript.