Introduction
Surface-enhanced Raman spectroscopy (SERS) has been considered to be one of the promising techniques in trace-level molecular detection.[ Reference Camden, Dieringer, Zhao and Van Duyne 1 ] By exciting the surface plasmon resonance on noble metal substrates, the Raman signals for low concentration molecules can be significantly enhanced. It was reported that the enhancement factor (EF) can be as high as 105–109.[ Reference He, Su, Xu, Zhong, Zapien, Li and Lee 2 , Reference Galopin, Barbillat, Coffinier, Szunerits, Patriarche and Boukherroub 3 ] Coinage metals such as Au and Ag were usually used as the preferred SERS substrate in the form of rough surface and nanoscale structures.[ Reference Tian, Ren, Li and Yang 4 – Reference Ko, Singamaneni and Tsukruk 6 ] The enhancement of Raman signal is originated from the interaction between the metallic substrate and absorbed/attached target molecules under the electromagnetic field generated by the illumination-excited substrate, attributing to the so-called localized surface plasmon resonance (LSPR) from the surface of Au or Ag nanostructures.[ Reference Luo, Li and Shi 7 ]
The main challenges in practical applications of SERS sensors lie in their low uniformity, poor reproducibility, and limited selectivity. LSPR was found to be tunable by controlling the size, shape, and distribution of nanoparticles,[ Reference Gunawidjaja, Kharlampieva, Choi and Tsukruk 8 , Reference Halas, Lal, Link, Chang, Natelson, Hafner and Nordlander 9 ] as well as using effective supporting substrate.[ Reference Li, DiStefano, Murthy, Cain, Hanson, Li, Castro, Chen and Dravid 10 , Reference Li, Cain, Hanson, Murthy, Hao, Shi, Li, Wolverton, Chen and Dravid 11 ] Accordingly, besides the development of various new techniques such as self-assembly, nano-pattering, and heterostructure design,[ Reference Zheng, Wang, Fu, Wu, Kamran, Wong and Lei 12 – Reference Wang, Jiang, Lee and He 14 ] new 2D materials, such as graphene, was recently employed as a promising substrate for uniformly dispersing the coinage metal nanoparticles to overcome those shortcuts.[ Reference Xu, Mao and Zhang 15 , Reference Li, Li, Zhou, Ma, Zheng, Duan and Qu 16 ] It is worth mentioning that graphene itself is an effective SERS substrate due to the ability to absorb and concentrate target molecules.[ Reference Xu, Ling, Xiao, Dresselhaus, Kong, Xu and Zhang 17 ] The graphene–molecule interactions result in significantly increased sensitivity based on the chemical enhancement effects and meanwhile diverse chemistry of graphene enables good molecular selectivity. Very recently the authors demonstrated unique plasmonic properties of silicon nanowire-supported Au nanoparticles or GNPs[ Reference Li, Shi, Gupta and Chopra 18 , Reference Li, Dykes, Gilliam and Chopra 19 ] and well-patterned GNP-quantum dot heterostructures[ Reference Li and Chopra 20 ] for SERS. We found that the controlled-patterning of plasmonic nanostructures on proper supporting materials provides unique approaches for achieving high reproducibility and uniformity of SERS sensors, which may lead to a promising milestone for solving above main obstacles.
Herein, we report a facile and cost-effective approach for the uniform patterning of multilayer graphene shell-encapsulated gold nanoparticles (referred as GNPs) on the Si wafer, which was further used as effective SERS substrate for the detection of a trace amount of organic dyes. First, Au nanoparticles with controlled size and inter-particle spacing were uniformly coated on the Si wafer via a galvanic (electroless) deposition followed by a high-temperature annealing. The subsequent growth of multilayer graphene shell on the Au nanoparticles was achieved using a xylene-based chemical vapor deposition (CVD) method previously reported by the authors.[ Reference Chopra, Wu and Summerville 21 – Reference Wu, Shi and Chopra 23 ] Oxygen plasma was further used to modulate the structure and thickness of the graphene shell. Finally, the Au nanoparticles- and GNP-decorated Si wafers (referred as Au nanoparticle substrate and GNP substrate, respectively) were studied for the detection of organic dyes. The influence of size and distribution of Au-nanoparticles or GNPs on the Raman enhancement ability (sensitivity) were investigated in detail. The optimized SERS substrates were further used for evaluating their selectivity.
Results and discussion
Pattering of Au nanoparticles and GNPs on Si wafer
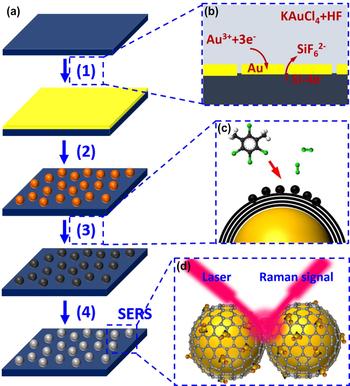
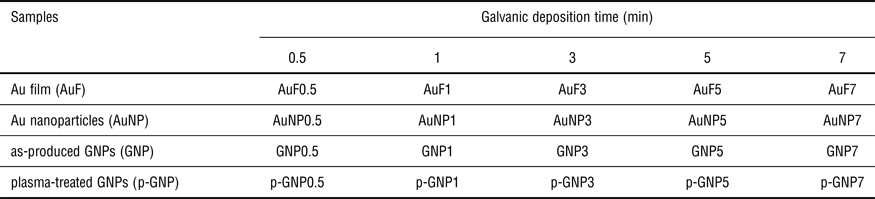
The fabrication and pattering of Au nanoparticles and GNPs on the Si wafers were conducted via the process described in Fig. 1a. The detailed experimental procedures can be found in the Supplementary information. The preparation was briefly composed of (1) galvanic deposition of Au film on the Si wafer [Fig. 1(b)], (2) annealing of the Au film to form well-dispersed Au nanoparticles, (3) CVD of multilayer graphene shell on the Au nanoparticles [Fig. 1(c)], and (4) oxygen plasma treatment of GNPs. The final product, plasma-treated GNPs, was further used as the SERS substrate for the detection of organic dyes [Fig. 1(d)]. The size and distribution of the Au nanoparticles as well as the GNPs were modulated/controlled by varying the duration of galvanic deposition in step 1 [Fig. 1(a)]. Accordingly, various Au nanoparticle/GNP samples were prepared based on the difference of the galvanic deposition duration (see Table 1).
(a) Schematic showing the procedure for the assembly of multilayer graphene shell encapsulated on Au nanoparticles (GNPs) on Si wafer: (1) galvanic deposition, (2) annealing, (3) CVD of multilayer graphene shell, (4) oxygen plasma treatment. (b–d) Schematic showing the basic principle of (b) galvanic deposition, (c) CVD, (d) molecule detection using SERS.

Labeling of various samples in this study according to different galvanic deposition time for preparing the Au film.

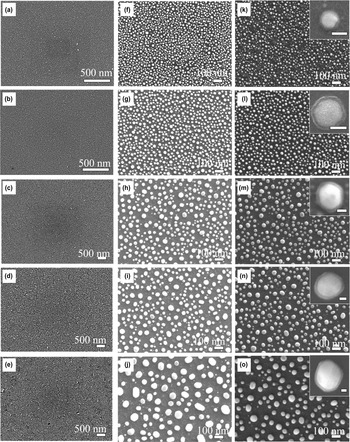
The galvanic deposition of Au film on Si wafer involves the electroless replacement reaction between Si and Au3+ in HF-containing solution [Fig. 1(b)].[ Reference Li and Chopra 24 , Reference Li and Chopra 25 ] Various Au films (AuF0.5, AuF1, AuF3, AuF5, AuF7) with different thicknesses were obtained by varying the duration of galvanic deposition [Figs. 2(a)–2(e)]. Au films were uniformly deposited on the surface of Si wafer. Galvanic deposition with a short duration [e.g., 0.5 min, 1 min, see Figs. 2(a) and 2(b)] led to small crystal grains with tiny interstices or cracks between them. When the galvanic deposition time was increased to 5 min or 7 min [Figs. 2(d) and 2(e)], the grain size was increased, and significant cracks were observed among the crystal grains. These grain cracks have been demonstrated to play a critical role during the subsequent high-temperature annealing or dewetting of Au film for the formation of Au nanoparticles.[ Reference Chopra, Wu and Summerville 21 ] In addition, it is worth noting that, compared with the evaporation and sputtering methods, the galvanic deposition method is conducted at room temperature; it only consumes Au that required to make the film; the solution is reusable and no subsequent Au recycling process is necessary. These merits make our technique proposed in this study very cost-effective and highly feasible in practice.
(a–e) SEM images of Au films prepared by galvanic deposition at various durations (AuF0.5-AuF7, see Table 1). The thickness variation as a functional of galvanic deposition time was demonstrated in Fig. S2 in the Supplementary Information. (f–j) SEM images of Au nanoparticle substrates obtained by annealing these Au films (AuNP0.5-AuNP7). (K–O) SEM images of various GNP substrates (GNP0.5-GNP7). Note: The insets in (B) and (E) show the representative SEM images for a single GNP (inset scale bar: 20 nm).

Figures 2f–2j show the SEM images of Au nanoparticles patterned on the Si wafer after annealing. The obtained Au nanoparticles are uniformly dispersed on the substrate, with size and spatial density increase as a function of galvanic deposition duration. This approach circumvented the challenges associated with the patterning of metal nanoparticles using chemical and nanofabrication techniques. The dewetting process is known to involve void/defect formation and vacancy nucleation at the interface of the Au film and the Si substrate, and is responsible for minimal surface energy and stable shape and size of the patterned nanoparticles following the Ostwald ripening mechanism.[ Reference Wu, Shi and Chopra 23 , Reference Li and Chopra 24 ] The subsequent multilayer graphene shell growth on the Au nanoparticles was conducted via a xylene-based CVD process, which involves the decomposition of xylene to carbon atoms in a high temperature reducing environment and their further deposition on the oxidized Au surface [Fig. 1(c)].[ Reference Chopra, Bachas and Knecht 22 ] The resulting GNPs patterned on the Si substrate were shown in Figs. 2k–2o. Corresponding high-resolution SEM images for these GNPs are shown in the insets (Fig. 2). GNPs were also uniformly patterned on the substrate.
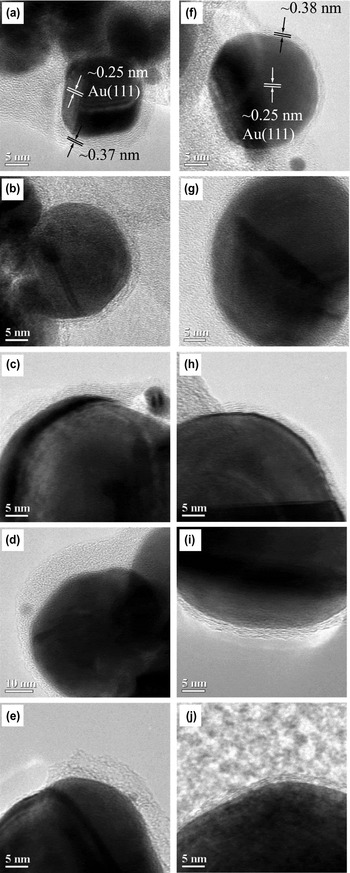
High-resolution TEM images were collected for the as-produced GNPs [Figs. 3(a)–3(e)] as well as the GNPs after plasma treatment [Figs. 3(f)–3(j)]. Low-energy Au (111) plane was consistently observed for the Au nanoparticles.[ Reference Li and Chopra 24 ] The Lattice spacing of these multilayer graphene shells was estimated to be ~0.37–0.39 nm. This value is slightly larger than the c-axis spacing of graphite (~0.34 nm), indicating the curvature structure of graphene shell introduces strain in the lattice and influences the atomic arrangement.[ Reference Wu, Shi and Chopra 23 ] It is worth mentioning here that the as-produced GNPs are highly hydrophobic due to lack of surface functionalities and the presence of amorphous carbon by-product from the CVD process. The former characteristics are also not favorable for the physical adsorption of molecules using a water-based solution. Thus, a subsequent plasma treatment of the as-produced GNPs will render them hydrophilic due to the formation of carboxylic and hydroxyl groups.[ Reference Li, Shi and Chopra 26 ] In addition, this process is also known to remove amorphous carbon from the GNP surface.[ Reference Li and Chopra 24 , Reference Li and Chopra 25 ] TEM images of GNPs after plasma treatment are shown in Figs. 3f–3j. This plasma treatment has a significant etching effect on the thickness of the graphene shells, however, has no obvious influence on the lattice structure of the Au nanoparticles and the graphene shells.
TEM images of the (a–e) as-produced GNPs (GNP0.5-GNP7) and (f–j) Plasma-treated GNPs (p-GNP0.5—p-GNP7).

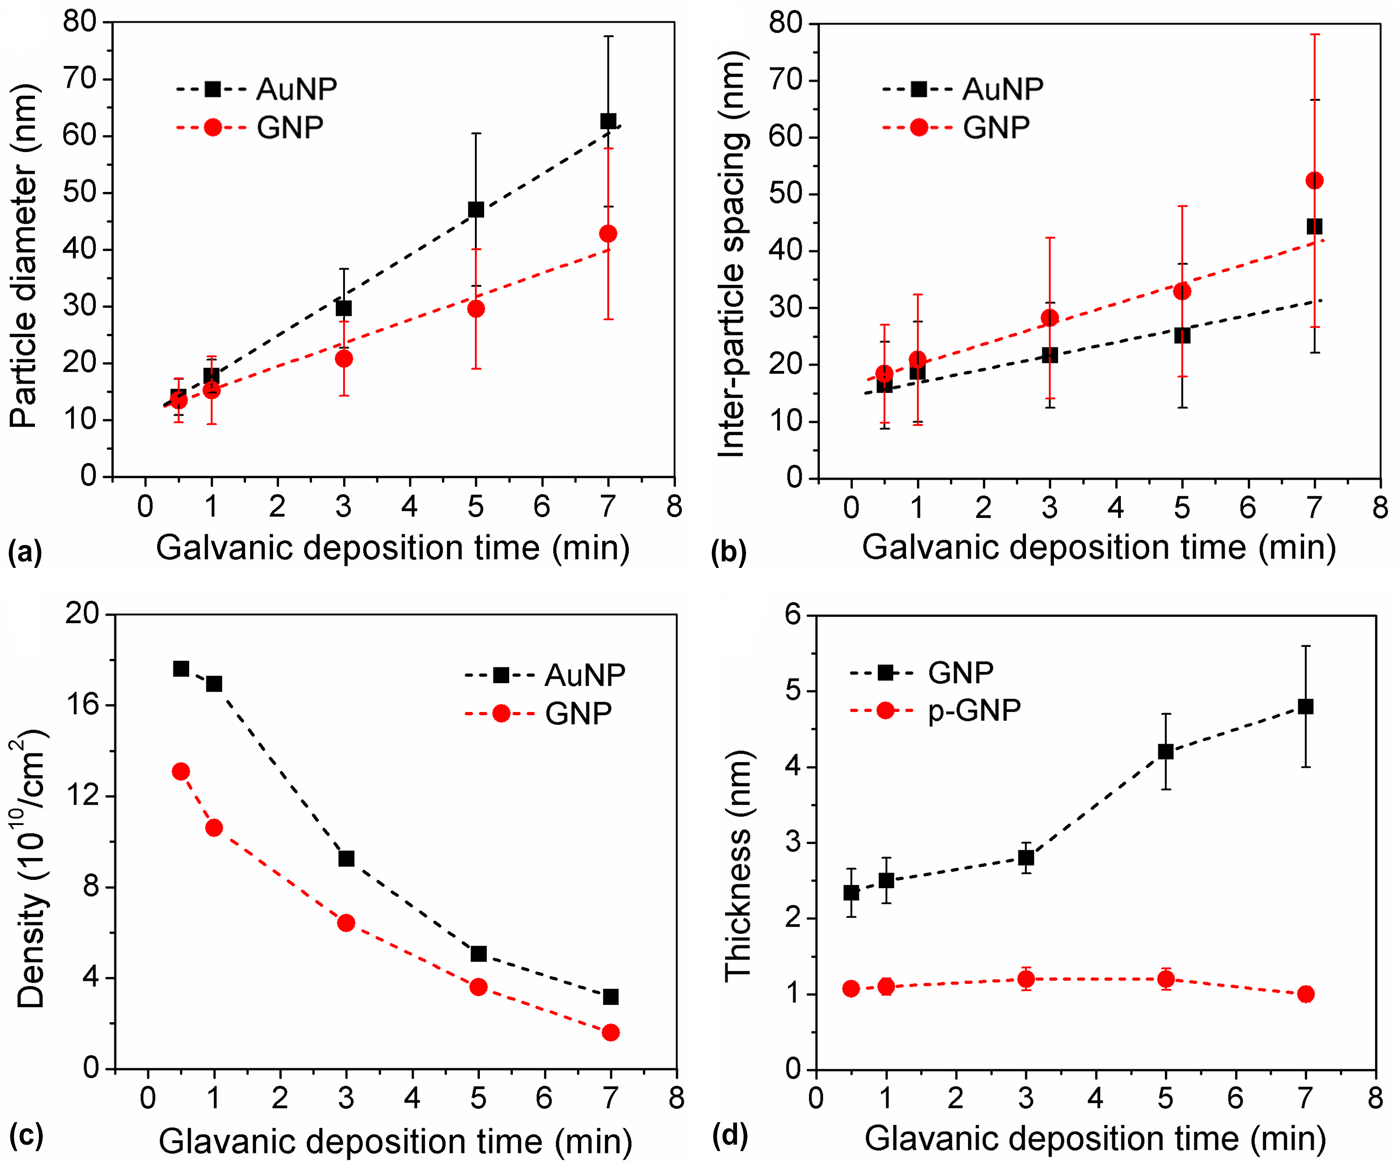
The variation of size, inter-particle spacing, and spatial density of Au nanoparticle and GNP samples as a function of the galvanic deposition time (or Au film thickness, Fig. S2) were estimated from SEM images shown in Fig. 4. The size of Au nanoparticles and GNPs [Fig. 4(a)] increased linearly with galvanic deposition time. This could be attributed to the fact that dewetting of thicker Au films that led to the bigger nanoparticle.[ Reference Chopra, Wu and Summerville 21 ] The average size of Au nanoparticles is larger than the corresponding GNPs, which is probably due to the inevitable evaporation of Au nanoparticles during the high-temperature CVD process. The increase of standard deviations for both Au nanoparticles and GNPs could be due to the effect Ostwald's ripening and surface migration. This is again confirmed by the and linearly increasing trends for of inter-particle spacing [Fig. 4(b)]. The spatial density of Au nanoparticles decreased as the increase of galvanic deposition time, indicating the dewetting of Au film during the annealing has a large dependence on the film thickness. This is mainly due to the inter-grain cracks formed during the galvanic deposition [Figs. 2(a)–2(e)], which actually divided the Au film into numerous of micro-islands, and finally determined the size of Au nanoparticles. The spatial density of GNPs was smaller as compared with the corresponding Au nanoparticles.
Variation of (a) particle size, (b) inter-particle spacing, and (c) particle density for the Au nanoparticles and GNPs according to the galvanic deposition time. (d) Variation of the thickness of multilayer graphene shell before and after oxygen plasma treatment.
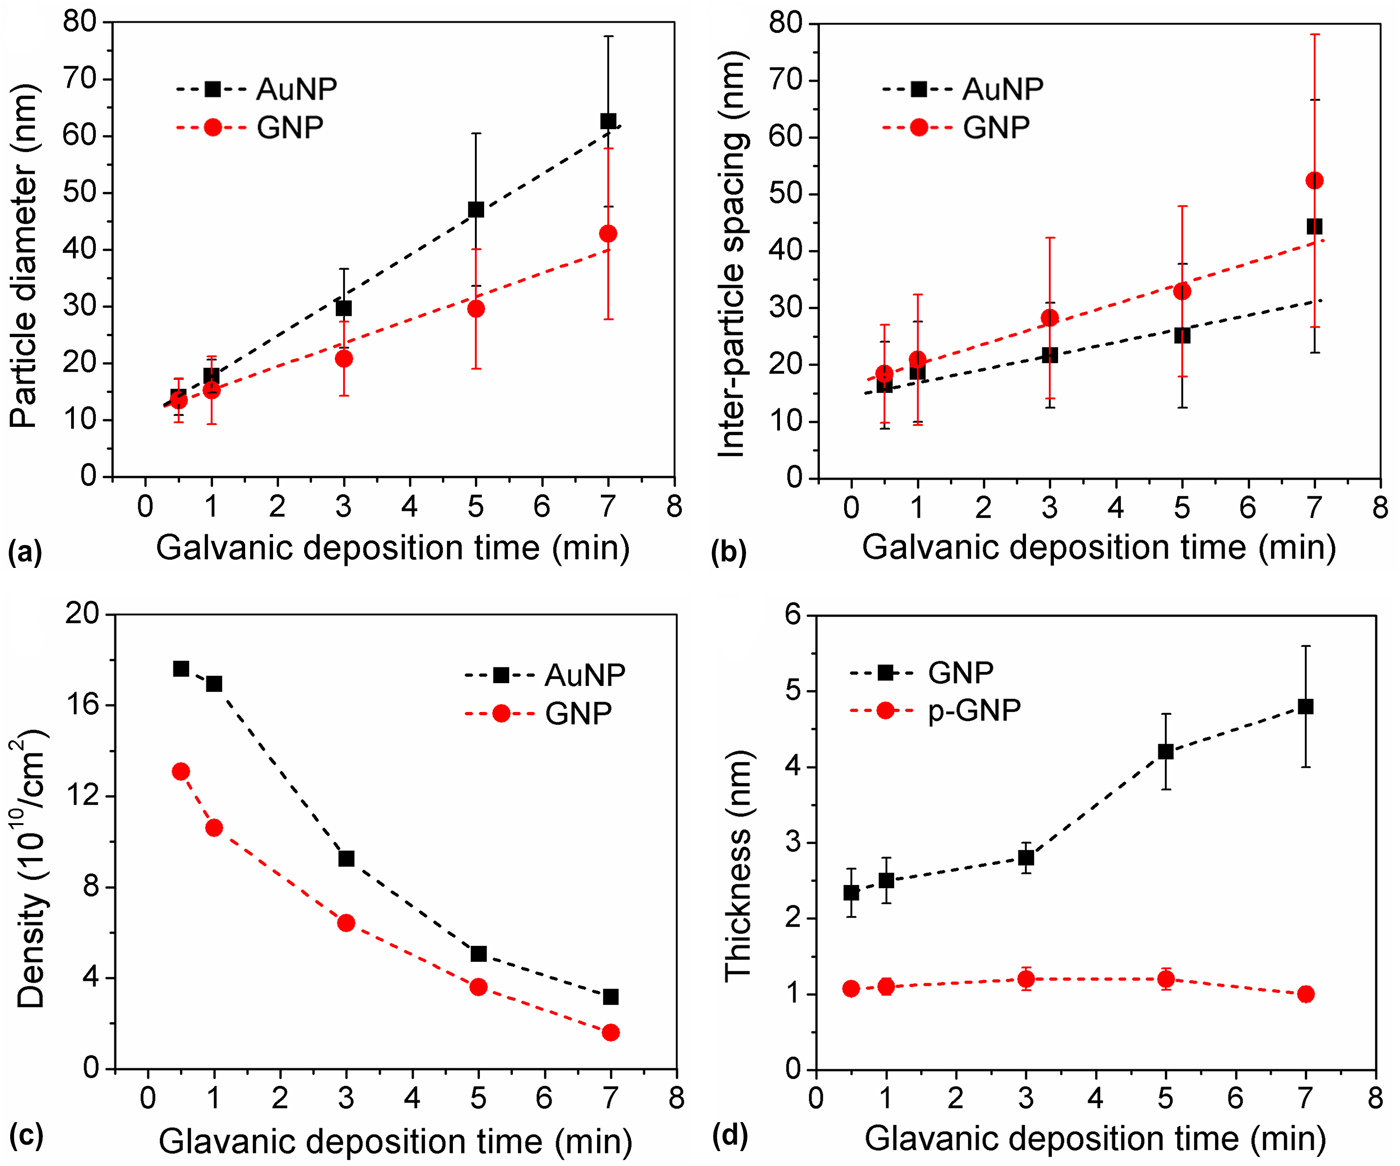
The variation of multilayer graphene shell thickness before and after plasma treatment was demonstrated in Fig. 4d. With the increase of particle size, the shell thickness for the as-produced GNPs presents a corresponding increase trend.[ Reference Chopra, Wu and Summerville 21 ] In addition, we observed that thicker shells on larger-sized GNPs incorporate more amorphous carbon content. Thus, after plasma treatment, a significant reduction in shell thickness was observed on those larger GNPs, which is probably attributed to the presence of more amorphous carbon. However, it is worth noting that there is only a minor change in shell thickness for all GNPs samples after plasma treatment, irrespective of the GNP size.
SERS sensing on the patterned substrate
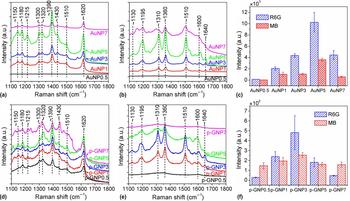
The Si wafers patterned with Au nanoparticles (AuNP0.5—AuNP7, see Table 1) or plasma-treated GNPs (p-GNP0.5—p-GNP7, see Table 1) were used as the SERS substrate for organic dye detection. (Rhodamine 6G) R6 G and (methylene blue) MB were used as the Raman probes (~10−6 M in water). The representative Raman spectra were shown in Fig. 5. As shown in Figs. 5a and 5b, Si wafer with small Au nanoparticle (AuNP0.5) has no obvious signals for R6 G and MB. However, the Raman signals increased as the increase of particle size [AuNP1 and AuNP3, see Fig. 5(c)]. This is consistent with the theoretical modeling of plasmonic properties of the Au nanostructures reported previously.[ Reference Jain, Lee, El-Sayed and El-Sayed 27 , Reference Lee and El-Sayed 28 ] Such plasmonic modeling indicates that the electric field generated on or near the surface of Au nanostructures has a large size dependence. With the increase of particle size, the electric field generated on the particle surface was significantly enhanced.
(a, b) Raman spectra of (a) R6 G and (b) MB collected on various Au nanoparticle substrates. (c) Average Raman intensity of R6 G and MB corresponding to A and B. (d, e) Raman spectra of (d) R6 G and (e) MB collected on various GNP substrates. (f) Average Raman intensity of R6 G and MB corresponding to D and E. Note: The peak locations (cm−1) were marked on the top of these spectra. The Raman intensity of R6 G was estimated to the peak centered at ~1360 cm−1 and that of MB was estimated using the peak centered at 1390 cm−1.

Another reason for the observed Raman enhancement can be attributed to the overlapping of the electric field generated from two or more Au nanoparticles,[ Reference Xu, Jeon, Mack, Doorn, Williams, Han and Wang 29 ] which resulted in significantly co-enhanced LSPR. This explains the observation that decreased Raman signals were observed on the Au nanoparticle substrate with further increased size and inter-particle spacing (AuNP5 and AuNP7), which has less overlapping of the electric field. A similar trend was observed for the signal variation on the plasma-treated GNP samples in this study. As shown in Fig. 5d, small p-GNP substrate (p-GNP0.5) only showed the well-defined G-band and D-band for graphene shells.[ Reference Malard, Pimenta, Dresselhaus and Dresselhaus 30 ] The highest Raman enhancement was observed on p-GNP3. Further increase of the p-GNP size led to weakened Raman signals similar to that observed on Au nanoparticle substrate. However, for the detection of MB on the p-GNP substrate [Fig. 5(e)], p-GNP3 exhibited the highest Raman signal but equivalent Raman enhancement was also observed for the other samples. This is mainly due to the effective absorption of MB molecules on the graphene shells.[ Reference Lu, Li, Liusman, Yin, Wu and Zhang 31 ] In addition, the overall Raman signals observed on the p-GNP substrate is much weaker than that on the Au nanoparticle substrate [Figs. 5(c) and 5(f)], which is mainly due to the less absorption of dye molecules on p-GNPs.
It is also worth mentioning that the average intensity in Figs. 5c and 5f was collected from more than 10 spots on each individual substrate. The minor standard deviation values on each column indicate a good uniformity on these SERS substrates. The variation of Raman signal enhancement as a function of dye (MB) concentration in DI-water was further demonstrated. The obtained Raman spectra were shown in Figs. S3a and S3b for Au nanoparticles and p-GNPs, respectively. The average Raman intensity with standard deviation was estimated using the peak located at 1390 cm−1. One can observe that the Raman intensity presented an approximate linear trend as a function of the logarithm of MB concentrations (Fig. S3c), indicating a good reproducibility of our galvanic deposition—annealing—CVD approach. Meanwhile, such linear trend will be of great importance as the calibration curve for the practical application of SERS device in molecule detection.
Selectivity and EF
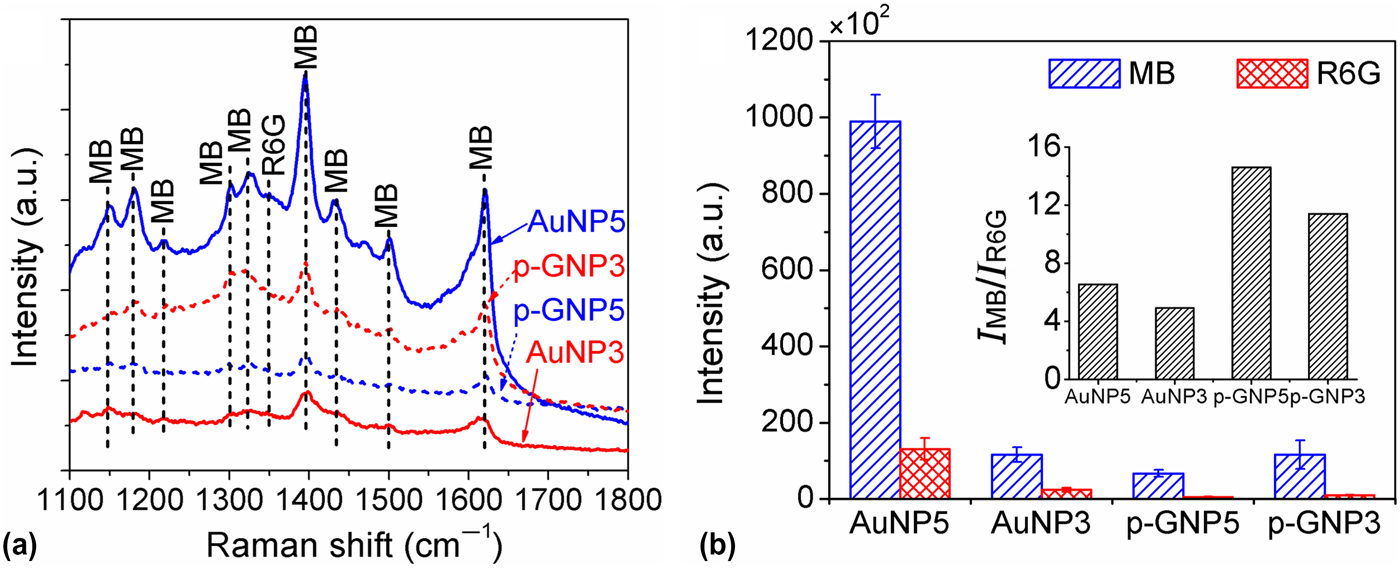
The selectivity of Au nanoparticle and p-GNP substrates for the detection of R6 G and MB was demonstrated in a mixture solution of 10−6 M MB and 10−6 M R6G. The substrates were immersed in the mixture overnight for the competitive absorption of R6 G and MB molecules. The selectivity test was conducted on sample AuNP3, AuNP5, p-GNP3, and p-GNP5 because they exhibited the highest Raman enhancement among all the samples. The obtained Raman signals for R6 G and MB were shown in Fig. 6a. The Raman signals observed are mainly corresponding to MB while the signals for R6 G are very weak. This is mainly attributed to the sulfur (S) component in the MB molecule structure, making it much more favorable to absorb on Au surface due to the natural affinity of Au and S. The Raman intensity was estimated according to the peak at 1360 cm−1 for R6 G and 1390 cm−1 for MB [Fig. 6(b)], which were further used to generate to intensity ratio as shown in the inset. One can observe that the selectivity of p-GNP substrate is much higher than that of Au nanoparticle substrate. This is probably because MB has a simpler and more flexible aromatic structure as compared with R6 G and are preferred to be absorbed on the surface of graphene with proper orientation according to the well-defined π-π stacking.[ Reference Björk, Hanke, Palma, Samori, Cecchini and Persson: 32 , Reference Yang, Chen, Chang, Cao, Liu and Wang 33 ]
(a) Raman spectra of MB and R6 G obtained on Au nanoparticle substrate and GNP substrate after molecule absorption in a mixture of 10−6 M R6 G and 10−6 M MB. (b) Average Raman intensity MB and R6 G corresponding to A. The inset further shows the intensity ration of MB and R6G.

The evaluation of EF is based on the well-defined equation as follows:
 $${\rm EF} = \displaystyle{{I_{{\rm SERS}}/N_{{\rm SERS}}} \over {I_{{\rm bulk}}/N_{{\rm bulk}}}}$$
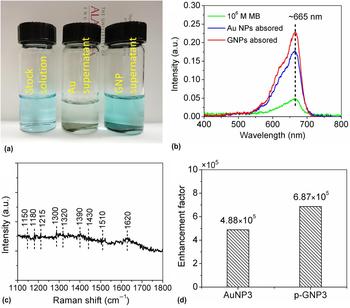
where I SERS and I bulk indicate the Raman intensity obtained on Au nanoparticle or p-GNP substrate and that obtained on the bulk MB solution, meanwhile, N SERS and N bulk indicate the account of molecules on the Au nanoparticle or GNP substrate and the bulk MB solution that are used for generating Raman signal. The Au nanoparticle or GNP substrate was incubated in 10−6 MB solution overnight for molecule absorption. The concentration of MB solution after absorption was measured using UV-vis spectroscopy and that was further used to estimate the number of molecules absorbed on the substrates. Figure 7a shows the digital image of 10−6 M MB solution before and after the absorption using Au nanoparticle or p-GNP substrate. The color of solution (2) after the absorption on Au nanoparticle substrate became light, indicating the intensive absorption of MB molecules. Meanwhile, the absorption on the GNP substrate is much less since no significant color change was observed for solution (3) as compared with the pristine 10−6 M MB solution (1). This was further confirmed by the UV-vis spectra in Fig. 7b. As the peak intensity for solution (2) is much weaker than that of the other two. The Raman signal of the bulk MB solution (10−6 M) was shown in Fig. 7c. The signals for such bare solution (without SERS substrate) was very weak, which further confirms the effective Raman enhancement observed above. The EF for sample AuNP3 and GNP3 were further estimated using Eq. (1). As shown in Fig. 7d, the resulting EF is 4.88 × 10⁵ for AuNP3 (Au nanoparticle substrate) and 6.87 × 10⁵ for p-GNP3 (plasma-treated GNP substrate), respectively. This EF calculation is of great importance since they indicate that p-GNPs actually have better Raman enhancement than the Au nanoparticles. The higher experimental Raman intensity observed for Au nanoparticle substrate is mainly due to the large number of molecules absorbed on their surface. The EF result is consistent and further confirms the main hypothesis of this paper that Au nanoparticles with encapsulated graphene shell are able to combine the electromagnetic enhancement mechanism and the chemical enhancement mechanism and exhibit favorable Raman enhancement is SERS-based chemical sensors.
(a) Digital image showing (1) stock solution (10−6 M MB solution), (2) Au supernatant (MB solution after molecule absorption on the Au nanoparticle substrate), and (3) GNP supernatant (MB solution after molecule absorption on GNP substrate). (b) UV-vis spectra of MB solution corresponding to (a). (c) Representative Raman spectra of 10−6 M MB in DI-water. (d) Calculated enhancement factor for Au nanoparticle substrate and GNP substrate.

Conclusions
A unique approach for uniform assembly of multilayer graphene shell-encapsulated Au nanoparticles (GNPs) on the Si substrate and their further application in SERS-based chemical sensors is demonstrated in this paper. The proposed galvanic deposition—annealing method led to self-patterning of uniformly distributed Au nanoparticles on Si substrate with controlled size and inter-particle spacing. The subsequent encapsulation of Au nanoparticle with multilayer graphene shell could be successfully achieved via the xylene-based CVD. The SERS sensitivity, uniformity, and selectivity of such Au nanoparticle substrate and GNP substrate were further evaluated. The results indicated both the Au nanoparticle substrates and GNP substrates exhibited good SERS uniformity. Due to their different affinity to different molecules, these two substrates possess promising molecular selectivity. The GNP substrate expressed higher Raman EF than Au nanoparticle substrate due to the combination of both electromagnetic mechanism and chemical mechanism. To sum up, this study introduces a unique methodology for the controlled patterning of Au nanoparticles and GNPs on Si substrate and further provides fundamental knowledge for the practical application of such Au nanoparticle/GNP substrate in SERS-based chemical sensors.
Supplementary material
The supplementary material for this article can be found at https://doi.org/10.1557/mrc.2018.9
Acknowledgments
This work was funded by National Science Foundation (NSF award #: 0925445), NSF-EPSCoR RII award, and Research Grant Committee awards to Dr. Chopra. The authors thank Dr. S. Kapoor for proof reading the manuscript.