Introduction
“Brava de Lide” is a Portuguese cattle breed with great significance beyond its home borders because of bullfighting in Spain using Portuguese bulls. The breed owes its name to its aggressive character, unwilling to be domesticated and resisting to forms of traditional management, i.e. its behaviour is not gregarious and rebellious with no natural tendency to subjection by man (Lucas, Reference Lucas2004). For their leadership, technical and aesthetic parameters are applied that embody the bullfighting, the main objective for the existence of these animals (Lucas, Reference Lucas2004). As regards its ethnic framework, the breed Brava de Lide is affiliated to the evolutive branch Black Orthoide, having had its origin in the evolutionary path of the North African domestic cattle (Alves, Reference Alves2004; Cymbron et al., Reference Cymbron, Freeman, Malheiro, Vigne and Bradley2005; Mateus, Reference Mateus2008) having been established in Portugal in Prehistoric times (Felius, Reference Felius1995; Anderung et al., Reference Anderung, Bouwman, Persson, Carretero, Ortega, Elburg, Smith, Arsuaga, Ellegren and Götherström2005; Bollongino et al., Reference Bollongino, Edwards, Alt, Burger and Bradley2006; Ginja, Gama and Penedo, Reference Ginja, Gama and Penedo2009a ). Indeed, the discovery of mtDNA haplotypes of African origin in several varieties of the Spanish Fighting Bulls (Cortés et al., Reference Cortés, Dunner, García-Atance, García and Cañón2007), and more recently in the Portuguese “Brava de Lide” (Ginja et al., Reference Ginja, Penedo, Melucci, Quiroz, Martínez López, Revidatti, Martínez-Martínez, Delgado and Gama2009b ) could substantiate this hypothesis. The “Brava de Lide” breed is bred in large farms designated as ganadarias, avoiding as much as possible any contact with humans. In 2012, the Portuguese Association of Breeders of the Lide Bulls contemplated 104 ganadarias (Lucas, personal communication), distributed through the Alentejo, Ribatejo and Oeste, Beira Interior and Beira Litoral, the oldest of which was established in 1843 (Lucas, Reference Lucas1996, Reference Lucas2004). The unique production system, along with a very diverse product demand depending on the type of celebration, has given rise to a characteristic population structure, divided into lines or castes, even in herds within castes. The increasing import into Portugal of the main castes of the Spanish Fighting Bulls has led to the disappearance of the true Portuguese “Brava de Lide” breed. However, there is a ganadaria, the oldest in Portugal, the ganadaria Vaz Monteiro, which has remained faithful to the breeding of genuine Portuguese bulls of “Brava de Lide”.
The objectives of this study are to study the genetic diversity and the substructure in the “Brava de Lide” breed using 30 microsatellite markers and to evaluate the hypothesis that the animals of ganadaria Vaz Monteiro are really different from other bulls of Lide raised in Portugal. Moreover, we also draw attention to those responsible for the importance of conserving the genetic diversity of the cattle breed “Brava de Lide”.
Material and methods
Animals
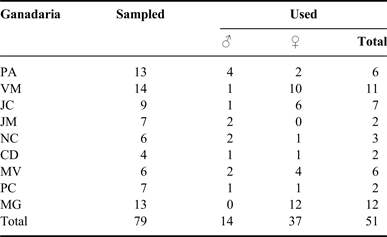
In this work, 51 pure animals, registered in the Herd Book of the “Brava de Lide” breed sampled in nine ganadarias, were used. This included ganadaria Palha (PA) (n = 6), ganadaria Vaz Monteiro (VM) (n = 11), ganadaria Jorge Carvalho (JC) (n = 7), ganadaria Jorge Mendes (JM) (n = 2), ganadaria Nuno Casquinha (NC) (n = 3), ganadaria Cabral D'Ascenção (CD) (n = 2), ganadaria Mário Vinhas e Herdeiros de Manuel Vinhas (MV) (n = 6), ganadaria Paulo Caetano (PC) (n = 2) and ganadaria Murteira Grave (MG) (n = 12). It should be noted that of those ganadarias referred to here, where only two animals were included is owing to the fact that these ganadarias have only two paternal lines. It is not preferable to use highly related animals in diversity studies and, therefore, only two animals, one as reference to one of the parental lines and the other as a son of the other paternal line, were used. Table 1 summarizes the sampled procedures.
Sampling origin.

Microsatellites
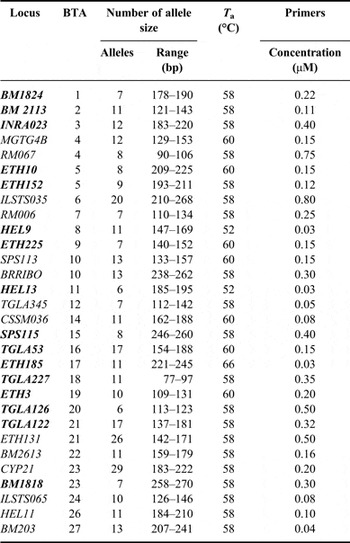
The microsatellites used were BM1824, BM2113, BM2613, BM1818, BM203 RM067, RM006, ETH131, ETH10, ETH225, ETH152, ETH185, ETH03, ILSTS035, ILSTS065 HEL9, HEL13, HEL11, SPS113, SPS115, TGLA345, TGLA53, TGLA227, TGLA126, TGLA122, BRRIBO, INRA023, MGTG4B, CSSM036 and CYP21.
Polymerase chain reaction (PCR) conditions and detection of PCR products
Microsatellite markers were combined in multiplex-PCRs using fluorescently labelled primers and amplified in 12.5 µl reaction volume containing 2.5 mM MgCl2, 200 µM DNTPs, 50–100 ng template DNA, 0.5 U Taq polymerase and primers at the appropriate concentration (Table 2). The plates containing the DNA template, the primers multiplexes and 20 µl of Chill-out were initially incubated at 90 °C for 5 min. Subsequently, the temperature was reduced to 85 °C and held for 10 min for the addition of the remaining reagents prepared together. Amplification was done with five cycles of 1 min at 94 °C, 30 s at specific annealing temperatures (Table 2) and 30 s at 72 °C followed by 25 cycles where the denaturation step at 94 °C was reduced to 45 s. We carried out a final 30 min extension. PCR products were separated in denaturing polyacrylamide gels run on ABI 373 DNA Sequencers (Applied Biosystems, Foster City, CA, USA). Fragment size analysis was performed with the STRAND software (Hughes, Reference Hughes2000). The internal size standard GeneScan TM-ROX 350 (PE-Applied Biosystems, Warrington, UK) was used for sizing alleles. In addition, sample no. 1 from the International Society for Animal Genetics (ISAG) 1997/98 comparison test was used as the reference to standardize allele sizes.
Microsatellites used, its autossomic location, number of alleles detected, allele size range, temperature of annealing and primers concentration.

Microsatellites included in the FAO–MoDAD programme are given in bold.
Data analysis
Allele frequencies for all locus population combinations are obtained with the Fstat Program 2.9.3 (Goudet, Reference Goudet2001), while the number of population-specific alleles (Private-Alleles, PA) was counted manually. To test whether the populations were in Hardy–Weinberg equilibrium (HWE, Ho: random union of gametes) exact tests were performed using the program GENEPOP version 4.0 (Raymond and Rousset, Reference Raymond and Rousset1995b ). The non-biased estimates of the exact P value were obtained by Markov chain Monte Carlo developed by Guo and Thompson (Reference Guo and Thompson1992). The excess or deficiency in heterozygosity for each locus in each population was analysed using a U-test (Rousset and Raymond, Reference Rousset and Raymond1995). To test the between population differentiation, the null hypothesis was Ho: the alleles were taken from the same distribution in all populations and the test used to reject or accept the null hypothesis was the G-test (Raymond and Rousset, Reference Raymond and Rousset1995a ). The test was repeated for differentiation of populations, but considering population pairs. For all those tests, the Markov chain parameters chosen were: dememorization 100 00, batches 2 000 and 5 000 interactions per batch. For each population the level of significance was adjusted by a strict Bonferoni procedure for multiple comparisons, which allowed us to reduce type II errors (Weir, Reference Weir1996).
The classical genetic diversity parameters were calculated by the GENETIX program, version 4.05.2 (Belkhir et al., Reference Belkhir, Borsa, Goudet, Chikhi and Bonhomme1998). Thus, the average observed and unbiased expected heterozygosities within the breeds and the total and mean number of alleles were calculated per population, with a correction being made to these two last parameters with all the possible combinations of two animals (smaller size of an analysed sample) within each ganadaria. The Fstat program (2001) allowed us to calculate the inbreeding coefficient (F IS), the gene diversity and the allelic richness.
The population structure was evaluated using the parameters of hierarchical F-statistics (F ST, F IT, F IS) estimated according to those proposed by Weir and Cockerham (Reference Weir and Cockerham1984) and implemented in the Fstat program, version 2.9.3.2. (Goudet, Reference Goudet2001). The null hypothesis (Ho): the estimates are not significantly different from zero was tested using permutations as proposed by Goudet (Reference Goudet2001). To test the F IS(f), the alleles were exchanged between individuals within populations. To test the F IT(F), the alleles were exchanged between populations. Finally, to test the F ST(θ) individuals were exchanged between populations. The F ST parameter that measures the proportion of different alleles between all population pairs was also calculated.
To have an idea of the degree of genetic separation between the ganadarias studied, the D A genetic distances between all pairs of populations using the Populations program (Langella, Reference Langella2002) were also calculated.
Multivariate analysis of correspondences
The graphical representation of genetic relationships among a group of individuals can be obtained through multivariate techniques, which can condense the variance of allele frequencies of loci analysed in a set of two, three or four synthetic variables. The factorial analyses of correspondences allowed us to see what the dispersion of the individuals in the space defined by the three major hypergeometric axes, depending on the variance of its allele frequencies and, thus, analyse whether or not there is some kind of substructure within a population and to see the genetic differences among all the individuals analysed. The analysis of correspondence was performed using the module AFC (Analyse Factorielle Correspondance) implemented by the GENETIX program (Belkhir et al., Reference Belkhir, Borsa, Goudet, Chikhi and Bonhomme1998).
Analyse with the STRUCTURE Program
The structure of the Brava the Lide was also analysed using the STUCTURE Program, version 3.0 (Pritchard, Stephens and Donnelly, Reference Pritchard, Stephens and Donnelly2000) to estimate the number of population clusters (K), more likely among the nine ganadarias studied. Data were analysed using the Alpha and Lambda parameters defined by the default program. The definition of clusters was based on the admixture model and the assumption that allele frequencies were correlated between the breeds, as is convenient for closely related populations. To estimate the K value (number of population clusters inferred by the data), its value was made to vary between K = 1 and K = 10 and the program set to run with a Burn-in of 50 000 and a number of MCMC repetitions after burn-in of 200 000. It was empirically determined that these values for the size of the run were enough to ensure the convergence of the parameters to be estimated (Pritchard and Wen, Reference Pritchard and Wen2003). For each value of K, ten runs were performed, the most likely value of K was determined by the highest average of the maximum likelihood of the data (Ln P(D)) with smaller variance. The STRUCTURE program was used to allocate individuals to their population of origin, using the strict Bayesian method implemented by the program. To determine the number of animals classified in each cluster a run was made with a longer burn-in of 100 000 and a number of repetitions of MCMC after a burn-in of 1 000 000 for the most likely value of K.
The percentage of individuals classified in each cluster was determined by considering the estimated proportion of the association of each individual genotype (Q) to each of the clusters. The percentage of subjects not included in their population of origin and misclassified in other cluster population was also calculated. Tests of individual allocation were also performed by the STRUCTURE program using a priori information about the source population of individuals, as the subjects were sampled from bull farmers with a specific breeding program and a specific reproductive program. The run had the same characteristics as before, with the K being equal to 9 because nine was the number of the sampled ganadarias.
Results
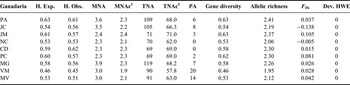
The diversity parameters are shown in Table 3 where one can observe that the average expected and observed heterozygosity was relatively low when compared with all other Portuguese cattle breeds (Mateus et al., Reference Mateus, Penedo, Alves, Ramos and Rangel-Figueiredo2004; Ginja, Gama and Penedo, Reference Ginja, Gama and Penedo2010). The expected heterozygosity ranged from its highest value observed in ganadaria Palha (0.627) and the minimum value observed in ganadaria Vaz Monteiro (0.461). Regarding the observed heterozygosity, it ranged from a maximum of 0.617 observed in ganadaria Cabral D'Ascenção and a minimum of 0.448 observed in the ganadaria Vaz Monteiro. Incidentally, the ganadaria Vaz Monteiro was the one that systematically showed the lower variability (MNAc, TNAc, Gene Diversity and Allelic Richeness). The F IS values were all close to zero, an indication that in the ganadarias studied, an excess or a deficiency in heterozygotes did not exist, which would be confirmed by tests carried out by the Genepop program regarding the excess and deficiency of heterozygotes, with all P values being not significant. All loci and population combinations are in HWE.
Summary of genetic diversity parameters, including, the observed and expected heterozygosity, total (TNA) and mean number (MNA) of alleles, mean (MNAC) and total (TNAC) number of alleles corrected for the size of the smaller sample, number of private alleles (PA), gene diversity and allelic richness, inbreeding coefficient (F IS) and deviations from Hardy–Weinberg equilibrium (Dev. HWE) observed among the ganadarias studied.

1Average of all possible combinations of two animals within each ganadaria.
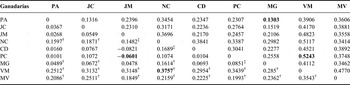
The D A genetic distances and the coefficient of genetic differentiation (F ST) are shown in Table 4. In general, all D A genetic distances are relatively larger than those found among all populations of the Portuguese cattle (Mateus et al., Reference Mateus, Penedo, Alves, Ramos and Rangel-Figueiredo2004; Mateus, Reference Mateus2008), indicative of the large genetic separation between the nine ganadarias studied. The largest D A genetic distance was found between the ganadarias Vaz Monteiro and Paulo Caetano, while the shortest D A distance was established between the pair Murteira Grave and Palha. In what concerns the coefficients of genetic differentiation F ST, the maximum has been established between ganadarias Vaz Monteiro and Nuno Casquinha, while the minimum was found between the pair Jorge Mendes and Paul Caetano. Regarding the genetic differentiation among the nine ganadarias studied, the global test was significant at least for all loci population combinations, having the P value varied between zero and 0.00149, which allowed us to reject the null hypothesis: the alleles are drawn from the same distribution in all populations. But when the populations were considered in pairs (Table 4), the ganadarias that showed the highest degree of genetic differentiation were the ganadarias Vaz Monteiro and Mário Vinhas with both presenting highly significant P values for all other ganadarias. The other two ganadarias that showed considerable degree of genetic differentiation were the ganadarias Nuno Casquinha and Murteira Grave, being the first to obtain P values between very and highly significant for all other ganadarias except for ganadaria Paulo Caetano, while ganadaria Murteira Grave also presented P values between very and highly significant for all other ganadarias with the exception of ganadarias Jorge Mendes and Cabral D'Ascension.
D A genetic distances above the diagonal F ST between pairs below the diagonal.
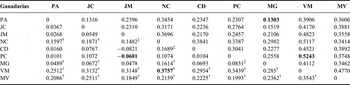
Bold values indicates the maximum and minimum DA genetic distance and the highest and lowest F ST values.
‡ P < 0.01.
† P < 0.001.
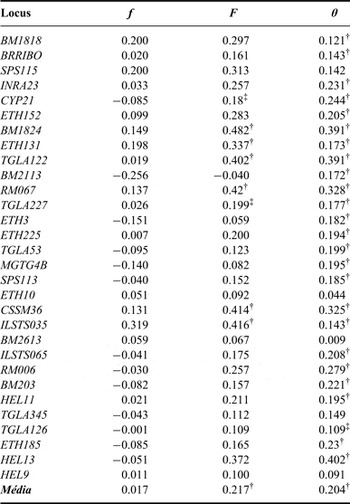
The Wright estimators of genetic differentiation F IS(f) F IT(F) and F ST(θ) are presented in Table 5. None of the estimates of the inbreeding coefficient f was significantly different from zero. The levels of the genetic differentiation θ obtained by locus were relatively high and ranged between 0.009 and 0.402 for locus BM2613 and HEL13, respectively. For all the loci analysed, estimates of θ were highly significant different from zero (P < 0.001) except for the loci SPS115, ETH10, BM2613 and TGLA345, HEL9. The locus TGLA126 was only significantly (P < 0.05) different from zero. The average proportion of genetic variation explained by differences among ganadarias was 20.4 percent, which is considerably high when compared with the variation observed among all populations of the Portuguese cattle (Mateus et al., Reference Mateus, Penedo, Alves, Ramos and Rangel-Figueiredo2004; Mateus, Reference Mateus2008; Ginja Gama and Penedo, Reference Ginja, Gama and Penedo2010). The remaining variation was attributed to individual differences existing within each of the studied ganadarias.
Indices of Wright of genetic differentiation for the ganadarias studied.

† P < 0.001.
‡ P < 0.05.
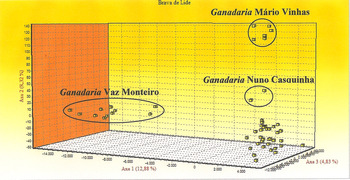
The outcomes of the factorial analysis of correspondence to the “Brava de Lide” breed is shown in Figure 1. As can be seen, the “Brava de Lide” breed shows a clear substructure among the individuals, which justified their grouping into four well-defined clusters. It was interesting to note that the cluster at the bottom left of Figure 1 was exclusively composed by animals sampled in ganadaria Vaz Monteiro, considered by the bullfighting experts as the most Portuguese of all bull farmers in the country. In turn, the cluster located in the upper right side of Figure 1 consists of animals sampled in ganadaria Mário Vinhas e Herdeiros de Manuel Vinhas and the cluster formed in the middle upper side comprehends two animals sampled in ganadaria Nuno Casquinha. All other animals are grouped in the fourth cluster that appears at the bottom right side of the space defined by the three main axes of the FCA.
Factorial correspondence analysis carried out on the “Brava de Lide” Breed.

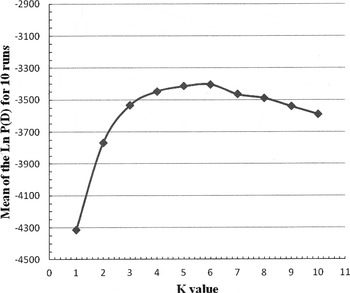
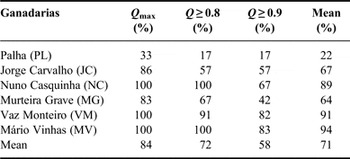
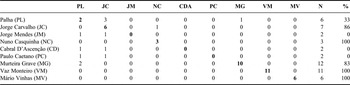
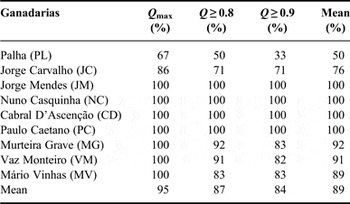
Runs originally made with the STRUCTURE program with no information regarding the source populations of the animals allowed us to define the most probable value of K and identify the population clusters that best explain the partitioning of all data analysed. The Ln P(D) increased as the K values increased, but tended to its maximum value when K was equal to 6, followed by a sharp decline, which remained constant for the remaining values of K tested (Figure 2). The results of the longest run performed with the STRUCTURE program without information on the population of origin of animals with K = 6 is summarized in Table 6. When the assignment to a cluster was defined as the most likely value of the occurrence of its genotype in this cluster (Q max), the percentage of correctly classified individuals in their population of origin ranged from 33 percent in ganadaría Palha to 100 percent in ganadaria Nuno Casquinha, Vaz Monteiro e Mário Vinhas. The other ganadarias to be identified by the program as having distinct populations were the ganadarias Jorge Carvalho and Murteira Grave. Table 7 summarizes the individuals correctly classified and misclassified in other clusters. As can be seen, the ganadaria Palha was the one with more misclassified individuals, three of them were classified as belonging to ganadaria Jorge Carvalho and one as belonging to ganadaria Murteira Grave. All the animals of the ganadaria Nuno Casquinha Vaz Monetiro e Mário Vinhas are correctly classified in their respective population of origin and with high Q values.
Average value of Ln P(D) for ten runs without information regarding the source populations of the animals.

Allocation of individuals for the longest run with STRUCTURE without the information regarding the source population of the animals and K = 6.

Individuals correctly classified and misclassified in other clusters made with the STRUCTURE program without knowing the source population of the animals and with K = 6.

Bold values indicates the animals correctly classified in his respective cluster.
When the allocation of individuals was performed with the STRUCTURE program with prior knowledge of the source population of the animals and K = 9, it was possible to differentiate each of the ganadarias studied (Table 8). Approximately 95.0 percent of the animals were assigned to their respective source populations (Table 8). Only three individuals were incorrectly classified, two animals of the ganadaria Palha were classified as belonging to ganadaria Jorge Carvalho and one animal of the ganadaria Jorge Carvalho was incorrectly classified as belonging to ganadaria Cabral D'Ascenção (results not shown). All the other individuals were correctly classified in their source population. It is important to note that all animals belonging to the ganadarias not recognized by the STRUCTURE program as being distinct populations, respectively, the ganadarias Jorge Mendes, Cabral D'Ascension and Paulo Caetano, were all classified in their source population of origin with huge odds (e.g. >0.9). This could mean that if the sample in these ganadarias contemplates more animals these ganadarias could be considered as distinct populations when we run the STRUCTURE Program to find the most probable number of distinct populations among our data.
Allocation of individuals for the longest run with STRUCTURE regarding the information about the source population of the animals and K = 9.

Discussion and conclusions
The low patterns of genetic diversity are characteristic of a breed that is subdivided into castes well defined in genetic terms. No other Portuguese breed achieves a level of genetic differentiation as high as that seen in the Brava Lide breed. 20.4 percent of the genetic variation was due to differences between the ganadarias, but otherwise the diversity within each ganadaria is considerably low as evidenced by indexes of genetic diversity presented in this study. The high genetic distances D A also seem to point to a high degree of genetic isolation among the different ganadarias studied in this work. In particular, the ganadaria that genetically moves further away from all the others ganadarias is the ganadaria Vaz Monteiro with an average of D A genetic distance of 0.458 and an average coefficient of genetic differentiation F ST of 0.317, also being the one with more private alleles (20). Let us remember here that the ganadaria Vaz Monteiro is considered by all breeders of “Brava de Lide” as the most Portuguese of all ganadarias existing in Portugal, so its genetic separation from all other ganadarias was somehow expected.
An unexpected result in this study was the zero deviations from HWE, unlike the results reported by Mateus et al. (Reference Mateus, Penedo, Alves, Ramos and Rangel-Figueiredo2004), where the breed “Brava de Lide” was the one that showed more deviations (five deviations) to the HWE. Maybe the deviations found in that study were due to the substructure characteristic of this breed and when this substructure was dismantled in this work, it resulted in zero deviations from HWE.
As we can see, there is a clear substructure within the breed “Brava de Lide”, which resulted in obtaining the four clusters achieved by FCA and the six clusters obtained with STRUCTURE. A similar result was presented by Cañón el al. (Reference Cañón, Fernández, García-Atance, Tupac-Yupanqui, Cortés, García and Dunner2007), who obtained 31 different clusters for the 77 ganadarias covered by their study, having the genetic variability among the studied ganadarias reached 20 percent, a similar result to that obtained in the present study, despite the much smaller number of ganadarias covered, which only confirms the enormous genetic diversity found among the various ganadarias constituting this cattle breed.
In this study, and using the STRUCTURE program, we were able to identify six of the nine ganadarias used, which is a considerable number. But when we run the STRUCTURE program knowing the source populations of the animals, we were able to identify all the nine ganadarias studied. The variation among groups was 20,4 (F ST = 0.204) and for this level of differentiation among the populations we believe that all ganadarias studied would be well differentiated, as was proven when the STRUCTURE program was run with the a priori knowledge of the source populations of the animals. Notice that the animals of those ganadarias not recognized by the STRUCTURE program are classified with high percentages (>0.9) in their populations of origin when the program was run with the knowledge of the source populations of animals. These results were not at all unexpected if we consider that this breed began to be selected during the eighteenth century (Felius, Reference Felius1995). As a result of the selection process and creation schemes, the breed gave rise to a small number of well-differentiated lines or castes, traditionally raised on farms, where the reproductive isolation was imposed. Strategies for establishment of this breed also favoured the prevalence of breeding or breeding lines, selected for behavioural traits (e.g. aggressiveness and nobility), which contributed to an increase in inbreeding and a reduction in heterozygosity. This farming system led to a divergence between farms and produced several subpopulations among which it is even possible to observe morphological differences. Regarding the results achieved in this study, the low levels of within genetic diversity in contrast with the high level of genetic differentiation among all the ganadarias tested in the present work seems to point at genetically different populations where the reproductive isolation is working well and it is, therefore, this isolation the determining factor of the substructure found in this cattle breed. The change of animals between the ganadaria Jorge Carvalho and Palha was expected because both shared breeders of the same origins (Lucas, personal communication). The ganadarias better differentiated genetically are, without any doubt, ganadarias Nuno Casquinha, Mário Vinhas and ganadaria Vaz Monteiro. Note the fact that only these ganadarias include all their animals in the same cluster, when the STRUCTURE Program was run without a priori knowledge of the source populations of the animals. The ganadaria Mário Vinhas e Heirdeiros de Manuel Vinhas because its caste is pure Santacoloma, one of the main Spanish castes, although lately have entered reproducers Los Caminos and Buendia. The ganadaria Vaz Monteiro, the oldest in Portugal, was incorporated in its beginning in 1843, with cows and breeders of the pure Portuguese caste, coming from the Marquês de Vagos and has been kept in the same family without the introduction of any other blood, constituting a unique caste that must be preserved, which is the true offspring of the Portuguese “Brava de Lide” breed. Mateus (Reference Mateus2008), when proceeding to the classification of animals of Portuguese cattle breeds in their populations of origin using the STRUCTURE program, systematically classified the four animals of “Brava de Lide” breed sampled in the ganadaria Vaz Monteiro in another population, running the program either with or without the knowledge of their source populations. Therefore, special attention should be given to animals of this ganadaria if we do not want to miss a valuable genetic resource, which is the true Portuguese cattle breed “Brava de Lide”. We also believe that we have confirmed the importance of preserving these genetic resources to enrich the animal genetic resources of the country, due to the great variability between ganadarias.
Acknowledgements
This work was supported by the Fundação para a Ciência e Tecnologia (FCT), Project: PRAXIS XXI 3/3.2/CA/2005/95. J. C. Mateus was supported by a Fellowship of the FCT ref: PRAXIS XXI BD/18354/98.