I. INTRODUCTION
There is preponderance of evidence that the variation of evolving morphology during thin-film growth on a surface, e.g., experimental observation of growth modes as cluster, fractal, or dendritic on fcc(111) surface, Reference Brune, Romainczyk, Röder and Kern1–Reference Fischer, Brune, Barth, Fricke and Kern3 results from competition among several phenomena including surface diffusion. In fact, diffusion of adatom islands on surfaces provides important insights not only in thin-film growth Reference Meakin4–Reference Feng-Min, Qiao-Wen and Zi-Qin6 but also in surface chemical reactions, Reference Bowker and Leibsle7 mass transport, Reference Malmejac and Frohberg8 deformation, Reference Woo9 and corrosion, Reference Wen, Evans, Bartelt, Burnett and Thiel10 making it a focus of many experimental and theoretical investigations. In thin-film growth in particular, a complete understanding of its morphological evolution requires atomic-level understanding of the processes executed at early stages. Experimental observations (using scanning tunneling microscopy or field ion microscopy) of various diffusion mechanisms of islands on a surface such as edge diffusion, Reference Wang, Kürpick and Ehrlich11,Reference Schlößer, Morgenstern, Verheij, Rosenfeld, Besenbacher and Comsa12 dimer-shearing, Reference Kellogg13,Reference Zhang and Lagally14 and concerted gliding Reference Wang and Ehrlich15,Reference Signor, Wu and Trinkle16 have already pointed out the factors that may control a growth mode. However, because of insufficient time resolution, these experimental findings cannot uncover complete pathways of short-lived diffusion process; instead, on the basis of experimental evidence alone, those processes must be inferred indirectly. By contrast, theoretical atomistic simulations are capable of determining directly the diffusion pathways and so play an important role in revealing the processes driving morphological evolution of the nanostructures. Among the available simulation techniques, one of the widely used tools at atomic resolution is molecular dynamics (MD) simulation Reference Alder and Wainwright17 which implicitly includes system vibrational and structural information in the formulation. It also incorporates anharmonic effects that may come into play. However, the necessity of short simulation time step (∼femtosecond) to resolve atomic vibrations makes MD an inefficient tool for studying the long-time evolution of a system triggered by rare events such as bond-breaking, as a large number of computational steps are required even to capture a single diffusive process. The most successful framework to bridge the time scale gap is transition state theory Reference Vineyard18,Reference Voter and Doll19 in which rare events are explained in terms of the rate of crossing an energy surface separating an initial and a final configuration. Once rate of processes are known, the kinetic Monte Carlo (KMC) Reference Bortz, Kalos and Lebowitz20,Reference Voter21 method that treats evolution as a succession of state-to-state Markov walks dictated by rates of the possible processes becomes a method of choice to explore long-time evolution of a system.
By treating the support as static during the simulation, KMC is able to simulate the evolution of rather large atomic system, up to experimentally resolvable time scales, within a reasonable computational time frame and resources to provide a description that allows direct comparison with experiments. In KMC, the probability of selecting a process is proportional to its rate constant and the time advanced after each successful transition depends inversely on the sum of rate constants of all possible processes in the system. So, for this method to yield reliable results, it is crucial to know in advance the full range of processes and an accurate rate of occurrence of each. In standard KMC, no special attempts are made to overcome the first challenge and information about the possible processes is postulated (and ultimately guessed) before the simulation is undertaken. This may be reasonable when the number of possible processes is relatively small (e.g., simple chemical reactions in vacuum or diffusion of islands containing no more than three adatoms) because chances of imagining all possible processes are higher and the calculation-intensive task of determining the activation energy barrier (E a) for all of them is not prohibitively expensive. But when the number of possible processes is huge (e.g., simulation of diffusion of islands containing more than three adatoms), building such a library of processes and their respective energy barriers in advance is not only unreliable (since the chance of leaving out some processes increases as the number of possible configurations increases) but also inefficient (since only few processes will dominate in the simulation).
To economize addressing of the completeness challenge of input into KMC simulations, an on-the-fly method was developed that treats only processes corresponding to a configuration that shows up in the KMC step as a possibility. In this method, the E a of a given possible process is calculated each time it appears in the simulation. Reference Henkelman and Jónsson22 Since it is not stored, it has to be calculated every time the process is picked. To avoid such redundancy in the calculation, a self-learning kinetic Monte Carlo (SLKMC) Reference Trushin, Karim, Kara and Rahman23 method was developed, which uses a pattern-recognition scheme Reference Shah, Nandipati, Kara and Rahman24 for efficient storage and subsequent retrieval of information about possible processes and their corresponding E as. For each process generated by KMC, SLKMC consults the evolving database to determine if that process or its symmetrical equivalent is already stored; if it is, the stored E a is used to calculate the rate of occurrence; if not, the E a for the new process is calculated on-the-fly. In the last decade, a number of studies using SLKMC have provided a microscopic understanding on the diffusion kinetics of adatom islands on metal surfaces. For example, study of the diffusion of Cu islands containing 19–100 atoms on the Cu(111) surface, a scaling relation between diffusion coefficient (D) with the number of atoms in the island (N) was found to be Dᾳ(N −1.57). Reference Trushin, Karim, Kara and Rahman23 Furthermore, a crossover from domination of multiatom processes to that of involving single atoms was also found. In the subsequent work, detailed attention to the diffusion kinetics of small island sizes containing up to 10 adatoms in homo-epitaxial Reference Karim, Al-Rawi, Kara, Rahman, Trushin and Ala-Nissila25–Reference Shah, Nandipati, Karim and Rahman27 and hetero-epitaxial systems Reference Acharya, Shah and Rahman28 revealed a number of diffusion processes, including their relative significance in island diffusion characteristics. The method was extended to off-lattice systems using the set of relative position of atoms in the pattern-recognition scheme and has successfully uncovered a number of novel mechanisms in the diffusion of Cu island on Ag(111). Reference Kara, Trushin, Yildirim and Rahman29 The on-site SLKMC was further improved to incorporate both face-centered cubic (fcc)- and hcp-occupancy sites on the fcc(111) surface (SLKMC-II), first following manual incorporation of processes Reference Karim, Al-Rawi, Kara, Rahman, Trushin and Ala-Nissila25 and later automatic incorporation using extended pattern-recognition scheme. Reference Shah, Nandipati, Kara and Rahman26
In this contribution, we report its application to explore the diffusion kinetics of small (2–8 atoms) two-dimensional islands of Pd and Ag on their respective fcc(111) surfaces (two homo-epitaxial systems) and that of small Ni islands on Cu(111) and Cu islands on Ni(111) (two hetero-epitaxial systems). We pay special attention to the type of processes that are executed in the two sets and provide rationale for trends in the diffusion characteristics in terms of an energy descriptor. We also compare our results to the few experimental and computational results that are available. In what follows, we provide some details of the SLKMC method used in this study in Sec. II, present results of diffusion properties of the islands obtained using the method in Sec. III, and offer our conclusions in Sec. IV.
II. COMPUTATIONAL DETAILS
Among various fcc crystal surfaces, the 6-fold symmetric fcc(111) is the most compact with a relatively flat potential-energy surface which makes it the substrate of choice for the growth of nanoscale films. At the same time, understanding the diffusion of adatom and their islands on the surface is challenging because of the closely comparable energy barriers for a large number of diffusion processes.
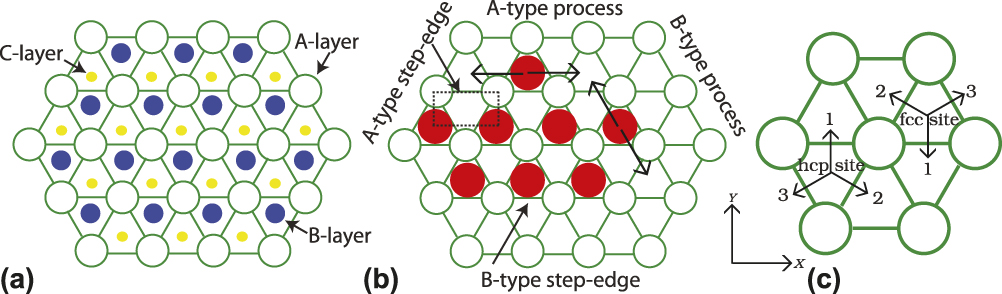
Figure 1(a) shows the top view of the fcc(111) surface that displays the topmost three layers, named A, B, and C and are represented by hollow green, filled blue, and filled yellow circles, respectively, leaving two possible 3-fold hollow adsorption sites: one on top of the blue circle whose nucleation leads to the ABAB stacking fault that constitutes a hexagonal close-packed (hcp) site and another on top of the filled yellow circle whose occupancy maintains the crystal stacking order ABCABC as in its bulk structure that constitutes a fcc site. Schematically, an hcp site (H) comprises three A-layer atoms that form a downward pointing triangle, whereas an fcc site (F) comprises three A-layer atoms that form an upward pointing triangle as shown in Fig. 1(c). This difference in the orientation of the A-layer atoms on fcc and hcp sites is used in the rest of this article to identify whether an island is adsorbed on an fcc or hcp site. Here an island is defined as a group of adatoms of which any two are connected directly or indirectly through other adatoms by the nearest neighbor bonds. To introduce various terminologies, in Fig. 1(b), we show an example of an octamer island in which the row containing 4 adatoms (neglect the presence of the single-atom showing A-type process) forms (100) microfacet (aka an A-type step-edge) and the short edge forms (111) microfacet (aka a B-type step-edge). An adatom island on an fcc(111) surface can form compact or noncompact geometries with their boundaries forming A- and B-type step edges of equal or different edge lengths. The activation energy barriers of various processes also depend upon whether a top-layer substrate atom lies in between adatoms during the process (which we henceforth call an A-type process) or not (a B-type process), as shown in Fig. 1(b). An adatom(s) of an island can move in three directions as shown in Fig. 1(c). From now on, in all our figures, we show only the adatoms (represented by filled red discs) and their neighboring atoms of the top-most substrate layer (represented by hollow green circles).
(a) Top view of the fcc(111) surface. The exposed top layer (A-layer), a layer below (B-layer), and two layers below (C-layer) are represented by big hollow green circles, filled blue circles, and filled yellow circles, respectively. (b) Octamer island adsorbed on fcc sites with A- or B-type step-edge and A- or B-type processes. (c) Three possible available directions for an adatom to move from an fcc (hcp) to a neighboring hcp (fcc) site along with numbering convention for processes used in this article.

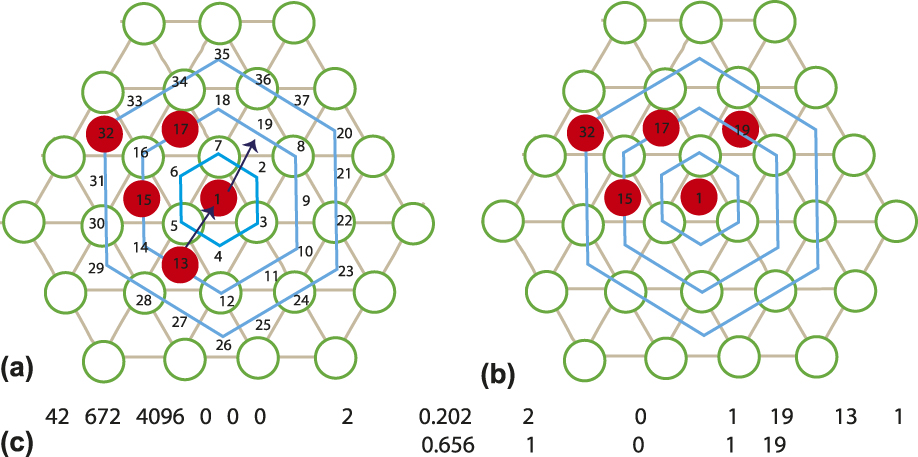
Our model system consists of a 5-layer substrate with 256 (16 × 16) atoms in each layer and an adatom island (2–8 atoms). Several steps need to be undertaken before we begin our simulations. Because of the application of the pattern-recognition scheme, we need to first label the atoms in the adatom island whose diffusion pathways and activation energy barriers need to be calculated as reliably as feasible. To begin with, we arrange the substrate atoms in the fcc(111) configuration on which an initial island of a given size is adsorbed. To label the initial island configuration (and also to explore possible processes), we assign, for example, as shown in Fig. 2, site 1 as the fcc hollow site with one adsorbed adatom. The top-layer substrate atoms, the fcc and hcp adsorption sites in the top substrate layer are then enumerated around it so that sites on first, second, third, …, up to sixth hexagonal rings are assigned numbers from 2 to 7, 8 to 19, 20 to 37, …, 91 to 127, respectively. The adatom on site 1 is called “central” adatom, not in terms of the geometry of the island but in virtue of its initiating role to explore processes. Since the available adsorption sites on the first ring (sites numbered 2, 4, and 6 in Fig. 2) are within the nearest neighbor distance from the central adatom, they cannot be energetically occupied by other adatoms so that the initial dimer island occupies sites 1 and 9, the initial trimer island occupies sites 1, 9, and 11, and so on. Once an adatom island is labeled, ionic relaxation of the atoms in the top three substrate layers and those in the island is carried out by keeping the atoms in the bottom two layers of the substrate fixed to mimic the bulk structure taking energy convergence of 10−4 eV and the temperature corresponding to velocities in the projected velocity verlet algorithm Reference Andersen30 of 10−4 K. Note that ionic relaxation for all atoms in the island and in the top three substrate layers (island atoms +256 × 3 substrate atoms) is performed for the calculation of all diffusion pathways and activation energy barriers, following the procedure described below.
(a) Three concentric hexagonal rings out of six such rings to uniquely specify local neighborhood of an island in pattern-recognition scheme of the SLKMC-II method. Enumeration of top-layer substrate atoms and adsorption sites of the fcc(111) surface to explore possible processes and store information. Initial pentamer island configuration in (a) transforms to that in (b) after execution of a 2-atom process shown by lines with arrow-head, (c) format of database that stores information about the initial island configuration, energy barrier of process and executed process The two-atom process is complemented by probable single-atom process with the same probable target site 19.

For an island configuration, a pattern of binary bits (pattern-recognition scheme Reference Shah, Nandipati, Kara and Rahman24 ) is assigned based on the occupancy of sites on the six hexagonal rings around a central adatom to store and retrieve information. As a convention, for the first ring, the binary number 1 is assigned for every top substrate sites and number 0 is assigned for hollow sites, whereas, for higher rings, number 1 is assigned for sites with adatoms adsorbed on them and number 0 is assigned for both the top-layer substrate atoms and the unoccupied hollow sites. Following the convention, the binary bit patterns of the first, second, and third rings in Fig. 2 become 1010102 (=4210), 0010101000002 (=67210), and 0000010000000000002 (=409610), respectively, and those of higher rings become 0 due to the absence of adatoms on those rings. Because of the difference in neighboring geometry, if the central adatom is on an hcp site, the decimal equivalent of the bit pattern of its first ring becomes 2110. A set of 6 numbers which uniquely specify a configuration becomes (42 672 4096 0 0 0) for the pentamer island shown in Fig. 2.
After determining the initial configuration of the system, in each step of the on-the-fly KMC, the second task is to determine all the possible processes that could be executed in that configuration. For that purpose, all the sites in the second ring around the central adatom (sites at the nearest neighbor distance from it) are checked in the ascending order of enumeration as possible sites to diffuse. In the pentamer island configuration in Fig. 2, the preoccupancy of sites 13, 15, and 17 with adatoms leads to checking of sites 9, 11, and 19 consecutively as possible sites. Among these sites, only those that give nonsymmetrical island configuration upon diffusion of central adatom to them are considered to calculate E a of the process. On the fcc(111) surface, five types of operations can give the same island configurations: mirror reflection, clockwise rotation of 120° and 240°, and mirror reflection after clockwise rotation of 120° and 240° about an axis passing through the central adatom. The E a of the process corresponding to each provisional final site is calculated using the drag method Reference Trushin, Karim, Kara and Rahman23 whose details for considering site 19 as the final site is presented in Sec. II.A. This exploration and updating of the database as explained in Sec. II.A is carried out for each adatom of the island as central adatom if it creates new configuration whose symmetrically equivalent configuration is not already in the database. At the end of this complete exploration, the database contains all the processes in which the system in that particular configuration can diffuse along with their E as.
For each nondetachment process (i) (n i being the symmetrical ways to execute it in a given configuration), we calculate its diffusion rate using
 $${r_i} = {r_0}{{\rm{e}}^{{{ - {E_{\rm{a}}}} \over {{k_{\rm{B}}}T}}}}\quad ,$$
where r 0 is the pre-exponential factor (which we approximate as 1012 s−1), E a is the activation energy barrier of the process (as stored in our current database), k B is the Boltzmann constant, and T is the absolute temperature. One particular process, say (j − 1)th, among all of the possible nondetachment processes recorded in the database (N e) for this configuration (e) is selected to execute in the current KMC step following the condition in Eq. (2).
 $$\left( {\sum\limits_{i = 1}^{j - 1} {{n_i}{r_i}} } \right) \lt {\rho _1} \times {S_{{N_{\rm{e}}}}} \lt \left( {\sum\limits_{i = 1}^j {{n_i}{r_i}} } \right)\quad ,$$
where ρ1 ∈ (0, 1] is a random number and
 ${S_{{N_{\rm{e}}}}} = \left( {\sum\limits_{i = 1}^{{N_{\rm{e}}}} {{n_i}{r_i}} } \right)$
.
Time is updated by
 $t \to t - {{\ln {\rho _2}} \over {{S_{{N_{\rm{e}}}}}}}$
, where ρ2 ∈ (0, 1] is a new random number. With the execution of the process thus selected, a new configuration results and this KMC step ends. The next KMC step begins with that configuration. In this way, the system evolves by performing a process of its choice from among the multitude of possible single or multiple adatom jumps made in the succession of KMC steps up through 107 KMC steps.
As this evolution unfolds, we gather statistics for calculating various features among which execution of different types of processes, and the diffusion coefficient of an island at a given temperature calculated by using Eq. (3),
 $$D = {{{{\left\{ {{r_{{\rm{cm}}}}\left( t \right) - {r_{{\rm{cm}}}}\left( {{t_0}} \right)} \right\}}^2}} \over {2dt}}\quad ,$$
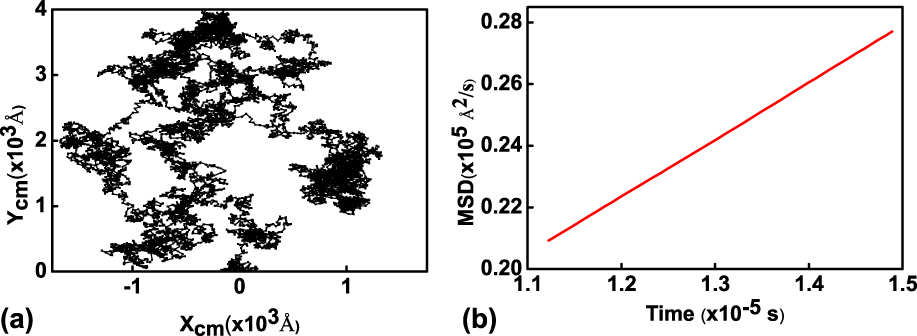
where D is the diffusion coefficient, r cm (t) is the position of the center-of-mass of the island at time t, and d (=2 in this study) is the dimensionality of the system, which are discussed later in this contribution. For good statistics, for each island size, we divide 107 KMC steps into 105 simulations each with 100 KMC steps (running consecutively). For each of those set of 100 KMC steps, we take the coordinates of each adatom in the island before execution of the process and after and calculate the center-of-mass of the island and the square displacement of the island resulting from the executed process. We store the square displacement along with the time for each step for 100 steps. The position of the island at the end 100 steps becomes the origin for the succeeding 100 KMC steps. We now calculate the mean square displacement (MSD) and mean time by ensemble averaging: ensemble 1 consists of all the 1st steps (each of which has a different origin, as explained above) in each 100 KMC steps, ensemble 2 of all of the 2nd KMC steps of the same, …, ensemble 100 of each 100th steps, etc.; and the mean t for each ensemble consists of the sum of the times of 105 KMC steps of that ensemble divided by 105. With the resulting 100 MSDs and 100 mean equivalent times, we graph the successive MSDs over cumulative t. An example of the center-of-mass trajectory and the variation of the MSD with time in case of Cu tetramer diffusion on the Ni(111) surface from Ref. Reference Acharya, Shah and Rahman28 are shown in Fig. 3.
(a) Plot of the center-of-mass trajectory and (b) variation of MSD with time and variation of Cu tetramer island diffusion on the Ni(111) surface at 300 K. As shown in (a) the center-of-mass follows random trajectory and in (b), the MSD varies linearly with the time that validates the use of Eq. (3) to calculate the value of the diffusion coefficient as the slope of the curve.

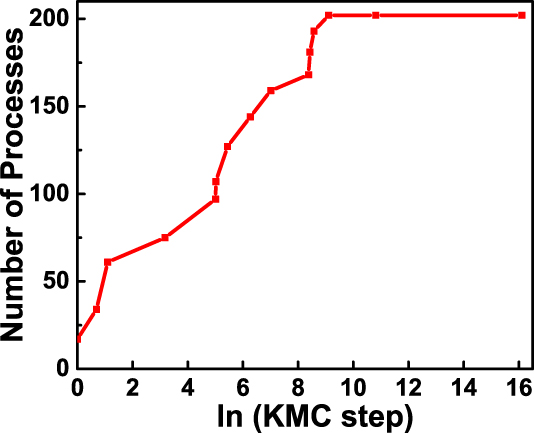
The reliability of our results depends on the defensibility of various necessary approximations. Although there is no infallible method for discovering all possible processes, we are confident that the database includes possible nondetachment processes, an example of the evolution of database of Cu tetramer diffusion on the Ni(111) surface generated at 600 K is shown in Fig. 4 that shows saturation.
Variation of the number of processes collected in the database in the diffusion study of Cu tetramer on the Ni(111) surface at 600 K with the number of KMC steps (in ln scale) which shows saturation at 104 kMC steps in a simulation run for 107 KMC steps.

We should also comment about the accuracy of the E as calculated using the drag method and embedded-atom method (EAM) potentials. Ideally, with the methods available so far, the most reliable path would be to use density functional theory-based Reference Hohenberg and Kohn31,Reference Kohn and Sham32 methods for calculation of the total energy and a robust technique such as the nudged-elastic band (NEB) method Reference Henkelman and Jónsson33 or its variant the “dimer” method Reference Henkelman and Jónsson34 for calculating the energy barriers. Since the first step in SLKMC is to saturate the database with all imaginable diffusion processes and their energy barriers, for each cluster size, it entails calculation of several thousand such quantities, many of which the system never selects for execution. DFT + NEB-based calculations of thousands of energy barriers are a computationally formidable task, even with the advances that have been made. Using EAM + NEB is also 100 times slower than using EAM + drag. We have thus kept EAM + drag as our work horse for populating the database with diffusion processes and their barriers. Once we find the trends and extract the processes that the system prefers to execute for diffusion, we check the accuracy of the stored energy barriers using not only NEB but also DFT + NEB. The comparisons so far have displayed only minor differences between the barriers calculated using the EAM + drag method and that using EAM + NEB, as we discuss for Cu islands on the Cu(111) in Ref. Reference Trushin, Karim, Kara and Rahman23. An additional comparison of selected diffusion barriers for Cu islands on the Ni(111) surface calculated using the EAM + drag method with those obtained using DFT + NEB presented in Ref. Reference Acharya, Shah and Rahman28 shows minor quantitative difference.
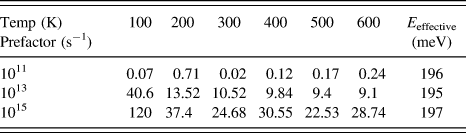
In addition, for every process (at no matter what temperature), we approximate attempt frequency or the pre-exponential factor (r 0) in Eq. (1) as 1012 s−1, which is a reasonable approximation in reference to the calculated value of attempt frequency based on experimental observations Reference Signor, Wu and Trinkle16,Reference Knorr, Brune, Epple, Hirstein, Schneider and Kern35,Reference Müller, Nedelmann, Fischer, Brune and Kern36 and theoretical calculations. Reference Liu, Cohen, Adams and Voter37,Reference Rilling, Gilmore, Andreadis and Sprague38 We are aware that the assumption of the “normal” value for the pre-exponential factor may be questionable and may hide some important physical implications of those processes with either too large or too small a value compared to the normal. To check the dependence of the results on the choice of the prefactor, we have carried out calculations assigning the prefactor values of 1011, 1013, and 1015 s−1 for all single-atom, multiatom, and concerted processes for the case of Pd pentamer diffusion on the Pd(111) surface in the temperature range 100–600K. We find that the result for normalized frequency of execution of different processes is not affected and neither is the effective energy barrier for the Pd pentamer diffusion. Naturally, the value of the diffusion coefficient changes. The percentage change in values of lnD with corresponding values obtained on using prefactor 1012 s−1 in our calculation are presented in Table I.
Percentage change in the calculated values of lnD for Pd pentamer diffusion on Pd(111) for different prefactors with reference to its value with prefactor 1012 s−1 at different temperatures.

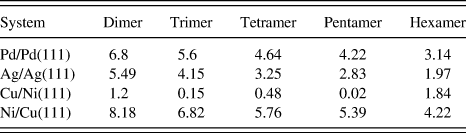
In the on-lattice KMC approach, some strain is to be expected even for homo-epitaxial systems since the bond lengths between the island adatoms are not be the same as the nearest neighbor distance of the substrate atoms in the bulk. To estimate the bias due to such an assumption, we calculate the percentage deviation in the average bond length in islands of different sizes in their relaxed configuration from the substrate bulk nearest neighbor distance. The results presented in Table II show that the deviation is not significant, implying that the results based on the on-lattice approximation are reliable.
Percent variation in the bond length of island adatoms with respect to the substrate bulk nearest neighbor distance.

A. Calculation of energy barriers using the drag method
As outlined above, the study of the kinetics of any phenomenon using KMC requires activation energy barriers of possible processes which are calculated in the SLKMC in the on-the-fly mode using the drag method. The interaction among atoms is modeled using many-body semi-empirical EAM Reference Foiles, Baskes and Daw39 which has been shown to produce qualitatively and semiquantitatively reliable results for the metallic system Reference Foiles, Baskes and Daw39,Reference Daw and Baskes40 including island diffusion barriers on fcc(111) Reference Acharya, Shah and Rahman28 and other surfaces. Reference Elkoraychy, Sbiaai, Mazroui, Boughaleb and Ferrando41 In the EAM, the interaction energy (E i ) between two atoms i and j of types α and β, respectively, at separation r ij is given by
 $${E_i} = {F_\alpha }\left( {\sum\limits_{j \ne i} {{\rho _\beta }\left( {{r_{ij}}} \right)} } \right) + \sum\limits_i {\sum\limits_{j > i} {{\Phi _{\alpha \beta }}\left( {{r_{ij}}} \right)} }.$$
In Eq. (4), the first term is the embedding energy (many-body term) which gives the amount of energy required to embed an atom in the local electron density of other atoms and the second term is the pair repulsion term.
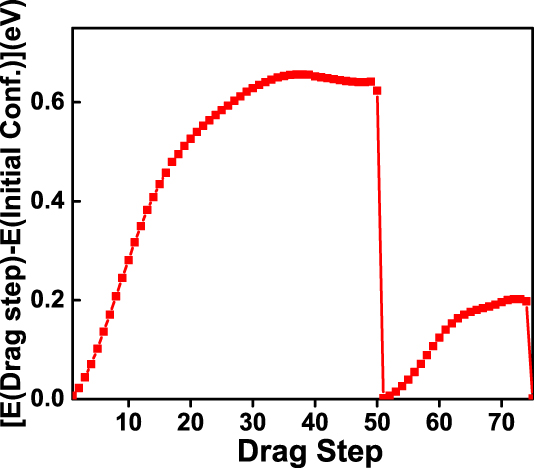
To illustrate the drag method for the calculation of the diffusion energy barrier, we consider the example of the pentamer island in Fig. 2(a). The total energy of the system with all atoms (pentamer + substrate) in ionically relaxed positions is taken as reference energy (the first data point in Fig. 5). To get started, the site numbered 19 on the second hexagonal ring, for example, is taken as a provisional final site for the central adatom to diffuse. With the above information in hand, the drag method implemented in the SLKMC consists of two parts: the first treats diffusion of the central adatom to the provisional final site as a single-atom process which requires keeping all other adatoms fixed during exploration of the minimum energy path (MEP), while the second part allows all other adatoms to move naturally, following the central atom in any other way. In both parts, the central adatom is constrained to move step by step with an increment of 0.05 Å toward the target site, at each step of which the unfixed degrees of freedom of the system are relaxed. In Fig. 5, the first (up to drag step about 50) and second curves correspond to first and the second part, respectively. To be clear, the second data point in the first curve in Fig. 5 represents the relative energy of the relaxed 1st intermediate configuration (keeping other adatoms, bottom 2-layers, and reaction coordinate fixed). Once the 1st intermediate relaxed configuration is obtained, the direction of the reaction coordinate is updated from it to the target configuration. The above procedure is repeated until the energy difference between successive intermediates is less than 10−4 eV or intermediate image is 0.05 Å from the provisional target site. Once the condition is attained, the entire system (except for the bottom two layers of the slab) is relaxed. The height of the energy plot of the first curve in Fig. 5 gives the E a of the single-atom process. So, 0.56 eV is the energy barrier for the central adatom to move to site 19 in Fig. 2.
Variation of energy at each drag step for the Cu pentamer island on Ni(111) shown in Fig. 2(a) from its initial configuration: (1) for the single-atom process (first peak), keeping other adatoms fixed; (2) allowing all island atoms to move which results in a 2-atom process with energy variation given by the second peak.

To start the second part of search, the initial configuration of the system is restored (see energy of the system at drag step 50 equals to the reference energy in Fig. 5) and the same procedure as in first part is repeated with the difference that all adatoms are allowed to move. Once the condition for relaxation of the system, energetic or distance from the target is attained, the final position of the central adatom may or may not be the same as the one initially settled on as the provisional final site, e.g., the central adatom can occupy an hcp site when it is dragged from an fcc to another fcc site. A multiatom process results if, on checking their position after relaxation, more than one adatom change their initially occupied sites as they follow the motion of the central adatom, while a concerted process results if all the adatoms end up on new sites. As a result, the drag method is capable of revealing single, multiple atoms and island concerted motion processes during the calculation without any a priori bias. In the example process considered here in reference to the configuration in Fig. 2(a), a multiatom process containing two atoms emerges from the drag in which the central adatom diffuses from site 1 to site 19 and the adatom on site 13 diffuses to site 1 [Fig. 2(b) becomes the final configuration]. The height of the second peak in the plot of MEP in Fig. 5 gives the energy barrier of the two-atom process. The information about the initial and final island configurations and the activation energy barriers of the processes are stored in the database in the format presented in Fig. 2(c).
III. RESULTS
In this section, we present results of SLKMC-II simulations for island diffusion of two sets of systems. In one, we compare the homo-epitaxial systems: Ag islands on Ag(111) and Pd islands on Pd(111), while in the other, we focus on the comparison of the hetero-epitaxial systems: Ni islands on Cu(111) and Cu islands on Ni(111). We have chosen to examine the Cu–Ni and Ag–Pd systems, for both homo- and hetero-epitaxial diffusion, as the lattice mismatch in the two sets of systems is not very large (Cu–Ni mismatch ∼2.5%; Ag–Pd mismatch ∼4.6%). Since the present SLKMC-II formulation is on-lattice, larger mismatch than noted above would have led to more strain in the systems, adding an additional complexity that we leave for the future. An estimate of the error introduced due to assumption of on-lattice sites has already been discussed in Sec. II. Note that some results for Cu islands on Ni(111) have already been published Reference Acharya, Shah and Rahman28 and we are including them here for comparison and for completeness.
A. Diffusion characteristics of adatom islands using SLKMC
As in our earlier publications, Reference Shah, Nandipati, Kara and Rahman26–Reference Acharya, Shah and Rahman28 our general findings using the SLKMC method consists of a tabulation of the frequency of execution of the different types of processes: single- and multiatom, and concerted processes. We also compare for these systems the island-size dependent diffusion coefficients as a function of temperature and their effective energy barrier (E effective).
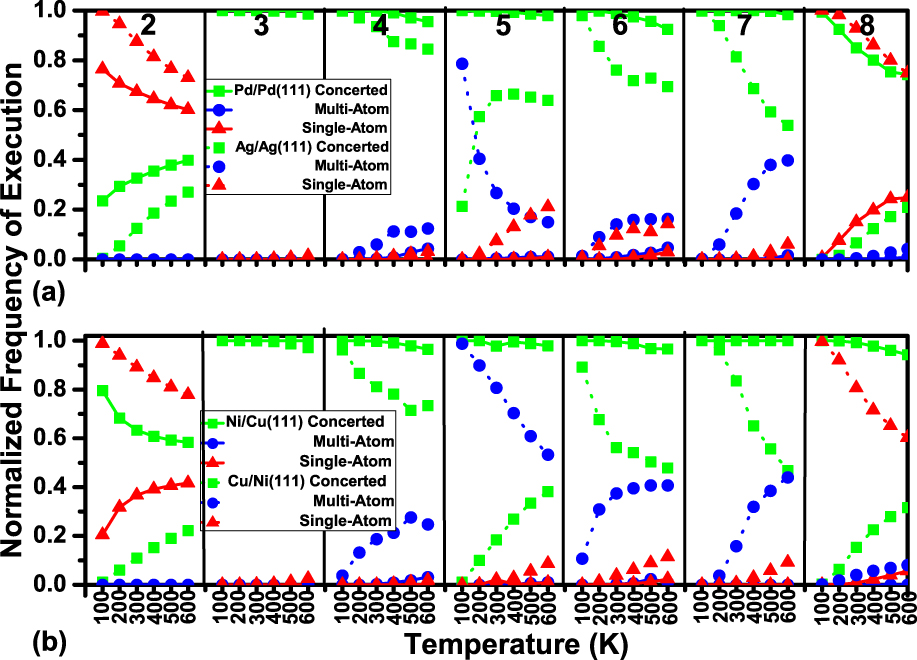
As shown in Fig. 6(a), except in the case of the dimer, concerted processes constitute more than 80% of the executed processes for Pd island diffusion (filled green squares connected by a green line), at all temperatures considered in this study. Furthermore, this fraction is consistently higher than the execution percentage of the same type of process in Ag island diffusion (represented by green squares connected by a dotted line). Note that some of our results compare well with previous calculations. For example, MD simulation of the diffusion of heptamer island of Pd on the Pd(111) surface shows Reference Da Silva and Antonelli42 that the symmetrical form of the cluster is maintained during cluster diffusion from one stable site to the next, in qualitative agreement with our finding of the dominancy of execution of concerted process for the same system. The diffusion processes revealed for small Pd islands on Pd(111) in MD simulations Reference Liu, Hu, Deng, He, Yang, Luo, Lu and Deng43 are also to be found in our database, which naturally contains many more processes that could be revealed in MD.
Normalized frequency of executed single-atom, multiatom, and concerted processes in the diffusion kinetics of adatom islands of size 2 to 8 in the temperature range of 100–600 K of: (a) Pd (continuous line) and Ag (dotted line) adatom islands of size 2 to 8 on their respective (111) surface; (b) Ni islands on the Cu(111) surface (continuous line) and Cu islands on the Ni(111) surface (dotted line).

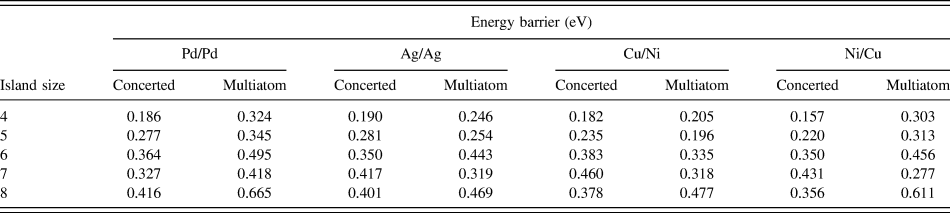
For Ag islands, the pentamer and the heptamer show interesting crossover behavior, as a function of temperature. Notice also that for Ag octamers, single-atom processes are dominant at all temperatures, in contrast to the behavior of Pd octamers on Pd(111). A similar difference in the dominancy of concerted processes is observed in the diffusion kinetics study of Ni islands on the Cu(111) surface as shown in Fig. 6(b). On the other hand, competition among concerted, multiatom and single-atom processes is obtained for Cu islands on the Ni(111) surface [see Fig. 6(b)]. Comparison of the energy barriers of some frequently-executed multiatom and concerted processes of islands of different sizes for four different systems explored in this study, as summarized in Table III, shows that the order of difference between barriers for multiatom and concerted motion for the same island configuration to be Ni/Cu, Pd/Pd, Cu/Ni, and Ag/Ag. For Pd islands on Pd(111) and Ni islands on Cu(111), we see that the barrier for concerted motion are much smaller than those for the other type of processes, and hence the obvious rationale for their dominancy in diffusion kinetics at all temperatures under study. On the other hand, there is relatively small difference in the barriers of various kinds of diffusion processes for all configurations of Ag islands on Ag(111) and Cu islands on Ni(111), resulting in a competition amongst them. Note that for most island sizes, the most dominant concerted processes are the ones for their compact structures and the competing multiatom processes are the A-type dimer shearing for the tetramer to the heptamer and A-type trimer shearing process for an octamer.
Comparison of barriers of concerted and multiatom processes on the same adatom island configuration of different island sizes of the systems under study.

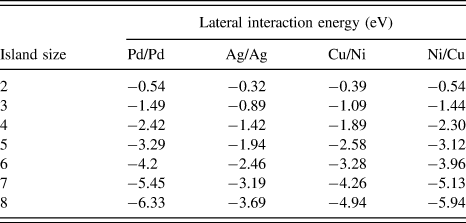
Some insights into the relative difference in the barriers of multiatom and concerted processes for the considered systems can be obtained from the comparison of the lateral interaction among adatoms, since the effect of a substrate is the same for all processes for islands with the same configuration. Such an understanding follows from our earlier work Reference Acharya, Shah and Rahman28 in which we had emphasized the role of lateral interaction to understand the relatively smaller barriers of the diffusion processes of Cu adatom islands on the Ni(111) substrate. To examine the role of lateral interactions in a general manner, we calculate the lateral interaction energy (E L.I.) amongst the adatoms in the island configuration of which barriers of multiatom and concerted processes are compared in Table III using
 $${E_{{\rm{L}}{\rm{.I}}{\rm{.}}}} = {E_{{\rm{island}} + {\rm{sub}}{\rm{.}}}} - n{E_{{\rm{mono}} + {\rm{sub}}{\rm{.}}}} + \left( {n - 1} \right){E_{{\rm{sub}}{\rm{.}}}},$$
where E island+sub., E mono+sub., and E sub. are the total energy of the system with the island adsorbed on the substrate, a monomer adsorbed on the substrate, and that of the isolated substrate, respectively. The calculated values of E L.I. for four different systems are presented in Table IV. Clearly, Pd/Pd(111) and Ni/Cu(111) systems, which have relatively large difference in the barriers for concerted and multiatom processes, have strong lateral interactions among adatoms, whereas the Ag/Ag(111) and Cu/Ni(111) systems have relatively weak interaction among adatoms.
Lateral interaction among adatoms of islands on the fcc(111) substrate for the configurations relevant to processes in Table III.

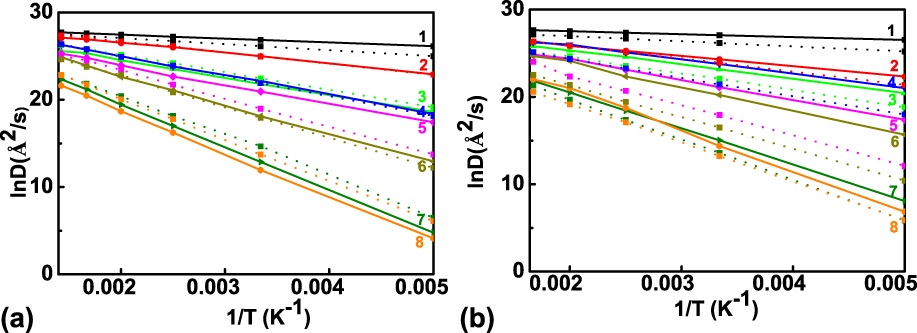
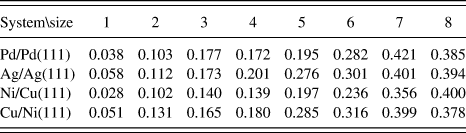
The Arrhenius plot of each island size under study for the homo- and hetero-epitaxial systems, plotted in Figs. 7(a) and 7(b), displays the expected linear dependence from which one can calculate the effective energy barrier (E effective) for each island size (from the slope of the curve). The values of the so-extracted E effective are presented in Table V. The Arrhenius behavior of Pd adatom diffusion on the Pd(111) surface is also reported using MD simulations, Reference Liu, Hu, Deng, He, Yang, Luo, Lu and Deng43,Reference Papanicolaou and Papaconstantopoulos44 from which an effective energy barrier was calculated. Note that on every island, their values are higher than those obtained by us. This difference could be attributed to the types of diffusion processes that were revealed in MD simulation. Some difference could also arise from the differences in the interaction potential. The noticeably large change in the effective energy barrier from the hexamer to the heptamer seen in our result in Table V was also observed Liu et al. Reference Liu, Hu, Deng, He, Yang, Luo, Lu and Deng43 Our result of dominancy of concerted processes for compact configurations of Pd trimer and heptamer on Pd(111) are also in agreement with observation in Ref. Reference Liu, Hu, Deng, He, Yang, Luo, Lu and Deng43; however, their results for the rate of occurrence of concerted and multiatom processes of compact configurations of other small islands is different from ours, although our database includes those processes. The slight decrease of the effective energy barrier in case of tetramer in comparison to that of trimer and pentamer island diffusion of Pd/Pd(111) and Ni/Cu(111) in our result in Table V is consistent to the result reported in Ref. Reference Chang, Wei and Chen45. Note also that the effective energy barrier increases relatively less from trimer to tetramer islands diffusion in case of Ag/Ag(111) and Cu/Ni(111) systems too. The values of effective energy barriers of Pd/Pd(111) and Ag/Ag(111) systems compare well with the reported values of free diffusion energy in Ref. Reference Chang, Wei and Chen45.
Arrhenius plot of islands of size 1 to 8 of (a) Pd islands on Pd(111) (continuous line) and Ag islands on Ag(111) (dotted line) and (b) Ni islands on Cu(111) (continuous lines) and Cu islands on Ni(111) (dotted line).

Effective energy barriers calculated as function of island-size using SLKMC simulation for the systems under study.

For completeness, we include here the comparison of the diffusion characteristics of the monomer with those already reported in the literature. Using another form of the semi-empirical potential, Reference Adams, Foiles and Wolfer46 Liu et al. Reference Liu, Cohen, Adams and Voter37 calculated the activation energy barrier of Pd adatom diffusion on the Pd(111) surface to be 0.031 eV with 0.001 eV difference in binding stability on fcc and hcp sites comparing well with our value of 0.037 eV with the corresponding difference of 0.002 eV. Furthermore, the calculated diffusion prefactor of 5 × 10¹² Å2/s compares well with our value of 2 × 10¹² Å2/s. Similarly, for Ag monomer diffusion on Ag(111), Liu et al. get activation energy barriers of 0.059 eV and D 0 of 5 × 10¹² comparing well with our value of 0.059 eV and 2.24 × 10¹² Å2/s, respectively. The value of effective energy barrier of Ag monomer diffusion on Ag(111) obtained from the Arrhenius plot of the monomer after SLKMC simulation is close to the reported experimental value of diffusion energy of (0.051 ± 0.024) eV in Ref. Reference Rosenfeld, Lipkin, Wulfhekel, Kliewer, Morgenstern, Poelsema and Comsa47. In addition, the calculated values of vibrational frequencies of different modes by Liu et al. in the range 1011 to 1013 s−1 imply our assumed value of 1012 s−1 for attempt frequency is reasonable. The main message from these comparisons with previous work is that our results here for the simple case of monomer diffusion are in accordance with what has already been observed. From the few results available for (2–8 atom) islands, the main difference is in the magnitude of the effective energy barriers and the types of processes revealed during the simulation.
IV. CONCLUSION
To uncover microscopic atomic-level information pertaining to epitaxial growth process as embodied in the natural spatiotemporal, temperature-dependent evolution of 2D island over length and time scales relevant to those in the laboratory, the SLKMC method was developed about a decade back. The main objective was to steer away from standard KMC which relies on an a priori list of diffusion mechanisms, and also to be more computationally efficient than the on-the-fly methods. The SLKMC method thus relies on a pattern-recognition scheme for storing and retrieving activation energy barriers for “all” processes that the diffusing entity could possibly undergo. Of course, one has to ensure that the system has run long enough that “all” processes have been revealed and that no new process emerges as data are being collected. In our experience, with sufficient checks, including comparison with methods such as MD, completeness of the database can be achieved. Saturation of the database is the most time consuming part of the simulation. Once this objective is in hand, large time scale simulation of the system can be performed with modest computational resources. Large length scale simulations can also be performed through the parallel KMC Reference Nandipati, Shim, Amar, Karim, Kara, Rahman and Trushin48,Reference Nandipati, Kara, Shah and Rahman49 technique. The success of the SLKMC method so far has thus been the ability to simulate the morphological evolution and coarsening of two-dimensional islands on the fcc(111) substrate. In the process, a number of island diffusion mechanisms triggered by single-atom, multiatom, or concerted island motion have been revealed. While most of the results have been obtained by employing semi-empirical potentials, the method, in principle, is available for input from more sophisticated techniques such as those based on density functional theory. Furthermore, the database collected so far for a variety of metal-on-metal systems is ripe for application of data analytics from which the descriptors of the diffusion barriers and pathways could be extracted. Such an effort is already underway, Reference Acharya and Rahman50 based on the results summarized here, and could reduce tremendously the computational cost for calculations of energy barriers. The extension of the method to examine morphological evolution of three dimensional islands, nanoparticles, and other nanostructures is also in principle possible. Advances in development of DFT-based, robust semi-empirical potentials for metal–semiconductor interactions would pave the way for examination of growth of metallic thin films on semiconductors using SLKMC. In short, the method promises a lot of returns in the near future.
Among the new results presented here from a systematic analysis of the diffusion characteristics of a set of small (1–8 atoms) 2D islands of Cu, Ag, Ni, and Pd on their respective (111) surfaces, and in a few cases on hetero combinations, we conclude that whether the concerted process dominates or there exists competition among other types of processes (involving single and multiple atoms) depends on the lateral interaction among the island atoms. In case of systems with large lateral interaction, the concerted motion of the island is found to be the dominating process at low or high temperatures. On the other hand, for systems with relatively low lateral interaction, multiatom and single-atom processes also compete with concerted processes at low temperatures, whereas the concerted motion dominates the dynamics at high temperatures.
ACKNOWLEDGMENTS
We would like to acknowledge the computational resources provided by the STOKES facility at the University of Central Florida. We are pleased to acknowledge partial support from NSF grants: CHE-1310327, under which the project was started and MMN-1710306, under which the project was completed.