INTRODUCTION
Knowledge of the dynamics of plant community composition is fundamental to understanding numerous ecological processes (Sheil et al. Reference SHEIL, JENNINGS and SAVILL2000). Growth and mortality are the most important factors that influence plant community dynamics and species composition (Lewis et al. Reference LEWIS, PHILLIPS, SHEIL, VINCETI, BAKER, BROWN, GRAHAM, HIGUCHI, HILBERT and LAURANCE2004, Manokaran & Kochummen Reference MANOKARAN and KOCHUMMEN1987, Rüger et al. Reference RÜGER, HUTH, HUBBELL and CONDIT2011). Analysis of community dynamics has been especially important in ecological studies of species-rich ecosystems, such as tropical forests (Feeley et al. Reference FEELEY, DAVIES, PEREZ, HUBBELL and FOSTER2011, Lewis et al. Reference LEWIS, PHILLIPS, SHEIL, VINCETI, BAKER, BROWN, GRAHAM, HIGUCHI, HILBERT and LAURANCE2004, Rüger et al. Reference RÜGER, HUTH, HUBBELL and CONDIT2011). For example, Condit et al. (Reference CONDIT, ASHTON, MANOKARAN, LAFRANKIE, HUBBELL and FOSTER1999) compared the dynamics of tropical forest communities from Pasoh, Malaysia, with Barro Colorado Island (BCI), Panama, and concluded that growth, recruitment and mortality rates were higher in Panama. In this study, we evaluate the forest population dynamics of 195 species over 5 y in the Dinghushan (DHS) subtropical forest dynamics plot in Southern China, with the goal of understanding population and community structure, and determining the effects of inter- and intraspecific spatial associations on tree mortality.
Analysis of size-class distributions of plant populations combined with dynamic transition probabilities between size classes is a valuable tool for predicting population stability and understanding community dynamics. If the number of juveniles is much larger than the number of adults, the population could be considered stable. Yet, few juveniles may be a warning of low recruitment and population decline (Condit et al. Reference CONDIT, SUKUMAR, HUBBELL and FOSTER1998), unless there is a high probability of individuals moving into intermediate size classes, resulting in a bell-shaped size-class distribution. Large and long-lived species may be especially prone to bell-shaped size-class distribution because their size-class distribution are also affected by long-term demographic factors such as episodic recruitment or mortality events, which vary greatly across different species and with time (Condit et al. Reference CONDIT, SUKUMAR, HUBBELL and FOSTER1998, Venter & Witkowski Reference VENTER and WITKOWSKI2010). In previous studies at Dinghushan, nearly all species exhibited a reverse J-shaped size-class distribution, which may be interpreted as a stable population. However, the three most dominant species were the only exceptions. They showed a bell-shaped size-class distribution, with a peak of individuals concentrated in the intermediate diameter at breast height (dbh) classes (Ye et al. Reference YE, CAO, HUANG, LIAN, WANG, LI, WEI and WANG2008), raising questions of whether these three species could lose their dominance in the near future due to a lack of recruits.
Tree mortality is another of the most important processes in determining forest dynamics (Rüger et al. Reference RÜGER, HUTH, HUBBELL and CONDIT2011), and involves many factors which can be mainly divided into biotic and abiotic factors (Das et al. Reference DAS, BATTLES, VAN MANTGEM and STEPHENSON2008). Relating tree mortality to biotic versus abiotic factors is challenging because of the long-term nature of tree growth. However, through temporal and spatial demographic patterns, it is possible to determine the ecological and environmental processes that contribute to mortality and community structure (Boyden et al. Reference BOYDEN, BINKLEY and SHEPPERD2005). Therefore, we also evaluate mortality in the context of spatial inter- and intraspecific tree associations using a second-order point pattern analyses, Ripley's K function (Ripley Reference RIPLEY1977).
Forest dynamics are slow-acting (Gaines & Denny Reference GAINES and DENNY1993), and thus require long-term data to accurately determine the rates of processes. Much of our current knowledge of long-term forest dynamics is derived from tropical forest, especially from large-scale and stem-mapped permanent forest dynamics plots (Condit et al. Reference CONDIT, HUBBELL and FOSTER1993, Reference CONDIT, HUBBELL and FOSTER1995; Feeley et al. Reference FEELEY, DAVIES, PEREZ, HUBBELL and FOSTER2011). Many of these plots have now logged multi-decadal demographic datasets, which are critical for understanding temporal variation in ecological processes. Demographic data, such as recruitment, growth and mortality offer keys to understanding directional changes in forest processes such as community composition (Hubbell & Foster Reference HUBBELL and FOSTER1992). We measured the 5-y dynamics of a 20-ha subtropical forest plot in South China based on a census conducted in 2005 and again in 2010, and compared these data to other forest dynamics plots to test three hypotheses. First, we hypothesized that the bell-shaped size-class distributions for dominant species at Dinghushan indicate a declining population. Second, we hypothesized that demography of the subtropical forest at Dinghushan will be more dynamic than a temperate forest at Changbaishan, China, and less dynamic than tropical forests at Barro Colorado Island, Panama and Pasoh, Malaysia, consistent with greater dynamism towards the equator. Finally, we hypothesized that tree mortality will be more related to intraspecific spatial associations than to interspecific spatial associations, due to common aggregated distributions within species at Dinghushan (Li et al. Reference LI, HUANG, YE, CAO, WEI, WANG, LIAN, SUN, MA and HE2009).
METHODS
Study site
The study was conducted in the Center for Tropical Forest Science 20-ha forest dynamics plot in the Dinghushan Man and the Biosphere Reserve, Guangdong Province, China (23°09′21″–23°11′30″N, 112°30′39″–112°33′41″E). The 20-ha (400 × 500 m) plot was established within the 1155-ha reserve in 2004–2005 (Ye et al. Reference YE, CAO, HUANG, LIAN, WANG, LI, WEI and WANG2008), and re-censused in 2010, all stems ≥ 1 cm dbh were measured, mapped and tagged. For individuals with multiple stems, all stems were measured and tagged, so that all demographic calculations could be made on the basis of individuals or on the basis of stems. The zonal vegetation is low subtropical evergreen broadleaved forest more than 400 y old. The altitude in the plot ranges from 230 to 470 m asl (Li et al. Reference LI, HUANG, YE, CAO, WEI, WANG, LIAN, SUN, MA and HE2009). The site has a subtropical monsoon climate with a mean annual temperature of 20.9 °C, mean relative humidity of 85%, and mean annual precipitation of 1927 mm, most of which occurs between April and September (Bin et al. Reference BIN, LIAN, WANG, YE and CAO2011).
Demographic rates
We calculated demographic rates from the 2005–2010 census interval. The rate of species turnover was calculated using species presence/absence census data as ((Nl + Nn)/2Nat) × 100% where Nl is the number of species lost from the census, Nn is number of new species appearing since the last census, N a is the number of all species at the first census, and t is the time interval between the first and last census. Relative growth rate (RGR) was calculated as (log(dbht) – log(dbho))/t, where dbho and dbht are the stem diameter at breast height (dbh) from first and last measurements, respectively. Exponential mortality coefficients were calculated as (log(No) – log(Ns))/t, where No and Ns are the number of stems at the first measurement and number of surviving stems at the last measurement, respectively (Sheil et al. Reference SHEIL, BURSLEM and ALDER1995). Recruitment rate was calculated as (log(Nt) – log(Ns))/t where Nt is number of stems at the last measurement. Rate of population change (Condit et al. Reference CONDIT, ASHTON, MANOKARAN, LAFRANKIE, HUBBELL and FOSTER1999), was calculated as (log(No) – log(Nt))/t. We calculated the demographic rates for the 101 species with at least 20 stems in the plot. We compared demographic rates in Dinghushan Forest with data collected at similar long-term forest dynamics plots, including the tropical 50-ha plots on Barro Colorado Island, Panama and Pasoh, Malaysia, and the temperate 25-ha plot in Changbaishan, China, using published sources (Condit et al. Reference CONDIT, ASHTON, MANOKARAN, LAFRANKIE, HUBBELL and FOSTER1999, Wang et al. Reference WANG, LI, YE, BAI, YUAN, XING, LIN, SHI, WANG and HAO2011).
Size-class distributions
We constructed size-class distributions with 5-cm dbh intervals for all stems in 2005 and dead stems during 2005–2010 for the three most common species (dominant species: Castanopsis chinensis, Schima superba and Engelhardia roxburghiana), and calculated the mean annual RGR of each size class. The same methods were used for the three next-most-common species (co-dominant species: Cryptocarya chinensis, Syzygium rehderianum, Acmena acuminatissima) to analyse differences in size-class distributions. We used the quotient of successive size-classes which examines the population stability (Venter & Witkowski Reference VENTER and WITKOWSKI2010), and the permutation index to evaluate population trends between dominant species and co-dominant species. Quotients approach a constant value in a stable population, but fluctuate in an unstable population (Botha et al. Reference BOTHA, WITKOWSKI and SHACKLETON2004). The permutation index was used to measure the deviation from a monotonic distribution using size-classes ranked from smallest (most frequent) to largest (least frequent) (Venter & Witkowski Reference VENTER and WITKOWSKI2010), and is calculated as:
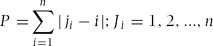 \begin{linenomath}\begin{equation*}
P{\rm = }\sum\limits_{i = 1}^n {\left| {j_i - i} \right|} ;{J}_{i} = 1,2,...,n\end{equation*}\end{linenomath}
Spatial patterns of tree mortality
We used Ripley's K function with isotropic correction for edge effects for comparing the spatial distributions of surviving and dead individuals over the measurement interval in order to assess differences in aggregation. Ripley's K function is defined as the mean number of points within a distance r from a sampled point (Barot et al. Reference BAROT, GIGNOUX and MENAUT1999). In our study, K1(r) and K2(r) are univariate K functions of surviving and dead individuals, respectively (de la Cruz et al. Reference DE LA CRUZ, ROMAO, ESCUDERO and MAESTRE2008), and we used an r value of 50 m from each focal tree for our analyses. If K1(r) – K2(r) > 0, surviving individuals are more aggregated than dead individuals, and if K1(r) – K2(r) < 0, dead individuals are more aggregated than surviving individuals. K1(r) – K12(r) and K2(r) – K12(r) are derived from the function K1(r) K2(r), where K12(r) is a bivariate K function for surviving and dead individuals. These functions are based on the property that every individual pattern would be a random thinning of the corresponding bivariate pattern under the null model of random labelling. The two functions are thus used to evaluate whether one type of point tends to be surrounded by other points of the same type or not. K(r) has an expected value of 0 for all r distances under random labelling. If K1(r) – K12 (r) > 0, we can conclude that surviving individuals are surrounded by more surviving individuals than expected by chance, but if K1(r) – K12(r) < 0, surviving individuals are surrounded by more dead individuals than expected by chance. The complementary function K2(r) – K12(r) is similar; when K2(r) – K12(r) > 0, dead individuals are surrounded by more dead individuals than are surviving individuals. The analyses were performed with 99 point process simulations.
We also investigated the spatial associations between all individuals in the first census and individuals that were dead in the second census to understand how intra- and interspecific relationships influenced tree mortality. We used K12(r), which counts the expected number of points of all individuals within a given distance (r = 100 m) of a dead individual to implement the analyses (de la Cruz et al. Reference DE LA CRUZ, ROMAO, ESCUDERO and MAESTRE2008). To facilitate the visualization and interpretation of the results, we transformed the function K12 to an L12 function calculated as:
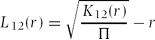 \begin{linenomath}\begin{equation*}
L_{12} (r) = \sqrt {\frac{{K_{12} (r)}}{\Pi }} - r\end{equation*}\end{linenomath}
If the observed L function lies upon the upper simulated envelope, all individuals significantly positively associate with dead individuals, indicating competitive associations between all individuals and dead individuals. In contrast, if the observed L function lies below the lower simulated envelope, all individuals have a significant negative association with dead individuals and this would denote facilitative associations. Such associations often occur in harsh conditions such as arid and semi-arid environments when plant recruitment sometimes requires safe sites under the canopy of nurse plants which provide shelter from high temperature and radiation (Flores & Jurado Reference FLORES and JURADO2003). A total of 199 simulations of the selected null models were computed. Spatial distributions of tree mortality and spatial associations of conspecifics were performed for 74 common species with 50 or more individuals in the Dinghushan plot.
Twenty species with population sizes ≥ 1000 individuals were selected for spatial association analyses among all individuals of a species and dead individuals of another species, and we evaluated type and frequency for the 20 × 19 = 380 species pairs. Spatial pattern analyses were conducted using ‘ecespa’ and ‘Spatstat’ packages in R (2.13.2, 2011).
RESULTS
Demographic rates
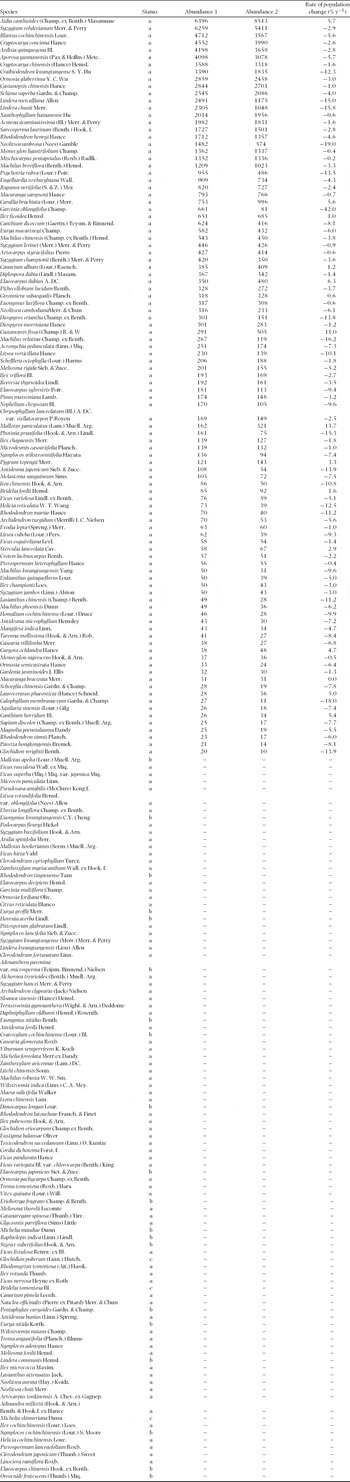
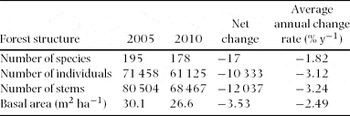
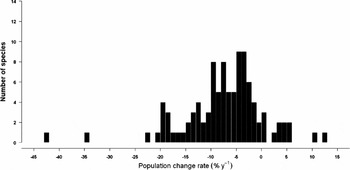
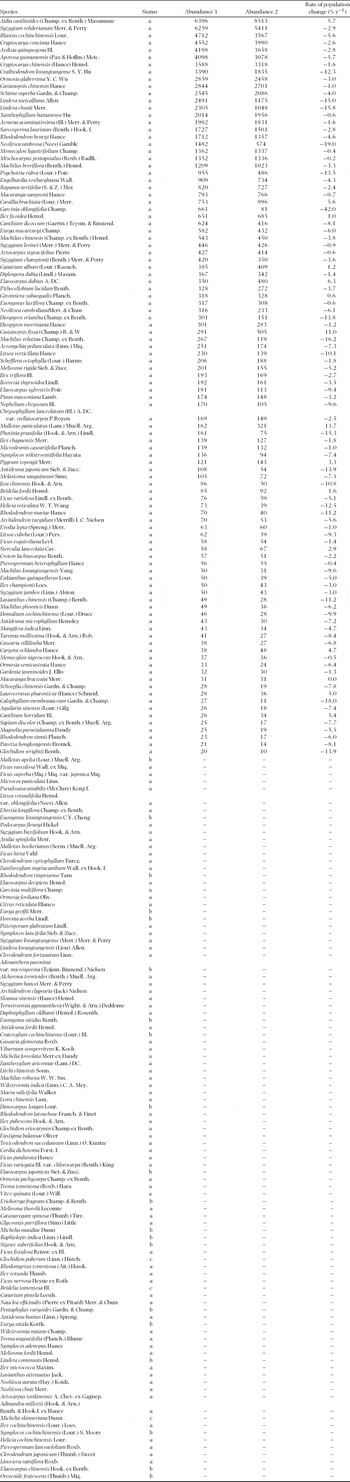
The total number of species in the Dinghushan plot decreased from 195 to 178 over a 5-y period with 20 lost species and three new species (Table 1, Appendix 1). Species turnover rate was 1.2% y−1. The total number of stems decreased from 80 504 in 2005 to 68 467 in 2010, including mortality of 20 424 stems (25.3% of total stems in 2005) and recruitment of 8387 stems (12.2% of total stems in 2010). Size-class distributions for all stems in 2005 and dead stems during 2005–2010 were both close to reverse-J shaped, and the number of dead stems decreased as size-classes increased. There were 71 458 individuals in the 2005 census, but only 61 121 individuals left after the 2010 census, representing a loss of 17 101 individuals (23.9% of total individuals in 2005) and recruitment of 6764 individuals (11.1% in total individuals in 2010) into the ≥ 1 cm dbh size class between 2005–2010. Basal area was 30.1 m2 ha−1 in 2005, and decreased to 26.6 m2 ha−1 in 2010, resulting in a decrease of 4.16 m2 ha−1 due to mortality and an increase of 0.64 m2 ha−1 due to dbh growth and recruitment (0.39 m2 ha−1 and 0.25 m2 ha−1, respectively). The mean RGR for 101 species was 0.032 cm cm−1 y−1, and it ranged from 0.005 to 0.1713 cm cm−1 y−1. The average exponential mortality coefficient was 8.01% y−1, and ranged from 0 to 43.3% y−1 among species. Over 5 y, mean recruitment rate was 3.17% y−1, and ranged from 0 to 20.2% y−1 among species. Number of stems in the plot decreased for 86 out of 101 species (Figure 1, Appendix 1), resulting in a mean annual population change rate of −4.80% y−1, for example, Mallotus paniculatus stems increased by 13.7% y−1 and Garcinia oblongifolia decreased by 42.0% y−1.
Forest structure and change between 2005–2010 in the 20-ha Dinghushan Forest Dynamics Plot, China.

Histogram of rates of population change from 2005–2010 in the 20-ha forest dynamics plot at Dinghushan, China; 101 species that had at least 20 stems at the first measurement were included.

Size-class distributions
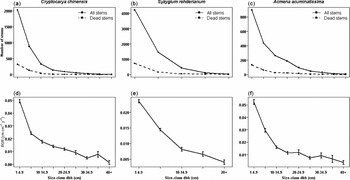
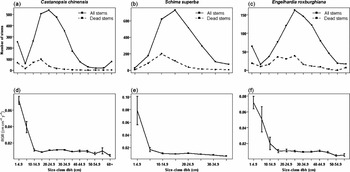
Size-class distributions of stems of the three co-dominant species were reverse J-shaped (Figure 2a–c). The size-class distributions for their RGR decreased gently with increasing size class (Figure 2d–f). Size-class distributions for stems of the three dominant species showed a bell-shaped curve, with Castanopsis chinensis showing a tendency toward positive skew (Figure 3a–c). This indicates that for these three dominant species, most stems were concentrated in the intermediate dbh size range, with fewer stems in the small and large dbh size classes (Figure 3a–c). The RGR of these species were much greater in small dbh stems, and decreased sharply with increasing dbh (Figure 3d–f).
Size-class distributions (diameter at breast height; dbh) in 5-cm intervals of all stems at the first measurement (solid lines) and size-class distributions of dead stems from 2005–2010 (dashed lines) for three co-dominant species (Cryptocarya chinensis, Syzygium rehderianum and Acmena acuminatissima) in the 20-ha forest dynamics plot at Dinghushan, China (a–c). Size-class distributions of average annual relative growth rate (RGR) for three co-dominant species (d–f).

Size-class distributions (diameter at breast height (dbh) in 5-cm intervals) of all stems at the first measurement (solid lines) and size-class distributions of dead stems during 2005–2010 period (dashed lines) for three dominant species (Castanopsis chinensis, Schima superba and Engelhardia roxburghiana) in the 20-ha forest dynamics plot at Dinghushan, China (a–c). Size-class distributions for average annual relative growth rate (RGR) for three dominant species (d–f).

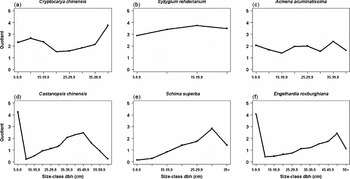
Quotients calculated between successive size-classes for all six populations were not constant, but the amplitude of fluctuation of dominant species was much larger than co-dominant species (Figure 4), indicating that co-dominant species appear more stable than dominant species. Moreover, the permutation index values of co-dominant species were equal to zero, but permutation index values were much larger than zero for dominant species (36, 20 and 48, respectively), demonstrating that the size-class distributions of dominant species were discontinuous, and recruitment and mortality were episodic events.
Quotients between successive size-classes (diameter at breast height; dbh) in 5-cm intervals for three co-dominant species (a–c) and three dominant species (d–f) in the 20-ha forest dynamics plot at Dinghushan, China. Cryptocarya chinensis (a); Syzygium rehderianum (b); Acmena acuminatissima (c); Castanopsis chinensis (d); Schima superba (e); Engelhardia roxburghiana (f).

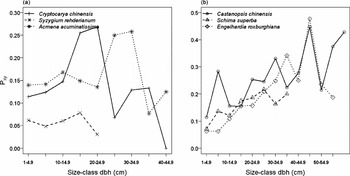
The mean probability of an individual remaining in the same size-class (Pxx) for three dominant species was 0.62 ± 0.4 (1 SE), whereas the mean Pxx for co-dominant species was larger than dominant species (0.74 ± 0.3). The mean probabilities of an individual growing to the next consecutive size-class (Pxy) for the three dominant species was larger than co-dominant species (0.20 ± 0.2 versus 0.11 ± 0.3). No clear patterns of Pxy were observed for three co-dominant species (Figure 5a). Interestingly, Pxy tended to increase as size-class increased (Figure 5b), and had a peak at the size-class of 5–9.9 cm for Castanopsis chinensis and Schima superba.
Transition probability of an individual grow to the next consecutive size-class (Pxy) for three co-dominant species, Cryptocarya chinensis, Syzygium rehderianum and Acmena acuminatissima (a) and dominant species, Castanopsis chinensis, Schima superba and Engelhardia roxburghiana (b) during 2005–2010 period in the 20-ha forest dynamics plot at Dinghushan, China.

Spatial patterns of tree mortality
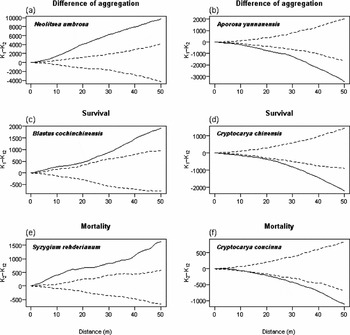
Spatial distributions for surviving and dead individuals of 32 species (43.2%) significantly departed from the null model at different scales (Figure 6), with surviving individuals significantly more aggregated than dead individuals for 13 species (17.6%). However, dead individuals were significantly more aggregated than surviving individuals for 19 species (25.6%). The results derived from the function K1(r) – K12(r) showed that surviving individuals tended to be surrounded by more surviving individuals than expected by chance for 25 species (33.8%), with four species (5.4%) showing the opposite pattern. For dead individuals, 33 species (44.6%) tended to be surrounded by more dead individuals than expected by chance, whereas four species (5.4%) tended to be surrounded by more surviving individuals than expected by chance. Spatially aggregated tree species distributions were dominant across the plot for surviving and dead individuals.
Examples of differences between the spatial pattern of surviving and dead individuals of species in the 20-ha forest dynamics plot at Dinghushan, China. The solid line indicates the observed difference and the dashed lines indicate the 2.5% and 97.5% percentiles of the distribution of the difference computed on 99 random assignments of the labels surviving and dead. K1: univariate K function for the pattern of surviving individuals. K2: univariate K function for the pattern of dead individuals. K12: bivariate K function for the bivariate pattern of surviving and dead individuals. Difference of aggregation between surviving and dead individuals (a and b, Neolitsea umbrosa and Aporosa yunnanensis). Positive departures denote surviving individuals are more aggregated than dead individuals, vice versa. Evaluation of the tendency of surviving individuals to be surrounded by other surviving individuals of the same species (c and d, Blastus cochinchinensis and Cryptocarya chinensis). Evaluation of the tendency of dead individuals to be surrounded by other dead individuals of the same species (e and f, Syzygium rehderianum and Cryptocarya concinna). A positive departure represents individuals that are surrounded by more of the same type of individuals than expected by chance, and a negative departure represents individuals that are surrounded by more of the other type of individuals (c–f).

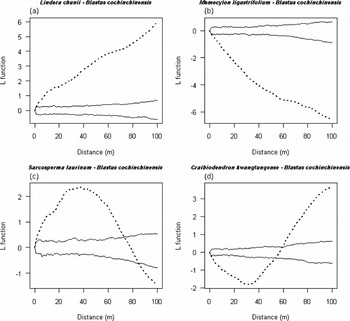
Tree mortality showed significant positive associations with intraspecific individuals for all 74 species, but at different scales. Our interspecific association analyses for all 20 species indicated that all 380 species pairs departed from the null model in different directions and different scales (Figure 7). A total of 170 species pairs (44.7%) showed a significant positive association, 184 species pairs (48.4%) showed a significant negative association, and two species pairs showed significant positive associations at small scales and significant negative associations at large scales. The rest of the 24 species pairs had no clear pattern.
Examples of interspecific spatial associations between all individuals and dead individuals in Dinghushan plot. The dotted line is the observed L(r) and the solid lines represent the simulations envelopes under the null model. Significant associations occur at scales where the observed L(r) exceeds the simulated envelopes. The observed positive departure of L(r) from the envelopes indicates that dead individuals of a species tend to be surrounded by more interspecific individuals than expected by chance within a given distance, and a negative departure of L(r) from the envelopes indicates that dead individuals of a species tend to be surrounded by less interspecific individuals than expected by chance within a given distance. Lindera chunii–Blastus cochinchinensis, positive association (a); Memecylon ligustrifolium–Blastus cochinchinensis, negative association (b); Sarcosperma laurinum–Blastus cochinchinensis, positive association at small scales and negative association at large scales (c); Craibiodendron kwangtungense–Blastus cochinchinensis, negative association at small scales but positive association at large scales (d).

DISCUSSION
Our analysis of forest dynamics reveals the pace of important ecological processes. The study over a 5-y census interval in a subtropical forest in Southern China allowed us to compare the forest dynamics of several forest types that range across tropical, subtropical and temperature latitudes. We found that the subtropical forest plot in Dinghushan was much more dynamic than the tropical and temperature forests used for comparison (Table 2). Our results also indicate that although nearly all of the species in the Dinghushan plot exhibited a reverse J-shaped curve, suggesting a stable population with recruitment, the three most dominant species showed a bell-shaped curve, suggesting a declining population resulting from a lack of recruitment. Therefore, we examine the implications of size-class distributions on long-term forest dynamics and explore whether other factors, such as population size, demographic rates or transition probabilities can be used to further inform interpretations of size-class distributions. Our study suggests that comparing population structures, transition probabilities and the rates of demographic processes is useful for evaluating contrasting species and forest types.
Comparison of demographic rates among forest dynamics plots of 50 ha at Barro Colorado Island, Panama (BCI), 50 ha at Pasoh, Malaysia, 20 ha at Dinghushan (DHS), China and 25 ha at Changbaishan (CBS), China.

Contrary to our hypothesized results, we found Dinghushan forest to be substantially more dynamic than tropical forest plots in BCI and Pasoh and the temperate plot in Changbaishan, with 50% of the species at Dinghushan showing an annual population change rate greater than 5% (Table 2). The pace of forest dynamics integrates numerous factors, including topography (Bellingham & Tanner Reference BELLINGHAM and TANNER2000), geology and climate (Condit et al. Reference CONDIT, ASHTON, MANOKARAN, LAFRANKIE, HUBBELL and FOSTER1999), organisms present and the stage of succession, and anthropogenic factors in lands surrounding the reserve (Laurance et al. Reference LAURANCE, USECHE, RENDEIRO, KALKA, BRADSHAW, SLOAN, LAURANCE, CAMPBELL, ABERNETHY and ALVAREZ2012). Of these, topography most distinguishes Dinghushan from the other forest dynamics plots. The elevation of Dinghushan plot varies from 230 m to 470 m and contains numerous extremely steep slopes (Wang et al. Reference WANG, YE, CAO, HUANG, LIAN, LI, WEI and SUN2009). Topography is therefore considerably more complicated than the other forest plots, with elevation differences of less than 40 m in Changbaishan, Pasoh and BCI plots. We suggest that greater topographic variation in the Dinghushan plot may contribute to greater demographic dynamism than the other forest dynamics plots. Comparison of demographic rates among forest dynamics plots also indicates that Dinghushan has a relatively low basal area of 26.6 m2 ha−1 compared with approximately 30 m2 ha−1 in Pasoh and Barro Colorado, and 44.5 m2 ha−1 in Changbaishan. Dinghushan also had the fastest species turnover rate and largest exponential mortality coefficient of the forest plots compared (Table 2). Aside from recruitment, which was the only demographic rate that was fairly similar among the forest plots, the subtropical forest at Dinghushan is highly dynamic.
Our data revealed sharply contrasting size-class distributions between dominant and co-dominant species. Although a reverse J-shaped size-class distribution is normally considered to be stable, and a bell-shaped size-class distribution is normally considered to be a warning of population decline (Condit et al. Reference CONDIT, SUKUMAR, HUBBELL and FOSTER1998), there is some evidence that this may not hold true for some species and must be considered in combination with recruitment of individuals into successive size classes. For example, Venter & Witkowski (Reference VENTER and WITKOWSKI2010) reported that the large and long-lived South African Adansonia digitata, albeit from a very different forest type, exhibits an approximately bell-shaped size-class distribution. Yet they also reported that there was no significant reduction of fruit production in large trees, and that mortality rate was extremely low. In addition, young individuals had much higher RGR than old individuals (Dhillion & Gustad Reference DHILLION and GUSTAD2004). These authors reasoned that bell-shaped size-class distributions may not be a concern for large and long-lived species because they can maintain current populations with only a few recruits. Bell-shaped size-class distributions thus may signify episodic recruitment rather than a declining population. Our calculated quotients between successive size-classes and permutation index values suggest unstable results for dominant species (Figure 4). However, individual sizes of dominant species were much larger than other species and they appear to survive for several hundred years. In addition, seed traps indicate that adult fruit production by dominant species is much greater than sub-dominant species (Ye et al. unpubl. data), and seedling recruitment was not deficient (Ye et al. unpubl. data). Therefore, dominant species in Dinghushan may successfully maintain a stable bell-shaped size class distribution.
Other factors that could contribute to stable bell-shaped size class distributions among dominant species are the very high RGR found in saplings (Figure 3d–f) and the increasing Pxy with increasing size-classes (Figure 5b) at Dinghushan. Thus RGR may be one of the causes of the bell-shaped size class distribution because stems of dominant species had high RGR during the sapling phase, but it decreased rapidly once they entered the intermediate size classes (Figure 3d–f). This is consistent with other studies demonstrating rapidly declining growth rates of tropical trees (Condit et al. Reference CONDIT, SUKUMAR, HUBBELL and FOSTER1998, Dhillion & Gustad Reference DHILLION and GUSTAD2004), and offers an explanation for the peak in intermediate-size stems. If stems pass fleetingly through the sapling phase, but have less of a chance of growing into the largest dbh class, a bell-shaped size-class distribution would develop. Size-class distributions for dead stems were also close to bell-shaped for dominant species, and the number of dead stems was positively significantly correlated with the number of stems in each size-class (R = 0.615). Thus recent mortality does not appear to be a reason for the bell-shaped size-class distribution. Rather, our data points to variation in RGR among size classes that reinforces the bell-shaped size-class distribution. The transition probabilities among dominant species also contributed to maintaining a stable population with a bell-shaped size-class distribution. Mean Pxy of dominant species were larger than co-dominant species, and Pxy increased as size-class increased (Figure 5b), which indicates that the population can retain a certain amount of individuals, particularly large individuals. For Castanopsis chinensis and Schima superba, Pxy had a peak in the second size class. Saplings can quickly grow to the next size class for these species, which supports our conclusion that dominant species can maintain current populations with only a few recruits.
Tree mortality is one of the most important factors influencing forest dynamics (Lewis et al. Reference LEWIS, PHILLIPS, SHEIL, VINCETI, BAKER, BROWN, GRAHAM, HIGUCHI, HILBERT and LAURANCE2004). Spatial pattern analysis is considered an effective tool to research tree mortality because it reveals many of the processes and mechanisms of forest dynamics (de la Cruz et al. Reference DE LA CRUZ, ROMAO, ESCUDERO and MAESTRE2008). The spatial segregation hypothesis can be used for explaining species coexistence mechanisms through spatial analyses (Chesson Reference CHESSON2000). This hypothesis suggests that intraspecific aggregation leads to interspecific segregation, and as a result, competition occurs mostly among intraspecific individuals in the community rather than interspecific individuals. Furthermore, this hypothesis predicts that competitively superior species will be suppressed, preventing the elimination of competitively inferior species and promoting species coexistence in the community (Chesson Reference CHESSON2000, Tilman Reference TILMAN1994). Our results supported this hypothesis. In the analysis of spatial associations between all individuals and dead individuals, we found very strong spatial associations between all individuals and dead individuals in both intra- and interspecific cases with 100% and 93.7% of cases significantly departing from null models in intra- and interspecific cases, respectively. However, positive associations, which indicate competitive relationships, were more frequent in intraspecific (100%) than interspecific cases (44.7%). This suggests that any competition that induced tree mortality occurred more frequently in intraspecific rather than in interspecific associations, and that the death of the majority of individuals resulted from intraspecific competitive exclusion.
Previous studies in two tropical forest communities showed that tree mortality is regulated by intraspecific density-dependent processes not only for the earliest stage of plant establishment but also for large trees (Peters Reference PETERS2003), consistent with our results. We propose that conspecifics share pests and pathogens, but also resource requirements, and therefore experience intense competition among conspecifics for obtaining resources, which contributes to mortality (Burkey Reference BURKEY1994, Janzen Reference JANZEN1970, Nathan & Casagrandi Reference NATHAN and CASAGRANDI2004). Tree mortality reveals that interspecific relationships are more complicated than intraspecific relationships. In temperate forest, species of the same family, fruit type or habitat association had more frequent competitive associations than expected by chance, with facilitative associations more frequent for species sharing the same canopy layer (Wang et al. Reference WANG, WIEGAND, HAO, LI, YE and LIN2010). This finding is not completely consistent with our results because we found that competitive associations were more frequent than facilitative associations for species sharing the same canopy layer (57.9% vs. 36.9%). We suggest that in Dinghushan species sharing the same canopy layer have similar resource requirements and tree mortality was associated with competition among the individuals in the same layer.
Our data also demonstrate that facilitative associations were more frequent than competitive associations between all individuals of species in upper layers and dead individuals of species in lower layers (53.5% vs. 38.3%). There is a possibility that upper-canopy species create a suitable environment for lower-stature species, and if canopy individuals die, the environment can become less hospitable and lead to death of subcanopy individuals (Flores & Jurado Reference FLORES and JURADO2003). However, ontogenetic factors could also affect the outcome of facilitative interactions (Callaway & Walker Reference CALLAWAY and WALKER1997), and spatial scales should be included in the analyses because spatial processes and mechanisms may act on different scales (Wiegand et al. Reference WIEGAND, MARTINEZ and HUTH2009).
In summary, Dinghushan forest appears more dynamic than Changbaishan, BCI and Pasoh based on comparisons of their demographic rates, but more studies are required to understand the mechanisms of differences in vital rates. Our data also indicate that it is not appropriate to predict population dynamics using size-class distribution alone, because other factors such as relative growth rate, individual size, transition probabilities and longevity should be considered for a complete picture. Finally, we found that tree mortality was much more frequently associated with intraspecific competitive exclusion and density dependence than interspecific interactions. Overall, the intraspecific effects observed in these forests appear to contribute to species coexistence.
ACKNOWLEDGEMENTS
We thank many individuals in South China Botanical Garden who contributed to the field survey of Dinghushan plot, and the Center for Tropical Forest Science and Smithsonian Tropical Research Institute for data support. The study was funded by National Natural Science Foundation of China (31061160188-02), Knowledge Innovation Project of the Chinese Academy of Sciences (KZCX-YW-430-03), the National Natural Science Foundation of China (31011120470-02), National Natural Science Foundation of China (31100312) and Chinese Forest Biodiversity Monitoring Network.
Species list in the 20-ha Dinghushan Forest Dynamics Plot, China. Status a, b and c indicate species that were present in the two censuses (2005–2010), absent in the last census and present in the last census, respectively. Abundance 1 and Abundance 2 indicate the number of stems for each species in the first and the last census, respectively, 101 species that had at least 20 stems at the first measurement are included.