Introduction
Titanium matrix composites (TMCs) have been widely considered due to their high specific strength, specific modulus, and specific stiffness at room and elevated temperatures [Reference Tjong and Mai1, Reference Huang, Geng, Peng and Zhang2]. The ceramic particles reinforced TMCs also have received considerable attention due to their excellent physical and mechanical properties and isotropic characteristic as well as low cost [Reference Huang, Geng, Peng and Zhang2, Reference Sen, Tamirisakandala, Miracle and Ramamurty3, Reference Boehlert, Tamirisakandala, Curtin and Miracle4]. So this kind of materials can be widely applied in many fields, such as advanced military, automobile, aviation, and aerospace [Reference Tjong and Mai1, Reference Sun, Han, Cao, Qiu and Lu5, Reference Li, Kondoh, Imai, Chen, Jia, Umeda and Fu6]. The commonly used ceramic reinforcements are involved in La2O3 [Reference Qiu, Li, Sun, Han, Huang, Lu and Zhang7], SiC [Reference Luo, Zhu, Yang, Huang, Jin, Xu and Zhang8], TiC [Reference Ma, Mishra and Tjong9, Reference Andrieux, Gardiola and Dezellus10, Reference Ma, Wang, Liu, Li, Liu, Chen, Zhang and Han11], Ti2C [Reference Wanjara, Drew, Root and Yue12], TiB2 [Reference Namini and Azadbeh13], TiB [Reference Zhang, Wang, Chen, Feng and Yu14, Reference Ma, Lu, Liu, Li, Liu, Chen, Zhang, Pan, Lu and Zhang15], and so on. Among these reinforcements, TiC and TiB have drawn great attention because of the excellent thermodynamic stability and similar coefficient of thermal expansion (CTE) to the titanium matrix [Reference Li, Kondoh, Imai, Chen, Jia, Umeda and Fu6]. Generally, the TMCs can be fabricated by ex situ or in situ methods. Compared with the former preparation method, the in situ TMCs exhibit a series of advantages, such as strong bonding between matrix and reinforcement, low contamination, ease of processing, and so on [Reference Jiao, Huang and Geng16]. The in situ synthesis techniques include mechanical alloying (MA), powder metallurgy (PM), self-propagation high-temperature synthesis (SHS), and casting [Reference Attara, Ehtemam-Haghighi, Kent and Dargusch17]. Recently, many popular preparation methods involving reaction hot pressing (RHP), spark plasma sintering (SPS), and hot isostatic pressing (HIP) emerge based on the conventional PM process. The RHP method possesses microstructural regulation, near-net shape processing, and minimal materials waste, and particularly, the ability to render composites with densification and excellent mechanical properties [Reference Jiao, Huang and Geng16]. Presently, quite a lot of work has been done on the fabrication, microstructures, and mechanical properties of (TiB and/or TiC)/Ti matrix composites through in situ reactions from Ti–B [Reference Ma, Lu, Liu, Li, Liu, Chen, Zhang, Pan, Lu and Zhang15], Ti–TiB2 [Reference Zhang, Wang, Chen, Feng and Yu14, Reference Gorsse and Miracle18], Ti–C [Reference Andrieux, Gardiola and Dezellus10, Reference Ma, Wang, Liu, Li, Liu, Chen, Zhang and Han11], Ti–B4C [Reference Tjong and Mai1, Reference Huang, Geng, Peng and Zhang2, Reference Qin, Geng and Ni19], and Ti–B4C–C [Reference Rahoma, Chen, Wang and Xiao20, Reference Wang, Wang, Luo, Yan, Li, Chen, Su, Guo and Fu21] systems. However, most of investigations are focused on the fabrication and mechanical properties of TMCs, and less attention has been paid to their oxidation resistance. In fact, the oxidation resistance of materials is very important for the applications at high temperatures. To broaden the application scope of ceramic particles reinforced TMCs to the high temperature fields, their oxidation behavior should be further understood.
In recent years, many efforts have been devoted to the improvement of overall service performance of TMCs. The TMCs prepared by in situ synthesis method can possess better properties compared with those fabricated by the traditional preparation methods [Reference Qin, Lu, Xu and Zhang22]. As a result, this kind of method was often used to produce the TiC and/or TiB reinforced TMCs [Reference Lu, Zhang, Zhang, Wu, Sakata and Mori23, Reference Zhang, Lu, Zhang, Wu, Bian and Fang24]. For instance, Qin et al. [Reference Qin, Zhang, Lu, Qin and Xu25] reported the oxidation behavior of TiB/(Ti–Al) composites and concluded that the oxidation kinetics of in situ synthesized composites basically followed a parabolic law at 823–923 K and that the TiB can enhance the oxidation resistance due to the uniform distribution and fine microstructure. Zhang et al. [Reference Zhang, Li, Li and He26] investigated the oxidation behavior of in situ synthesized TiC/Ti–6Al composites in air and found that its oxidation kinetics also followed a parabolic law.
In this paper, the (TiB + TiC)/Ti–6Al–4V composites with nominal 10 and 15 vol% reinforcement (n TiB:n TiC = 1:1) were in situ synthesized from Ti–B4C–C and Ti–TiB2–TiC systems by reactive hot-pressed sintering at three temperatures (1473, 1523, and 1573 K), and then the oxidation behavior of the composites were studied at 873, 973, and 1073 K for 320 h in air. After that, phase composition and microstructures of the oxide layer were investigated for illuminating the oxidation mechanisms of (TiB + TiC)/Ti–6Al–4V composites.
Results and discussion
Thermodynamic analysis
Some oxidation reactions of (TiB + TiC)/Ti–6Al–4V composites (composed of Ti, Al, V, TiB, and TiC) at temperatures of 873, 973, and 1073 K in air may occur as follows:
 $${\rm{Ti}}\left( {\rm{s}} \right) + {{\rm{O}}_2}\left( {\rm{g}} \right) = {\rm{Ti}}{{\rm{O}}_2}\left( {\rm{s}} \right)\quad ,$$
 $${4 / {3{\rm{Al}}\left( {\rm{s}} \right) + {{\rm{O}}_2}\left( {\rm{g}} \right) = {2 / 3}{\rm{A}}{{\rm{l}}_2}{{\rm{O}}_3}\left( {\rm{s}} \right)\quad ,}}$$
 $${4 / {3{\rm{V}}\left( {\rm{s}} \right) + {{\rm{O}}_2}\left( {\rm{g}} \right) = {2 / 3}{{\rm{V}}_2}{{\rm{O}}_3}\left( {\rm{s}} \right)\quad ,}}$$
 $${4 / 5}{\rm{V}}\left( {\rm{s}} \right) + {{\rm{O}}_2}\left( {\rm{g}} \right) = {2 / 5}{{\rm{V}}_2}{{\rm{O}}_5}\left( {\rm{s}} \right)\quad ,$$
 $${1 / 2}{\rm{TiC}}\left( {\rm{s}} \right) + {{\rm{O}}_2}\left( {\rm{g}} \right) = {1 / 2}{\rm{Ti}}{{\rm{O}}_2}\left( {\rm{s}} \right) + {1 / 2}{\rm{C}}{{\rm{O}}_2}\left( {\rm{g}} \right)\quad ,$$
 $${4 / 7}{\rm{TiB}}\left( {\rm{s}} \right) + {{\rm{O}}_2}\left( {\rm{g}} \right) = {4 / 7}{\rm{Ti}}{{\rm{O}}_2}\left( {\rm{s}} \right) + {2 / 7}{{\rm{B}}_2}{{\rm{O}}_3}\left( {\rm{g}} \right)\quad .$$
In the process of oxidation of (TiB + TiC)/Ti–6Al–4V composites, the reactions (1)–(4) can occur in the matrix phase, while the reactions (5) and (6) can take place in the reinforcement phase. The Gibbs free energy (ΔG) of these reactions was calculated using the thermodynamic data from Ref. Reference Barin27. The ΔG is defined as
 $$\Delta G = \Delta H - T\Delta S\quad ,$$
where ΔH, T, and ΔS are the enthalpy change, thermodynamic temperature, and entropy change, respectively.
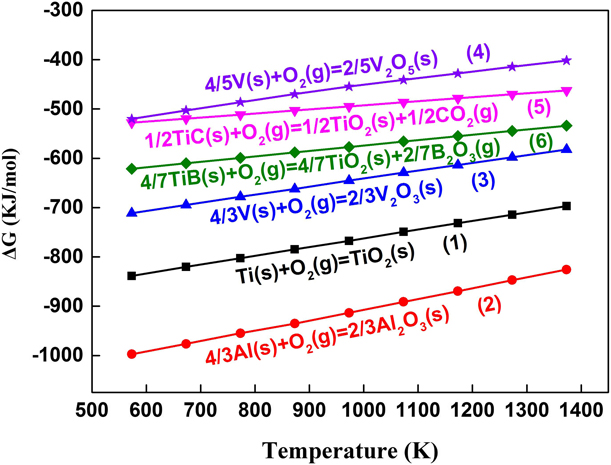
Figure 1 shows the calculation results of reactions (1)–(6). It is clear that all the ΔG values are negative, indicating that all these reactions can take place when the oxidizing temperature climbs from 573 to 1373 K. Moreover, the ΔG values of the reactions (4)–(6) are higher than those of reactions (1)–(3), showing that the tendency of oxidation reactions (4)–(6) is lower under the same condition.

Oxidation kinetics
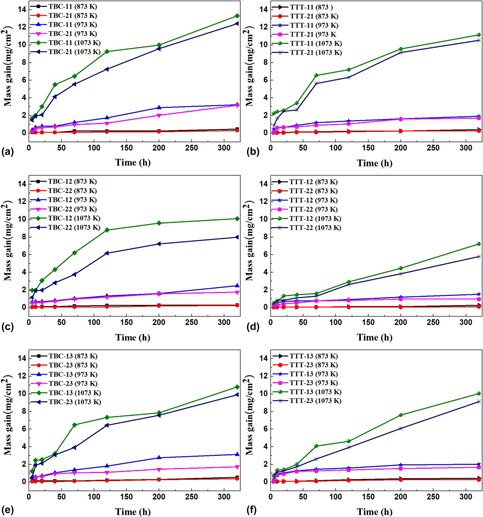
Figure 2 presents oxidation weight gain curves of various (TiB + TiC)/Ti–6Al–4V composites at 873, 973, and 1073 K for 320 h. It is clear that the oxidation weight gains are limited when the composites are oxidized at 873 and 973 K. However, the oxidation weight gain increases greatly when the oxidation temperature increases to 1073 K, and the oxidation weight gain decreases with the nominal volume fraction of reinforcement increasing. Moreover, the oxidation weight gains of the composites from Ti–TiB2–TiC system are lower than those from Ti–B4C–C system while sintering and oxidizing at same temperatures. In particular, the oxidation weight gains of the composites sintered at 1523 K from the above two systems are lower than those sintered at the other two temperatures while oxidizing at same temperatures. So the optimal oxidation resistance of the (TiB + TiC)/Ti–6Al–4V composites can be obtained from the Ti–TiB2–TiC system while employing 15 vol% reinforcement and sintering at 1523 K.
Oxidation weight gain curves of (TiB + TiC)/Ti–6Al–4V composites fabricated by different synthesis systems and sintering temperatures: (a) Ti–B4C–C system, 1473 K, (b) Ti–TiB2–TiC system, 1473 K, (c) Ti–B4C–C system, 1523 K, (d) Ti–TiB2–TiC system, 1523 K, (e) Ti–B4C–C system, 1573 K, and (f) Ti–TiB2–TiC system, 1573 K.

Usually, the oxidation weight gain curves are expressed as [Reference Wei, Zhang, Yao, Liang, Miao and Xu28, Reference Castaldi, Kurapov, Reiter, Shkover, Schwaller and Patscheider29]
 $$\Delta {m^n} = {K_n}t\quad ,$$
where m, n, K n, and t are the mass gain per unit area, reaction index, rate constant, and time, respectively. Equation (8) can be also simplified into the following form and then we can obtain the n value and K n value [Reference Yang, Xiu, Wang, Liu, Chen and Wu30]:
 $$\ln \left( {\Delta m} \right) = {1 \over n}\ln \left( {{K_n}} \right) + {1 \over n}\ln t\quad .$$
In accordance with different n values (1, 2, and 3), the oxidation weight gain curves can be divided into linearity, parabola, and cubic, respectively. Table I lists the values of n calculated from the Eq. (9). It is obvious that the oxidation weight gain curves of the composites basically obey parabolic law at 973 K for all the samples. However, when the oxidation temperatures are 873 and 1073 K, the oxidation weight gain curves of the composites from Ti–B4C–C and Ti–TiB2–TiC systems mainly follow linear and parabolic-linear laws, respectively. Furthermore, the composite (TTT-22 sample) with higher nominal volume fraction reinforcement, which was fabricated from the Ti–TiB2–TiC system and sintered at 1523 K, possesses higher n value at the oxidation temperatures of 873, 973, and 1073 K, respectively. Combining with Fig. 2, it further indicates that this kind of composite has better oxidation resistance.
Calculated values of the reaction index (n) for oxidation weight gain as a function of temperature.

Besides, the rate constant K n follows an Arrhenius relation as follows [Reference Lee, Kim, Yang, Lee, Yang and Kim31, Reference Liu, Liu, Zhao, Chen and Tang32]:
 $${K_n} = {K_0}\exp \left( { - {{{Q_{{\rm{eff}}}}} \over {RT}}} \right)\quad ,$$
where k 0, Q eff, R, and T are the constant for a given material, effective activation energy for oxidation, universal gas constant, and absolute temperature, respectively. The Eq. (10) can be transformed into the Eq. (11), so that we can calculate the value of Q eff as
 $$\ln {K_n} = \ln {K_0} - {{{Q_{{\rm{eff}}}}} \over {RT}}\quad .$$
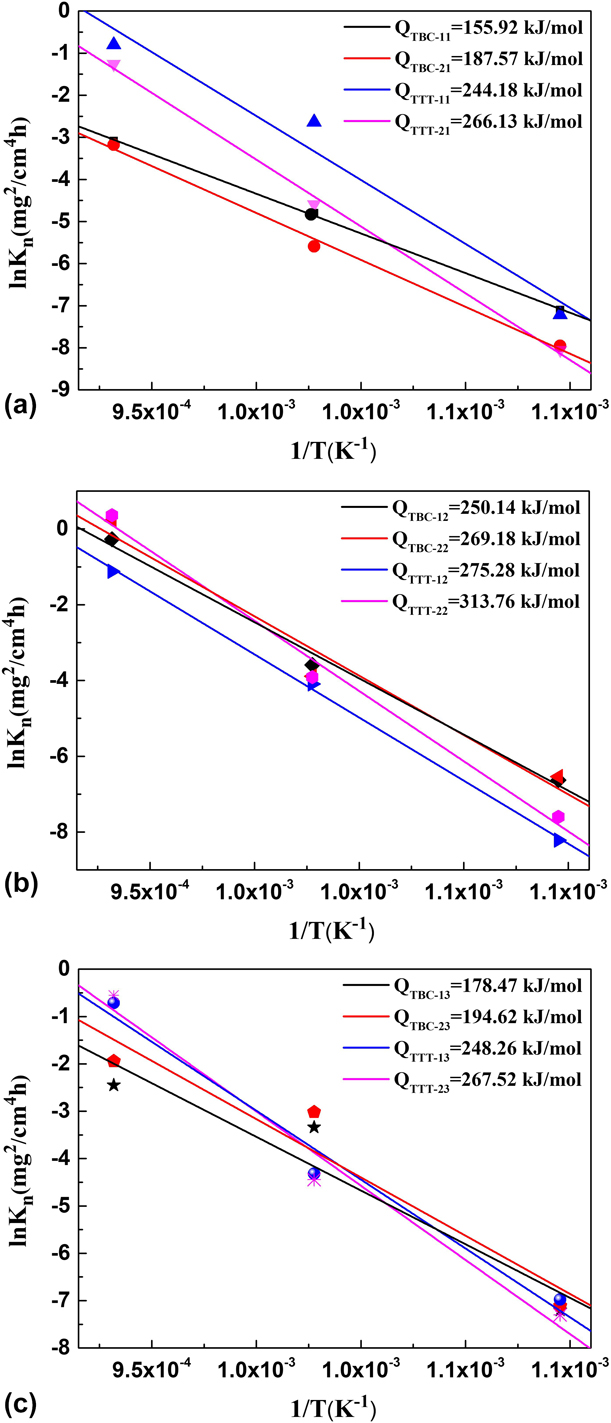
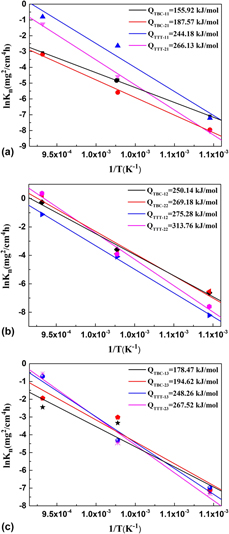
Figure 3 shows a plot of K n in logarithm scale versus 1/T. The slope coefficient of the plots reflects the effective activation energy (Q eff) of the (TiB + TiC)/Ti–6Al–4V composites during oxidation. Some investigations suggest that the higher the Q eff value of the composite, the higher the oxidation resistance [Reference Zhang, Zeng and Zeng33, Reference Li, Gao, Liang and Zhang34, Reference Du, Datta, Lewls and Burnell-Gray35, Reference Yang, Lu, Qin and Zhang36]. From Fig. 3, the Q eff values of the composites increase more or less with increasing the nominal volume fraction of reinforcement, indicating that the additions of TiB and TiC can improve the oxidation resistance of the composites. And the Q eff values of the composites from the Ti–TiB2–TiC system are higher than those from the Ti–B4C–C system while employing the same sintering temperatures and nominal volume fractions of reinforcement. Moreover, all the Q eff values of composites sintered at 1523 K are higher than those sintered at 1473 and 1573 K while employing the same synthesis system and nominal volume fractions of reinforcement. Thus, the 15 vol% (TiB + TiC)/Ti–6Al–4V composite sintered at 1523 K from Ti–TiB2–TiC system possesses higher Q eff value, showing the higher oxidation resistance.
Arrhenius plot of parabolic rate constant (K n) for oxidation of (TiB + TiC)/Ti–6Al–4V composite samples at 873, 973, and 1073 K for 320 h: (a) TBC-11, TBC-21, TTT-11, TTT21, (b) TBC-12, TBC-22, TTT-12, TTT-22, and (c) TBC-13, TBC-23, TTT-13, TTT-23.

Phase composition
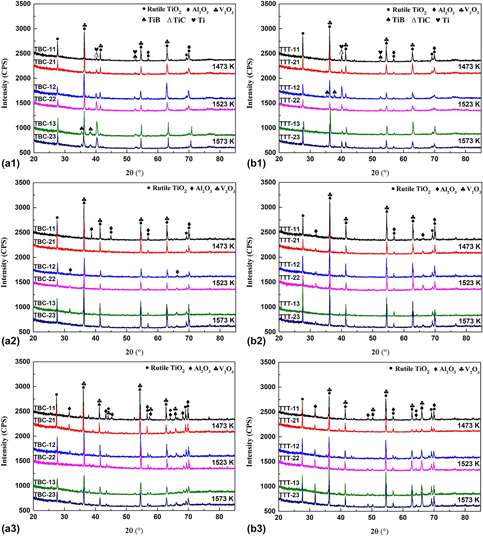
Figure 4 presents the X-ray diffraction (XRD) patterns of all the (TiB + TiC)/Ti–6Al–4V composites oxidized at 873–1073 K for 320 h. As shown in Fig. 4, the oxidation products of the composites are mainly composed of rutile TiO2, V2O3, and Al2O3 since the Ti–6Al–4V alloy acts as matrix of the composites. The other oxides, such as B2O3, cannot be detected by XRD. Generally, B2O3 is amorphous and evaporates easily [Reference Hu, Huang, Geng, Liu and Wang37, Reference Zhang, Zeng and Zeng38], as a result of that B2O3 cannot appear. Similar findings were also observed in other TiB and TiC reinforced TMCs [Reference Du, Datta, Lewls and Burnell-Gray35, Reference Qin, Zhang, Lu and Pan39, Reference Qin, Zhang, Lu and Pan40]. However, TiB, TiC, and Ti still present in the oxidation layers of the composites oxidized at 873 K [Figs. 4(a1) and 4(b1)], indicating that the oxide layers on the composites are quite thin. The rutile TiO2, V2O3, and Al2O3 diffraction peak intensities of all the samples decrease with the nominal volume fraction of reinforcement increasing, and they decrease first and then increase with the sintering temperature increasing from 1473 to 1573 K. This can be attributed to the integrated result of the higher reinforcement content in raw materials and the higher effective activation energy (Q eff). Moreover, the rutile TiO2, V2O3, and Al2O3 peaks strengthen with the oxidation temperature increasing from 873 to 1073 K, meaning that the composites suffer much more severe oxidation at the higher oxidation temperature. These results are well consistent with the ones obtained from the oxidation kinetics (Table I and Figs. 2 and 3).
XRD patterns of (TiB + TiC)/Ti–6Al–4V composites derived from two different synthesis systems after oxidation at three different temperatures for 320 h: (a1) Ti–B4C–C system, 873 K, (b1) Ti–TiB2–TiC system, 873 K, (a2) Ti–B4C–C system, 973 K, (b2) Ti–TiB2–TiC system, 973 K, (a3) Ti–B4C–C system, 1073 K, and (b3) Ti–TiB2–TiC system, 1073 K.

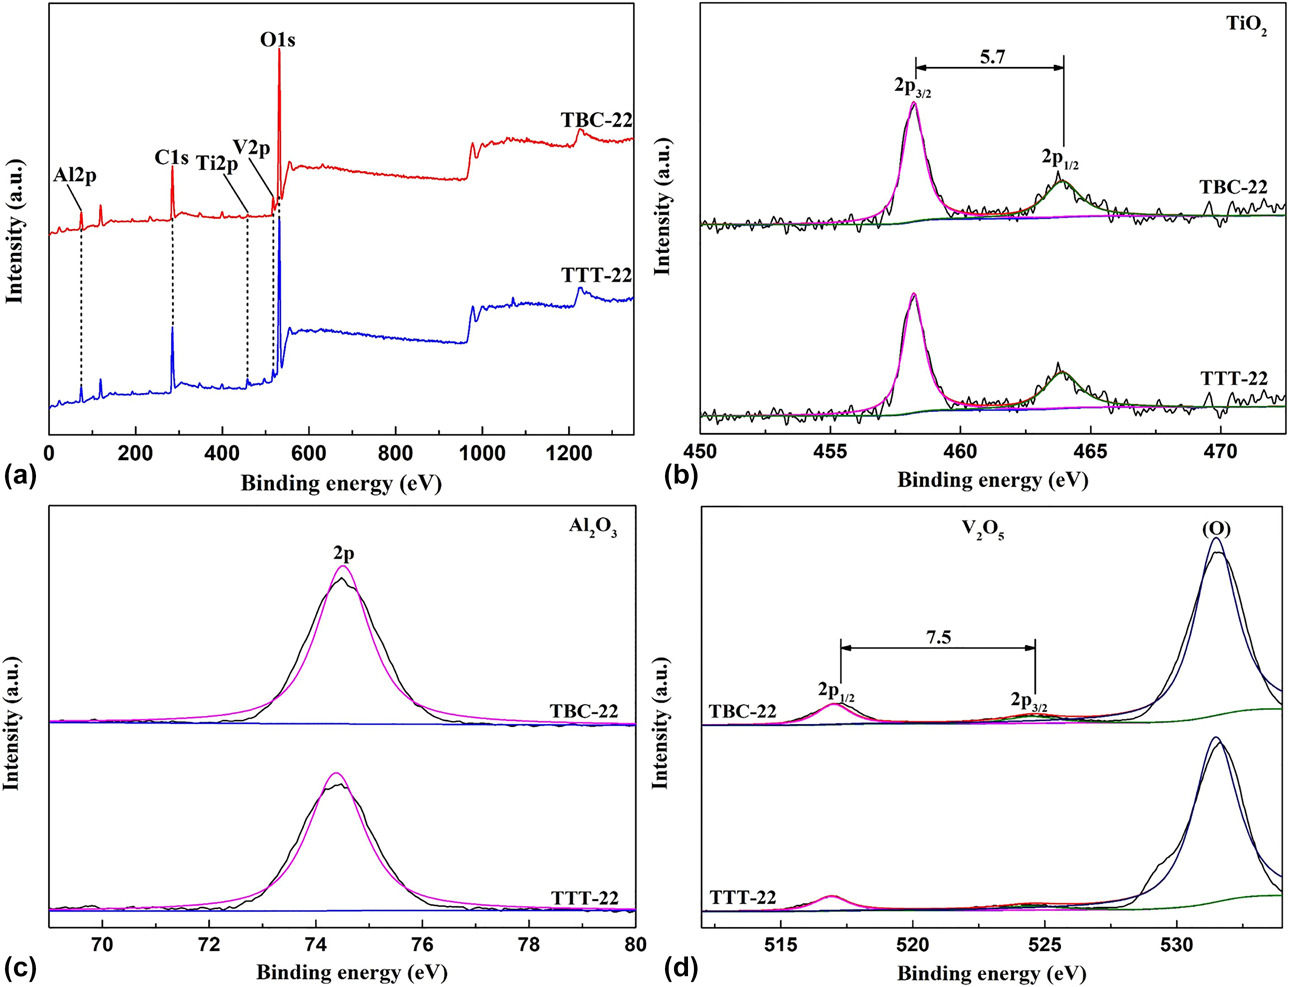
To further investigate the phase compositions of the oxide layers on the composites, the Ti 2p, Al 2p, and V 2p X-ray photoelectron spectrum (XPS) spectra recorded for the surfaces of the composites after oxidation for 320 h are presented in Fig. 5(a). According to the binding energies of the Ti 2p 3/2, Al 2p, and V 2p 1/2, spectra shown in Figs. 5(b)–5(d), it can be concluded that the corresponding oxide products are the TiO2, Al2O3, and V2O5, respectively. From Fig. 5, the oxide layers on the composites from Ti–B4C–C and Ti–TiB2–TiC systems have basically the same phase composition. Moreover, the V element in the composite is oxidized to V2O5. However, the XPS result is different from the XRD one, which can be attributed to the diverse detection depths from these two characterization techniques. XRD test can detect a depth of tens of microns from sample surface, while XPS test only detects a depth of several nanometers. Thus, V mainly presents in the form of V2O5 on the surface of the oxide layers, while in the form of V2O3 in the interior of the oxide layers.
XPS spectra of the TBC-22 and TTT-22 samples after oxidation at 973 K for 320 h: (a) Survey spectra, (b) Ti, (c) Al, and (d) V.

Microstructures
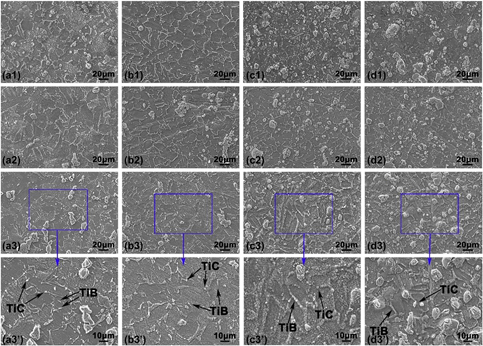
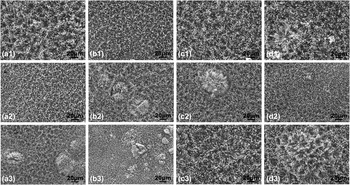
Figures 6, S1, and 7 show the scanning electron microscopy (SEM) images of the outer surfaces of (TiB + TiC)/Ti–6Al–4V composites after oxidation for 320 h in the temperature range of 873–1073 K. It is clear that the top oxide layers on the (TiB + TiC)/Ti–6Al–4V composites are continuous and crack-free. And there is no detachment or spallation of oxide layer. From Fig. 6, the morphologies of the reinforcements TiB and TiC can be observed, indicating that the oxide layers on the surfaces of all the composites oxidized at 873 K are thinner. However, the reinforcements TiB and TiC cannot be observed when the oxidation temperature climbs to 973 and 1073 K (Figs. S1 and 7), indicating that the oxide layers become thicker. Accordingly, the oxidation degree of the composites oxidized at 1073 K is much more serious than that at 973 K. Moreover, the sizes of oxide crystals decrease with the nominal volume fraction of reinforcement increasing, but there is no evident difference in the morphologies of oxide layers on the composites from the two systems sintered at the same temperatures.
SEM images of the outer surfaces of (TiB + TiC)/Ti–6Al–4V composites after oxidation at 873 K: (a1) TBC-11, (a2) TBC-12, (a3, a3′) TBC-13, (b1) TBC-21, (b2) TBC-22, (b3, b3′) TBC-23, (c1) TTT-11, (c2) TTT-12, (c3, c3′) TTT-13, (d1) TTT-21, (d2) TTT-22, and (d3, d3′) TTT-23.

SEM images of the outer surfaces of (TiB + TiC)/Ti–6Al–4V composites after oxidation at 1073 K: (a1) TBC-11, (a2) TBC-12, (a3) TBC-13, (b1) TBC-21, (b2) TBC-22, (b3) TBC-23, (c1) TTT-11, (c2) TTT-12, (c3) TTT-13, (d1) TTT-21, (d2) TTT-22, and (d3) TTT-23.

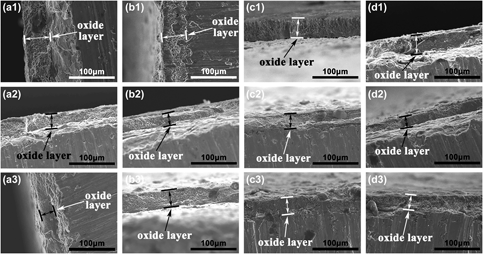
Figures 8 and S2 present the cross-sectional images of oxide layers on (TiB + TiC)/Ti–6Al–4V composites after oxidation at 973 and 1073 K for 320 h, respectively. From Fig. 8, the average thickness of oxide layers on the surfaces of the composites reaches ∼38 μm when the oxidation temperature rises to 973 K. With the oxidation temperature further rising to 1073 K, the average thickness of the oxide layers increases to ∼111 μm (Fig. S2). The oxide layers formed at 1073 K are peeled off from the composites, which can be attributed to the large thermal stresses generated during heating and cooling periods [Reference Huang, Geng, Fu, Kaveendran and Peng41]. Moreover, the thickness of the oxide layers decreases with the nominal volume fraction of reinforcement increasing. Meanwhile, the thicknesses of the oxide layers on the composites from Ti–TiB2–TiC system are thinner than those from Ti–B4C–C system while employing the same sintering temperatures and nominal volume fractions of reinforcement. In particular, the thickness of oxide layers on the composites sintered at 1523 K is thinner than those sintered at the other two temperatures while employing the same synthesis systems and nominal volume fractions of reinforcement. Therefore, it can be concluded that the (TiB + TiC)/Ti–6Al–4V composite with 15 vol% reinforcement (n TiB:n TiC = 1:1) fabricated from the Ti–TiB2–TiC system at 1523 K possesses better oxidation resistance no matter what oxidation temperature, resulting from the high volume percentage of reinforcement.
Cross-sectional SEM images of oxide layers on (TiB + TiC)/Ti–6Al–4V composites after oxidation at 973 K for 320 h: (a1) TBC-11, (a2) TBC-12, (a3) TBC-13, (b1) TBC-21, (b2) TBC-22, (b3) TBC-23, (c1) TTT-11, (c2) TTT-12, (c3) TTT-13, (d1) TTT-21, (d2) TTT-22, and (d3) TTT-23.

The oxidation behavior of (TiB + TiC)/Ti–6Al–4V composites basically follows the parabolic rate law (Fig. 2), which can also be proved by reaction index n (Table I). From the calculation results of Gibbs free energy (Fig. 1), the TiB and TiC are more difficult to react with oxygen than the Ti–6Al–4V matrix (involving Ti, Al, and V elements). Moreover, the oxide layers on the composites are mainly composed of fine oxide particles, which is closely related to the microstructural features of the in situ synthesized (TiB + TiC)/Ti–6Al–4V composites. As discussed in our previous study and the former researches [Reference Yi, Zhang, Liu, Wang, Shao and Qiao42, Reference Lu, Zhang, Zhang, Bian, Wu, Sakata and Mori43, Reference Lu, Zhang, Wu and Mori44, Reference Qin, Lu, Sheng, Yang and Zhang45], in situ synthesized TiB and TiC are uniformly distributed in the titanium alloy matrix, which can reduce the grain sizes of the matrix. Meanwhile, these uniformly distributed reinforcements can alleviate the oxidation degree of the composites and prevent the diffusion of oxygen into the composites, resulting in improvement on oxidation resistance of the (TiB + TiC)/Ti–6Al–4V composites.
Furthermore, the in situ synthesized reinforcements can mechanically pin the oxide layers, which can effectively prevent the oxide layers from debonding from the composites when the oxide layers are not too thick. The continuous oxide layers tightly adhered to the composites can contribute to preventing oxygen atoms diffusion into the composites [Reference Hu, Huang, Geng, Liu and Wang37, Reference Dutta Majumdar, Weisheit, Mordike and Manna46]. As a result, the oxidation resistance of (TiB + TiC)/Ti–6Al–4V composites is improved markedly. With increasing the nominal volume fraction of reinforcement, the reinforcements’ effect on hindering the oxygen’s diffusion turns bigger [Reference Hu, Huang, Geng, Liu and Wang37], and the effective activation energy of the composites also increases (Fig. 3), so that the oxide layers become thinner.
Conclusions
The oxidation weight gain curves of the (TiB + TiC)/Ti–6Al–4V composites at 973 K in air for 320 h basically obey parabolic law, while those from Ti–B4C–C and Ti–TiB2–TiC systems oxidized at 873 K and 1073 K follow linear and parabolic-linear laws, respectively. The oxide layers on the composites are mainly composed of rutile TiO2, Al2O3, and the mixture of V2O3 and V2O5. At the three oxidation temperatures, the oxidation layers turn thinner and the oxidation resistance ability becomes stronger with increasing the nominal volume fraction of reinforcement in all the (TiB + TiC)/Ti–6Al–4V composites. Moreover, the oxidation resistance ability of the composites from Ti–TiB2–TiC system is higher than that from Ti–B4C–C system while employing the same sintering temperatures and nominal volume fractions of reinforcement. In particular, the (TiB + TiC)/Ti–6Al–4V composites sintered at 1523 K possess better oxidation resistance while employing the same synthesis systems and nominal volume fractions of reinforcement. The (TiB + TiC)/Ti–6Al–4V composite with 15 vol% reinforcement fabricated from the Ti–TiB2–TiC system at 1523 K possesses the optimal oxidation resistance no matter what oxidation temperature.
Experimental procedures
On the basis of our previous study [Reference Yi, Zhang, Liu, Wang, Shao and Qiao42], the (TiB + TiC)/Ti–6Al–4V composites were fabricated by reactive hot-pressed sintering from two reaction systems: Ti–B4C–C and Ti–TiB2–TiC. These powders involving sponge Ti (99.4%, 47 μm), B4C (99%, 13 μm), graphite (98.5% purity, 5 μm), TiB2 (99%, 10 μm), TiC (99%, 10 μm), and Ti–6Al–4V (99.6%, 45–75 μm) were used as raw materials. Table SI lists the designed reinforcement volume percentages of all the samples and the corresponding reaction systems and sintering temperatures [Reference Yi, Zhang, Liu, Wang, Shao and Qiao42].
In order to investigate the oxidation resistance of the (TiB + TiC)/Ti–6Al–4V composites, the samples for oxidation tests were wire-cut from disc samples and machined into bars with dimensions of ∼3 × 4 × 10 mm. The resulting rectangular samples were polished with 200–1500# diamond abrasive papers in water, etched in the Kroll’s reagent (10 mL HF, 30 mL HNO3 and 200 mL H2O) for 15 s, and then washed in acetone and dried in vacuum evaporator. Afterward, the samples were weighed by electronic balance (GL124-1SCN, SARTORIUS, Göttingen, Germany) with a resolution of 0.1 mg and their sizes were measured to an accuracy of 0.01 mm before oxidation. Finally, the oxidation tests were carried out in a high temperature air furnace (N17/HR-K, Nabertherm, Lilienthal, Germany) at 873, 973, and 1073 K for 320 h, respectively. The oxidation kinetics was evaluated by generating mass gain per initial surface area as a function of time.
After oxidation tests, the oxide layer and oxidation products of the samples were characterized by XRD (XRD-D8 ADVANCE, Bruker, Karlsruhe, Germany), field-emission SEM (SEM-JSM-7001F, JEOL, Tokyo, Japan) coupled with energy-dispersive X-ray spectrometer (EDS, EX-64175JMV, JEOL, Tokyo, Japan), and XPS (XPS-ESCALAB250Xi, Thermo Fisher Scientific, Massachusetts, US). To measure the oxide thickness, the cross-sections of the oxidized samples were prepared for SEM observations.
Supplementary material
To view supplementary material for this article, please visit https://doi.org/10.1557/jmr.2019.84.
Acknowledgments
This work was supported by the National Natural Science Foundation of China (51572112), the National Key Research and Development Program of China (2017YFB0310400), the 333 talents project (BRA2017387), Six Talent Peaks Project (TD-XCL-004), Innovation/Entrepreneurship Program ([2015]26), and the Qing Lan Project ([2016]15) of Jiangsu Province.