1. INTRODUCTION
Mechatronics is a natural stage in the evolution of modern products, many containing components from different engineering domains, such as mechanical, electrical, and control systems. At early design stages, important decisions need to be made to determine which portions of an engineering design problem are best solved in each of these domains given the current state of technology. Decisions required include which parts should be designed as mechanical subsystems, which should be electronic, where actuators and sensors should be located, and how these subsystems should combine to achieve overall design optimality. In concurrent engineering practice, mechatronics represents a synergistic system design philosophy to optimize the system as a whole simultaneously (Isermann, Reference Isermann and Bishop2003). However, this ideal integrated design philosophy is still not formally carried out in practice because of the lack of system-level support for mechatronics conceptual design.
First, design in different engineering disciplines in general speaks different languages. There is the lack of a unified approach that integrates design and synthesis across multiple engineering domains. Second, there is the lack of a concurrent design process across mechatronic subsystems. Mechatronic systems are controlled electromechanical systems. In many cases, the time when a mechanical or electromechanical design is specified is also the time when many restrictions are inherently placed on the control system design. This may not lead to overall design optimality because subsystems in different domains are not designed concurrently. Third, there is the challenge of exploring various design alternatives automatically and creatively. Although computers have a definite advantage over humans in memory, accuracy, speed, and storage capability, their inability to make informed and intuitive decisions causes many to believe that they are not capable of embodying the innovative process of design synthesis. This perspective, however, has gradually changed with advances in the establishment of formalized design representation and design synthesis as computational search of the design space (Campbell, Reference Campbell2000).
Recently, there have been substantial successes in research on computational synthesis, especially using evolutionary algorithms (Bentley, Reference Bentley1999; Lipson et al., Reference Lipson, Antonsson and Koza2003), to address some of the problems and challenges mentioned above. Among various approaches, genetic programming is of particular interest because of its great potential for open-ended search of both design topologies and associated parameters. Much research has been carried on about design automation of analog electrical circuits using schematic diagrams (Koza, Reference Koza1999), controller design using block diagrams (Koza et al., Reference Koza, Keane, Yu, Bennett and Mydlowec2000), and mechatronic design using bond graphs (Goodman et al., Reference Goodman, Seo, Rosenberg, Fan, Hu and Zhang2002). Engineering systems in different domains can be described using different model representations, but for mechatronic product design involving multiple domains, a unified formal model representation is more desirable. The bond graph, a domain-neutral formal schematic paradigm, has gained wide recognition for representation and analysis of energetically coupled physical systems (Paynter, Reference Paynter1961; Rosenberg & Karnopp, Reference Rosenberg and Karnopp1983; Karnopp et al., Reference Karnopp, Margolis and Rosenberg2000). Bond graph modeling maintains power conservation and explicitly shows interactions among a succinct set of elements, which allows for graphical analysis and readily leads to computer-based manipulation.
Exploring multiple design choices for passive mechatronic systems combining bond graphs and genetic programming has been initiated and explored for design of analog filters, printers, microelectromechanical systems (MEMS), and so forth (Goodman et al., Reference Goodman, Seo, Rosenberg, Fan, Hu and Zhang2002; Fan, Reference Fan2004). Because in many cases mechatronic systems also incorporate active control elements, bond graph modeling has been broadened to represent controller schemes as well, thus unifying active control systems and passive physical systems for whole system design (Wang & Terpenny, Reference Wang and Terpenny2003; Wang et al., Reference Wang, Fan, Terpenny and Goodman2005). Built upon the previous work and inspired by symbiosis phenomena from nature, a useful extension to the more traditional evolutionary algorithms, coevolution, is applied to this work. This approach cooperatively evolves coadapted mechatronic subsystems in parallel, and generates alternative design concepts that are comparable or even superior to those generated using conventional methods, with more flexibility and better performance.
The remaining sections are arranged as follows. Section 2 gives the background of this work: mechatronics design is treated as a network synthesis problem with bond graph mapping. Section 3 provides the foundation for unified physical systems modeling and control using bond graphs. Section 4 explains how computational synthesis of mechatronic systems is achieved by combining bond graphs and genetic programming. Section 5 illustrates the coevolutionary synthesis framework for integrated mechatronics design. A quarter-car suspension design case study is given in Section 6. Conclusions are provided in Section 7, highlighting the value and future plans for the proposed approach.
2. MECHATRONICS NETWORK SYNTHESIS WITH BOND GRAPHS
The proposed approach employs bond graphs as the basis for mechatronics system design. Bond graphs are represented as interconnected components with power flow across their interfaces (ports). The ports are specified in terms of effort and flow variables in various domains, governed by energy conservation laws (Karnopp et al., Reference Karnopp, Margolis and Rosenberg2000). Design synthesis in this approach is to generate bond graph structures from impedance specifications, and then to associate the bond graphs with physical artifacts. For linear, time-invariant continuous systems, the impedance Z can be defined as the ratio of the Laplace transform of the effort variable to the Laplace transform of the flow variable. Conversely, admittance is defined as the ratio of the Laplace transform of the flow variable to the Laplace transform of the effort variable.
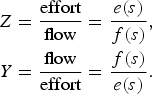
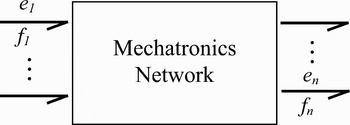
Extending the wealth of literature and experience in network synthesis for electrical circuits, and drawing on analogy between electrical networks and mechanical networks (Harman & Lytle, Reference Harman and Lytle1962), mechatronic systems with power interaction can be modeled as general multiport networks, represented as a black box, with n pairs of effort and flow variables (e i, f i), i = 1, … , n, as shown in Figure 1.
A mechatronics n-port network.

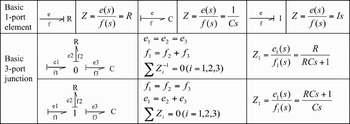
Each port represents an interface with other subsystems. When two ports of two subsystems are connected, power can flow through the connected ports from one subsystem to another subsystem, which are represented by a single bond between the two subsystems. The power bonds are represented with half-arrows following the notation of bond graphs, to indicate the direction of power flow when the elements associated with the power bonds have positive values. The basic bond graph elements are dissipative (R), capacitive (C), and inertia (I). Figure 2 summarizes the basic one-port element and three-port junction bond graph structures represented as impedances. The vertical bar associated with each power bond indicates causality, that is, the signal direction of the effort variable.
Impedances of bond graph structures.

For a two-port network, its impedance, admittance, and immittance matrix are defined as the following:
impedance matrix:
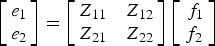
admittance matrix:
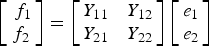
immittance matrix:
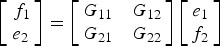
3. UNIFIED PHYSICAL SYSTEMS MODELING AND CONTROL
Although bond graphs were developed mainly to study energy interaction of passive physical systems, they are seldom applied to the synthesis of control systems because of the richness and completeness of well-established control system design methodologies in pure mathematical settings. However, it is argued that the mathematical control methods distill out system-specific features and physical insight that could have aided in the design procedure using engineering intuition (Yeh, Reference Yeh2002). The postulate of “physical equivalence” states that for every controlled system there exists a pure physical system with no controller whose dynamical interaction behavior is identical; thus, it is possible to describe a controlled system as an equivalent pure physical system. In other words, all a controller can do is to alter the behavior of one physical system such that it emulates the behavior of another physical system, provided that ideal actuators and sensors can be placed at any point in the original physical system (Hogan, Reference Hogan1985). Accordingly, controller design based on physical models is proposed, where engineering insight from the physical domain is brought to bear directly onto the control design problem (Sharon et al., Reference Sharon, Hogan and Hardt1991; Gawthrop, Reference Gawthrop1995).
According to the definition of network passivity (Newcomb, Reference Newcomb1966), a passive system only dissipates or stores energy, whereas an active system relies on the use of an external power source, together with sensors, controllers, and actuators within a physical structure, to provide energy to the system. Based on whether the actuator and the sensor are located at the same place, control methods can be classified as collocated control and noncollocated control.
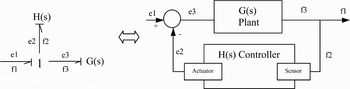
Collocation means to physically locate the sensors and the actuator in the same position such that the effort and flow variables are energetically conjugated. Noncollocated control means to locate the sensor and the actuator in different positions, so that there is a structural resonance between the sensor and the actuator. Collocated control is of particular interest when using bond graphs, because it can be represented as an effort-flow one-port element, including all sensor, controller, and actuator effects, in the bond graph paradigm. The active effort source is generated by the corresponding flow signal measurement through controller modulation, and vice versa. One simple example of collocated control can be illustrated in Figure 3. One the left-hand side, the bond graph represents a closed-loop feedback control system with plant, sensor, controller, and actuator, and its block diagram representation is shown on the right-hand side. It is recognized that bond graphs are condensed block diagrams, because there is a close correspondence between bond graphs and their equivalent block diagrams (Karnopp et al., Reference Karnopp, Margolis and Rosenberg2000).
Controller as impedance in bond graphs and block diagrams.

In the physical domain, all one-port elements, such as dampers and springs, are positive real, thus passive. Collocated controls with positive-real elements are intrinsically passive. They provide negative feedback, and hence, lead to better stability than use of noncollocated control, with respect to uncertainty (Preumont, Reference Preumont2002). A collocated control structure with positive-real elements may be implemented either passively or actively. This allows for an active implementation of a passive control law. Collocated controls with negative-real elements are positive feedback control methods. They can only be implemented actively because there is no physical correspondent of negative one-port elements.
Noncollocated control can also be represented as a one-port element in bond graphs, whereas the effort and flow variables associated with one power bond are actually separated to appear at two different physical locations for measurement and actuation.
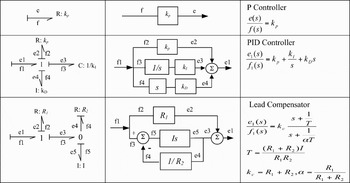
To design either a collocated or noncollocated control in the physical domain, the controller can be represented by various combinations of bond graph C, I, and R elements, to represent various control schemes, such as P, PI, PD, and PID controllers or lead and lag compensators. This approach facilitates separation of controller representation issues from implementation issues, thus providing guidance at the high-level design stage in selecting the proper overall system architecture for a given design task. Figure 4 shows part of the controller schemes in bond graphs generating controlled effort from flow input, together with their corresponding block diagrams and transfer functions. The various controller schemes are typical modular structures consisting of basic bond graph elements.
Controller schemes in bond graphs and black diagrams.

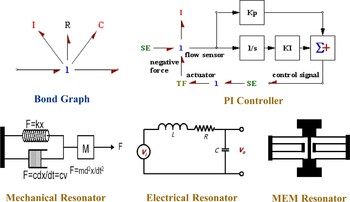
Figure 5 demonstrates the use of bond graphs as a unified mechatronics modeling tool. The apparently different systems in different domains, when represented in bond graphs, are the same (Broenink, Reference Broenink1999). The bond graph diagram shows a one-junction joining I, R, and C elements. It is a second-order system functioning as a resonator. This resonator can be mapped to a mechanical realization using a spring, a damper, and a mass; or to an electrical realization using a capacitor, a resistor, and an inductor. It can also be mapped into a MEMS realization using microstructures fabricated with C, I, and R properties.
Resonator in bond graph and various domain realizations. [A color version of this figure can be viewed online at journals.cambridge.org/aie]

Of the most importance to this work, bond graphs have also been broadened to represent controllers. For collocated control with sensors and actuators located at the same place, if velocity signal is measured, negative velocity feedback is equivalent to a damping R action; negative position feedback is equivalent to a spring C action. The PI controller, which consists of one R and one C element, is realized by measuring the velocity signal and generating a force proportional to both the position and the velocity of the mass I. The force input is realized through an actuator that provides modulated power to the system. Because the power flow direction of the actuating bond is reversed, the modulated force becomes negative, thus forming a negative feedback loop.
Our work takes a further step in advancing the physical domain design methodology by designing the passive physical structures and the active controller strategies of a mechatronic system concurrently and computationally. By using bond graphs as unified representation across domains, it is expected to achieve codesign of physical systems and controllers without a priori partitioning of the system into different domains. This gives designers flexibility to investigate different possibilities for designing subsystems in different domains to verify the entire system optimality.
4. BOND GRAPHS AND GENETIC PROGRAMMING
In this work, computational synthesis of mechatronic systems using bond graphs benefits from their simple and unified representation across multiple energy domains. The graphical and topological characteristics of bond graphs allow their generation by flexible combination of bonds and elements, to form high-level functionality and complexity from lower level building blocks.
Genetic programming, an extension of genetic algorithms (Holland, Reference Holland1975), is well recognized as a powerful tool for topologically open-ended search. A frequent objective of using genetic programming is to achieve human-competitive machine intelligence with little human effort involved (Koza, Reference Koza1992). By initializing a random population of tree-structured computer programs, then using the genetic operations of reproduction, crossover, and mutation, genetic programming can be used to grow trees that can specify increasingly complex models. More information about genetic programming can be found at the genetic programming official Website (2008).
Bond graphs can be encoded in a genetic programming tree representation to explore various mechatronic design configurations and parameterizations. Detailed explanation of the general bond graph/genetic programming (BG/GP) encoding and decoding principle can be found in Goodman et al. (Reference Goodman, Seo, Rosenberg, Fan, Hu and Zhang2002), Wang and Terpenny (Reference Wang and Terpenny2003), and Fan (Reference Fan2004).
The basic bond graph elements are {C, I, R, TF, GY, 0, 1, Se, Sf}. It is often convenient and necessary to initiate a program by specifying an embryo and test fixtures that are appropriate for the problem. The embryo is an invariant part of a model that contains the interface or boundary information associated with the problem to be solved, such as the drive and the load, or the fixed physical plant. Elements that must be included in the embryo include those defining the system interface at which the desired objectives are measured; performance of a design could not be measured in their absence. In this work, the use of input sources Se and Sf is limited to only the initial embryo structure. In addition, at the conceptual design stage, because transformers and gyrators can be simplified and eliminated from the bond graphs, TF and GY elements are also not included among the genetic programming primitives.
The program trees evolved by genetic programming may be employed in many different ways (Koza et al., Reference Koza, Keane, Yu, Bennett and Mydlowec2000). In the first approach, genetic programming is used to automatically create a computer program to solve a problem. The program tree is simply executed, for example, to generate an algebraic function to approximate a certain input–output pattern using standard arithmetic operators and operands. A second approach is a developmental approach, in which the program tree is interpreted as a set of instructions for constructing a complex structure from a very simple embryonic structure. This approach has been used to generate electrical circuits, including several previously patented circuits and human–competitive results (Koza, Reference Koza1999). This approach has also been used to evolve analog circuits, a printer, and MEMS structures using bond graphs (Goodman et al., Reference Goodman, Seo, Rosenberg, Fan, Hu and Zhang2002; Fan, Reference Fan2004). A third approach is to let program trees represent modular building blocks, linked by direct lines representing the flow of information. This approach has been used to evolve robust controllers for a given plant (Koza et al., Reference Koza, Keane, Yu, Bennett and Mydlowec2000).
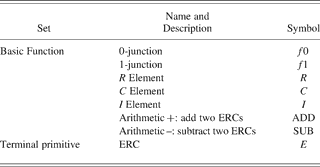
In the context of this work, we chose to apply the first approach. Bond graphs are treated as binary tree-based structures with elements interconnected through junctions. The result of executing the program tree is the impedance function of an effort–flow pair in a bond graph joined by zero and/or one junctions that can be used directly for impedance calculation. One-junction, zero-junction, R, C, and I elements are mapped to operators relating to bond graph elements. Arithmetic addition and subtraction are mapped to arithmetic operators to manipulate ephemeral random constants (ERCs; Koza, Reference Koza1992). ERCs are mapped to operands with their numerical values interpreted in a logarithmic scale to represent numbers ranging over 10 orders of magnitude (Koza, Reference Koza1999). Because of the introduction of negative one-port elements, the ERC can be set to both positive and negative values. The impedance calculation process is similar to arithmetic operations. Table 1 defines the function and terminal primitive set of genetic programming to construct bond graphs in this work.
Genetic programming function and terminal primitive set
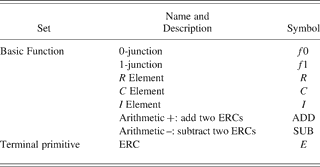
ERC, ephemeral random constant.
Once the evolutionary computation converges or terminates, the resulting genetic programming tree structures will be simplified to reduce redundant branches and nodes for further analysis and verification.
5. COOPERATIVE COEVOLUTIONARY SYNTHESIS
To successfully apply the BG/GP approach to solve increasingly complex mechatronic design problems, an explicit notion of modularity is introduced to provide reasonable opportunities for solutions to evolve in the form of coadapted subsystems. Cooperative coevolution is a natural symbiosis phenomenon that has aroused a growing interest in its application to solve various problems with interacting modules. It is argued that in nature the body and brain of a creature are tightly coupled and survive together (Pollack et al., Reference Pollack, Lipson, Funes and Hornby2001). Initial research on evolving artificial life forms with both body and brain for a particular task has proved to be successful. Robot morphology and a controller have been encoded directly (Lipson & Pollack, Reference Lipson and Pollack2000), using a generative graph structure (Hornby & Pollack, Reference Hornby and Pollack2001), or with a hybrid structure consisting of genetic programming for evolving the controller and genetic algorithms for evolving the body parameters (Lund, Reference Lund, Hara and Pfelifer2003).
Although many of the above-mentioned coevolutionary robotics approaches use neural network controllers, in this work, the body and brain coevolutionary synthesis of mechatronic systems uses unified bond graph trunk modules encoded in genetic programming across all subsystems. The whole system needing to be designed is first decomposed based on engineering judgment into coadapted subsystems in the analysis phase, and then all subsystems are coevolved cooperatively in the synthesis phase. The decomposition is not for dividing the system into separate engineering domains, only into subsystems. Using bond graphs to represent each subsystem, it benefits from exploring concurrent design of mechatronic subsystems without first dividing them into specific domains. For example, if an evolved subsystem can be implemented either passively or actively, a decision may be made at a later point of time such that it is part of the “body” design rather than part of the “brain” design.
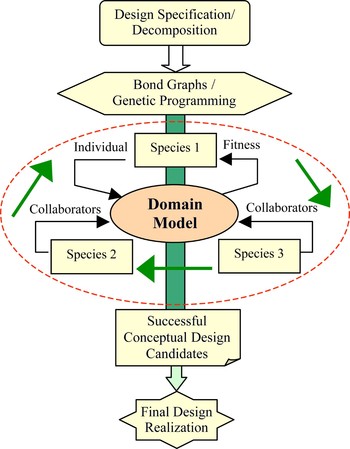
We use a generalized cooperative coevolution architecture for evolving ecosystems consisting of two or more interacting coadapted species (Potter & De Jong, Reference Potter and DeJong2000). The species are genetically isolated as in nature, that is, individuals from one species only mate with individuals from the same species. The species interact with one another within a shared domain model and have a cooperative relationship. Figure 6 shows the general architecture of the cooperative coevolutionary synthesis framework.
Cooperative coevolutionary synthesis framework. [A color version of this figure can be viewed online at journals.cambridge.org/aie]

Because any given individual from one species represents only a subcomponent of the problem, collaborators need to be selected from other species to assess fitness. Each generation, all individuals belonging to a particular species have their fitness evaluated by selecting some set of collaborators from other species to form a complete solution. There are several issues needing to be addressed for applying coevolutionary algorithms to evolve interdependent subcomponents (Wiegand et al., Reference Wiegand, Liles and DeJong2001):
1. The degree of greediness of choosing a collaborator (collaborator selection pressure): the last evaluated fitness scores of the individuals in the alternative subpopulations are used to bias how to choose collaborators. There are greedy, random, and worst methods to select the best, random, and the worst representative collaborators from the previous generation, respectively.
2. The number of collaborators per subpopulation to use for a given fitness evaluation (collaboration pool size): the number of collaborators can clearly affect the success of the coevolutionary algorithm. Increasing the number of collaborators can significantly increase overall computation time, a problem that is combinatorial with the number of subpopulations. Commonly in practice, one to five collaborators are selected for experimentation.
3. The method of assigning fitness values given multiple collaborations (collaboration credit assignment): the optimistic method assigns an individual fitness score based on the value of its best collaboration; the hedge method assigns an individual fitness score based on the average value of its collaboration; the pessimistic method assigns an individual fitness score based on its worst collaboration. All experiments in this work used the optimistic method for credit assignment.
In this work, the coevolutionary design synthesis started from the desired system specification. The fitness of a complete solution combining individuals from all the species is evaluated according to how accurately it approximates the desired overall system specification. We use Open Beagle as our evolutionary computation platform. It is a well-structured object-oriented framework including support for genetic algorithms, genetic programming, evolution strategies, and coevolution (Gagné & Parizeau, Reference Gagné and Parizeau2002).
6. CASE STUDY: QUARTER-CAR SUSPENSION
6.1. Problem description
Suspension systems are important subsystems of most wheeled vehicles. From a system design point of view, there are two main types of disturbances acting on a vehicle, namely, road and load disturbances. Road disturbances have the characteristics of large magnitudes at low frequency (such as hills) and small magnitudes at high frequency (such as road roughness). Load disturbances include the variations of loads induced by accelerating, braking, and cornering. A good suspension design is concerned with disturbance rejection from both these disturbances to the outputs (e.g., vertical position of vehicle mass). In general, a suspension system needs to be “soft” to follow the road smoothly for a comfortable ride as well as to insulate against high-frequency road disturbances, and to be “hard” to insulate against any load disturbances (Wang, Reference Wang2001).
Suspension systems have been widely applied to vehicles to isolate body vibration from road and load disturbances. They may include passive physical designs as well as active control designs. In the literature, the three common classifications of suspension systems are passive, active, and semiactive, depending on the amount of external power required for the suspension to perform its function (Chalasani, Reference Chalasani1986).
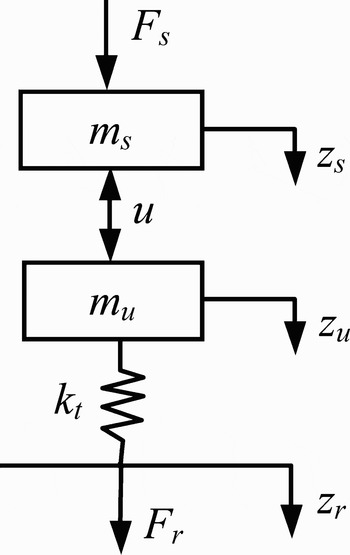
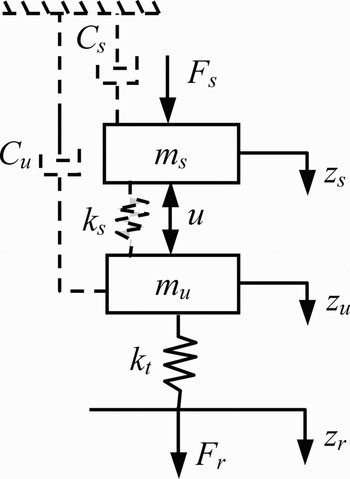
A quarter-car schematic model is illustrated in Figure 7. The sprung mass m s (kg), consists of the main vehicle body supported by the suspension. The unsprung mass m u (kg), consists of hub, wheel, and tire. The tire is modeled as a spring with stiffness k t (N/m). Vertical positions z s, z u, and z r are for the sprung mass, unsprung mass, and road disturbance input, respectively. Force F s is the load force disturbance input, u represents any possible suspension force, and F r represents the force between the road and the tire. This case study is adapted from Smith (Reference Smith1995).
Quarter-car schematic model.

The following equations describe the system motion:


where F r = k t(z r − z u).
From the point of view of a multiport mechatronics network, the quarter-car suspension system can be viewed externally as a two-port network. Its corresponding mixed immittance matrix specification G is defined as
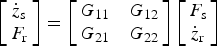
When both road and load disturbance rejection are considered, it requires that in Eq. (3), G 12(s) and G 22(s) be set “soft” for road disturbance rejection, whereas G 11(s) and G 21(s) be set “hard” for load disturbance rejection. To achieve such behavior, the desired system performance is specified in the immittance matrix for a combination of soft and hard suspensions as follows:
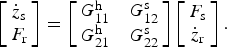
In this work, the desired system is specified as an ideal “double skyhook” configuration as shown in Figure 8, which has been frequently used for target suspension force (Karnopp, Reference Karnopp1995). It is depicted as the additional dashed system, consisting of a spring k s between the sprung mass and the unsprung mass, a virtual sky-hook damper c s for the sprung mass, and a virtual sky-hook damper c u for the unsprung mass. The ideal suspension force u = k s(z s − z u) + c sżs − c użu.
Quarter car with double skyhook suspension configuration.

The experimentation below uses the following parameters for the quarter-car model (Smith, Reference Smith1995): m s = 250 kg, m u = 35 kg, k t = 150 × 103 N/m. The desired frequency response for road disturbance is specified in G 12s(s) using a double skyhook configuration with a soft damper and spring parameterization: k ss = 10,000 N/m, c ss = 4000 Ns/m, c us = 2000 Ns/m. The desired load disturbance frequency response is specified in G 11h(s) using another double skyhook configuration with a hard damper and spring parameterization: k sh = 150,000 N/m, c sh = 12,000 Ns/m, c uh = 6000 Ns/m.
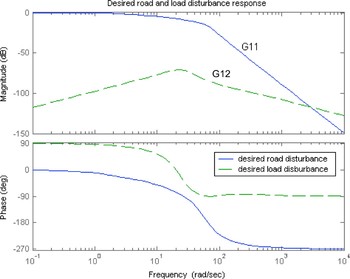
The desired G 11h(s) and G 12s(s) can be calculated as follows:
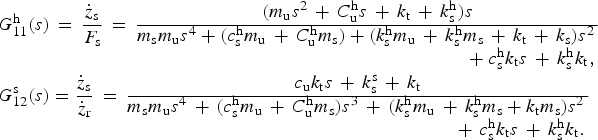
Their Bode plots are shown in Figure 9.
Desired road and load disturbance response. [A color version of this figure can be viewed online at journals.cambridge.org/aie]

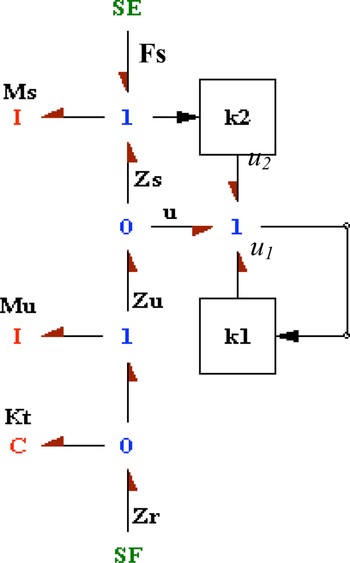
There is 1 degree of freedom available for the response to each of the road and load disturbances. They can be determined independently if two suitable measurements are available for feedback, for example, suspension deflection and sprung mass velocity (Smith, Reference Smith1995). The suspension design with two such measurements, as depicted in a bond graph, is shown in Figure 10.
Quarter-car suspension control with both road and load disturbances. [A color version of this figure can be viewed online at journals.cambridge.org/aie]

The control law is taken to be

where k 1(s) is a collocated controller with relative velocity feedback, k 2(s) is a noncollocated controller with absolute velocity feedback. With k 1(s) and k 2(s), the actual road and load disturbance response can be calculated as
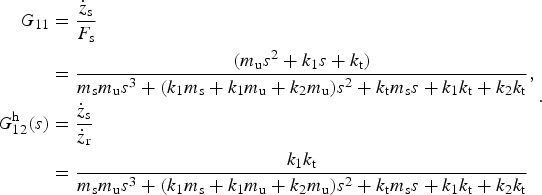
Because of conflicting specifications for road and load disturbance performance requirements, the performance cannot be achieved by a passive suspension alone. Extra energy must be introduced using active suspension (Smith & Walker, Reference Smith and Walker2000). From the system point of view, it is desirable to explore both controller strategies concurrently for possible passive and active realization of the suspension system to achieve overall optimal system performance and energy efficiency.
6.2. Controller coevolution
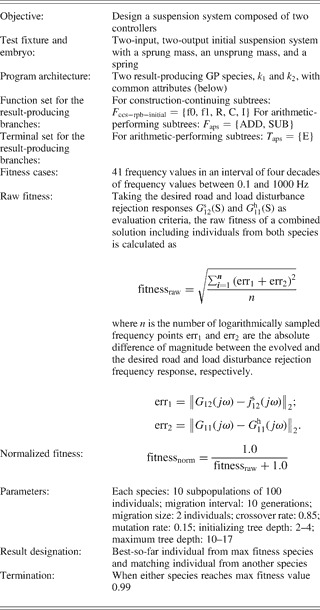
Controller k 1(s) and k 2(s) are both represented in bond graphs encoded in genetic programming. They belong to two coevolved individual GP species cooperating with each other to form a complete solution for the quarter-car suspension design. Table 2 summarizes the key features of the problem of coevolving two suspension controllers. Detailed explanation of the BG/GP encoding and decoding procedures can be found in Goodman et al. (Reference Goodman, Seo, Rosenberg, Fan, Hu and Zhang2002), Wang and Terpenny (Reference Wang and Terpenny2003), and Fan (Reference Fan2004).
Suspension controllers

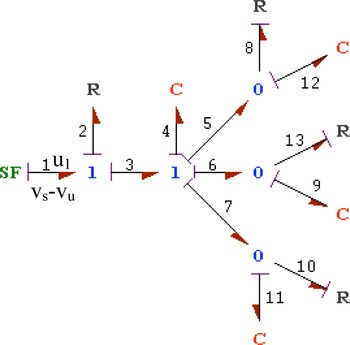
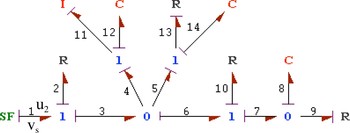
One of the best solutions discovered by coevolutionary genetic programming using the basic functions from Table 1 produced the following results as shown in Figure 11 for k 1(s), and Figure 12 for k 2(s). These bond graph structures are manually simplified based on the genotypes shown below.
Coevolved controller structure in bond graph for k 1(s). [A color version of this figure can be viewed online at journals.cambridge.org/aie]

Coevolved controller structure in bond graph form for k 2(s). [A color version of this figure can be viewed online at journals.cambridge.org/aie]

As shown in Figure 10, k 1(s) measures velocity difference between the sprung mass and the unsprung mass, and provides u 1, part of force u between the two masses. Note that R8, C12, R13, C9, R10, and C11 have negative values and thus need to be implemented actively.
The genotype for controller k 1(s) is

A one-port bond graph structure can be represented in impedance form and transformed to a transfer function (Redfield & Krishnan, Reference Redfield and Krishnan1993).

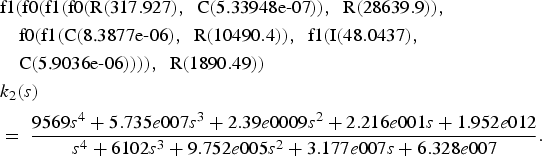
The input to controller k 2(s) is the sprung mass velocity; the output of controller k 2(s) is u 2, which provides another part of force u acting between the sprung mass and the unsprung mass.
The genotype for controller k 2(s) is
Here, k 1(s) and k 2(s) can also be calculated algebraically using conventional control methods, to match the desired load and road disturbance responses, with the following results (Smith, Reference Smith1995):
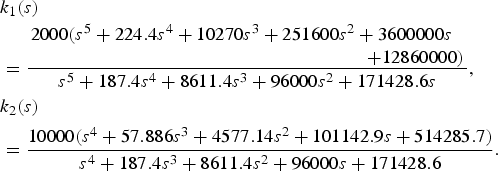
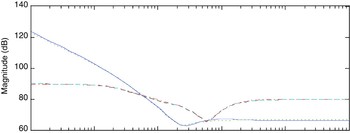
Comparison of the two results shows that controller k 1(s) is of lower order and less complexity than the controllers obtained from algebraic calculation. This demonstrates that by applying genetic programming to coevolve controller structures encoded in bond graphs, it is possible to discover equal or better control strategies in comparison to those obtained through conventional methods. The Bode plots of the coevolved controllers are compared with those of the calculated controllers, as shown in Figure 13. They have almost the same frequency responses. However, controllers represented only in transfer functions give no physical insight as whether certain parts of the controller may be implemented passively.
Evolved k 1 and k 2 compared to calculated k 1 and k 2. [A color version of this figure can be viewed online at journals.cambridge.org/aie]

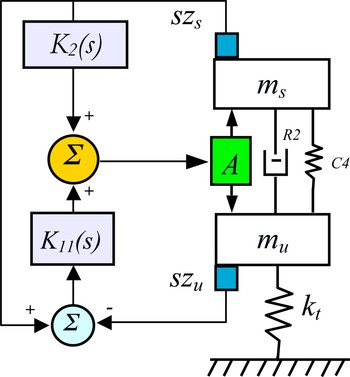
In this approach, the controllers are evolved in the physical domain with bond graph representation. The resulting bond graph structures give designers insight in choosing among different physical realizations using active or passive subsystems. Analyzing the collocated controller k 1(s), R2 and C4, joined by a one-junction, are positive real, and thus can be implemented passively as a spring-damper parallel pair, while R8, C12, R13, C9, R10, and C11 are negative real and need to be implemented actively. This is shown in Figure 14, with the following parameters: R2 = 2104.298 Ns/m, C4 = 137116.9 N/m,

Physical realization of suspension control with road and load disturbances. [A color version of this figure can be viewed online at journals.cambridge.org/aie]

6.3. Incorporating physical system consideration
The advantage of using bond graphs for mechatronic system design is that they can explore the whole system configuration with both passive and active systems simultaneously for concurrent synthesis. In the experiments of the last section, there are no initial constraints as to whether the coevolved controllers are to be implemented actively or passively. Coevolutionary computation is used to discover useful controller structures, including possibly emergent passive physical structures between the sprung mass and the unsprung mass. Emergent passive physical structures are beneficial in terms of energy efficiency in comparison to a fully active suspension system. Instead of relying on generating passive physical structures emergently, constraints can be explicitly incorporated into the coevolution requiring that certain parts of the suspension system be passive, and that the physical structures have no inertia component. This approach adds pressure to discover physically meaningful structures for a semiactive suspension design.
When taking explicit physical systems into consideration, our coevolution of controllers involves three species. The collocated controller k 1 in the last section is split into two parts joined by a one-junction: passive k 1p and active k 1a. Species k 1p is part of the suspension that is physically realizable, k 1a corresponds to active controller k 11 in Section 5.2, and k 2 is the same as in Section 5.2. They are all represented as bond graphs.
Using the same parameter settings as before, coevolutionary computation on this problem generated the following three best structures after simplification, having the same active control configuration as shown in Figure 14.
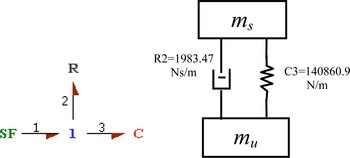
1. Design alternative 1: The bond graph of the physical system and its mechanical implementation are illustrated in Figure 15.
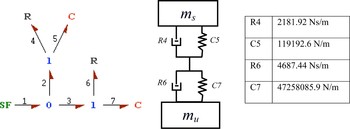
2. Design alternative 2: The bond graph of the physical system and its mechanical implementation are shown in Figure 16.
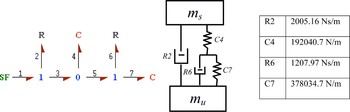
3. Design alternative 3: The bond graph of the physical system and its mechanical implementation are shown in Figure 17.
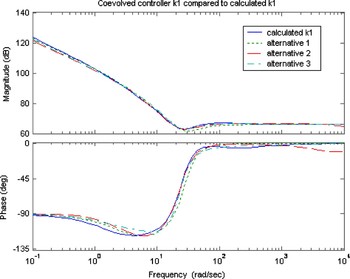
The three alternative coevolutionary results shown above yield different configurations of the passive part of the suspension system. The one shown in Figure 15 has the simplest physical structure and is also close to the passive physical systems obtained in Section 5.2. Taking k 1 = k 1p + k 1a, the Bode plots of the coevolved controller k 1 compared to the calculated controller k 1 are shown in Figure 18. They also have similar frequency responses.
Suspension passive physical structure design alternative 1. [A color version of this figure can be viewed online at journals.cambridge.org/aie]

Suspension passive physical structure design alternative 2. [A color version of this figure can be viewed online at journals.cambridge.org/aie]

Suspension passive physical structure design alternative 3. [A color version of this figure can be viewed online at journals.cambridge.org/aie]

Coevolved controller k 1 compared to calculated k 1. [A color version of this figure can be viewed online at journals.cambridge.org/aie]

In summary, a passive suspension system has the ability to store energy via a spring and to dissipate it via a damper. Its parameters are generally fixed, being chosen to achieve a certain level of compromise between road following and load carrying. An active suspension system has the ability to store, dissipate, and introduce energy to the system, with extra flexibility to achieve improved design performance. In this work, by designing controllers in the physical domain, it enables coevolving both passive physical structures and active controllers simultaneously. It should be noted that in this work, we have assumed that the sensor and the actuator have perfect dynamics. The suspension design will be considerably modified if such assumptions do not hold well.
6.4. Coevolutionary experimental analysis
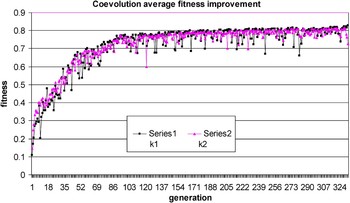
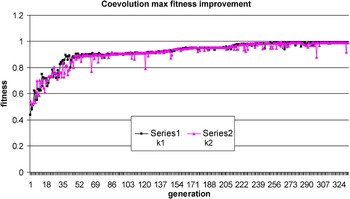
In the experimentation from Section 5.2, there are two species: controller k 1 and k 2. For each species, two representative collaborators are chosen to pair with individuals in the other species for their fitness evaluation. The two representative collaborators are the best individual and one random individual from the previous generation. The termination criterion for this coevolutionary process is when either of the species reaches its maximum fitness value (0.99). Because the two species are quite interrelated, the fitness improvement for each species shows many dynamics with sharp-edged curves. This is typically different from single-species evolution, which normally has smoother fitness improvement curves. The coevolution average and max fitness improvement curves are shown in Figures 19 and 20, respectively, for a typical run.
Suspension controller k 1 and k 2 coevolution average fitness improvement. [A color version of this figure can be viewed online at journals.cambridge.org/aie]

Suspension controller k 1 and k 2 coevolution maximum fitness improvement. [A color version of this figure can be viewed online at journals.cambridge.org/aie]

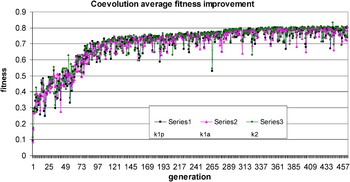
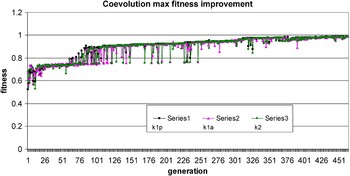
In the experimentation from Section 5.3, there are three species: passive physical system k 1p, collocated active con-troller k 1a, and noncollocated controller k 2. The experimental configurationsetting is similar to the coevolution with two species. The average and max fitness improvement curves for one typical coevolutionary run with three species are shown in Figures 21 and 22, respectively, for a typical run.
Suspension k 1p, k 1a, and k 2 coevolution average fitness improvement. [A color version of this figure can be viewed online at journals.cambridge.org/aie]

Suspension k 1p, k 1a, and k 2 coevolution maximum fitness improvement. [A color version of this figure can be viewed online at journals.cambridge.org/aie]

7. CONCLUSIONS
This paper describes an integrated system-oriented coevolutionary synthesis approach for open-ended mechatronics design using bond graphs. The combination of bond graphs and genetic programming provides a mechanism for bridging the field of mechatronics design with computational intelligence. This work takes a further step upon previous work by designing truly mechatronic systems including active control systems. It integrates control system design with multidomain physical system design, and achieves synergy for whole system design through concurrent computational synthesis of mechatronic subsystems. The design philosophy and formal design methodology have been demonstrated in the quarter-car suspension case study. The emergent passive physical structures are more energy efficient than a fully active suspension system.
Although this is not the first approach to body–brain coevolution, it is the first to use the same bond graph representation to coevolve mechatronic subsystems that can consist of both passive and active components. Using the same design representation, we have the flexibility of choosing different ways of physically implementing the system. The integrated coevolutionary synthesis procedure can assist the designers in reviewing a wider range of potential innovative and overall optimal design options, and having more flexibility and insight to determine a final solution.
There is a great deal of work that needs to be done to further advance this approach. Mechatronics design integrates various disciplines and tools. At the conceptual design stage with bond graph modeling, it only considers energy flows and signal flows. However, at the detailed design level, the design process should be accomplished in the context of global optimization with multidisciplinary constraints and multiple objectives, for more realistic implementation and economic trade-off analysis.
For simplicity, this paper focuses only on linear systems. However, the overall integrated design philosophy using bond graphs can readily accommodate nonlinear systems. The bond graph methodology easily allows one to model components that have nonlinear constitutive laws. Mechatronic system design with nonlinear characteristics will be investigated in future work.
Evolutionary algorithms are powerful general-purpose search methods. However, the practicality of evolutionary computation strongly depends on available computational resources. The case study in this work is of manageable complexity. For more complex problems with larger search spaces, massively parallel or distributed computing resources are needed to address the complexity, for example, the use of a Beowulf cluster. The EC framework adopted in this work now has a distributed Beagle version, which uses the master–slave model to distribute data over the network (Gagné et al., Reference Gagné, Parizeau and Dubreuil2003). Parallel and distributed evolutionary computation is of great interest for future work to design engineering systems with increasing complexity.
Furthermore, to be successful, open-ended design processes depend on their ability to scale to high complexities. Related issues include hierarchy, functional modularity, and structural regularity (Lipson et al., Reference Lipson, Antonsson and Koza2003). Although knowledge incorporation and extraction related to this work have been investigated to some extent (Wang et al., Reference Wang, Fan, Terpenny and Goodman2005), these issues need to be given more examination in future work.
ACKNOWLEDGMENTS
The authors sincerely thank Christian Gagné from Université Laval, Québec, Canada, the author of the Open Beagle Evolutionary Computation Platform, for his valuable collaboration and support in this work. This work was partially funded by NSF DMII-0115211 and NSF IIS-0325279. Any opinions, findings, and conclusions or recommendations presented in this paper are those of the authors and do not necessarily reflect the views of the National Science Foundation.
Jiachuan Wang is a Senior Systems Engineer at the United Technologies Research Center, East Hartford, CT. She received a PhD in industrial engineering and operations research from the University of Massachusetts Amherst in 2004. Her work has been focused on evolutionary computation and applications to mechatronics conceptual design synthesis. Dr. Wang's current research interests include product family optimization, robust design, and Lean Six Sigma.
Zhun Fan is an Associate Professor in management engineering at the Technical University of Denmark. From 2004 to 2007 he was an Assistant Professor in mechanical engineering at the Technical University of Denmark. He received his PhD in electrical computer engineering from Michigan State University in 2004. In addition to a PhD project on the design automation of mechatronic systems, Dr. Fan is currently leading several other PhD projects related to hospital mobile robots, vision-based welding, and so forth.
Janis Terpenny is an Associate Professor in engineering education and an Affiliate Faculty of industrial and systems engineering at Virginia Tech. She is Director of the Center for e-Design, an NSF center involving five universities. Her research focuses on methods and representation schemes for early design processes and on engineering design education. She was previously an Assistant Professor at the University of Massachusetts and worked at General Electric, where she completed a 2-year management program. Dr. Terpenny is a member of ASEE, ASME, IIE, and Alpha Pi Mu and is the Design Economics Area Editor for Engineering Economist.
Erik D. Goodman is Cofounder and Vice President for Technology at Red Cedar Technology, Inc. He is a Professor of electrical and computer engineering and mechanical engineering at Michigan State University and performs research on evolutionary design of structural and dynamic systems. For 20 years he directed the Case Center for Computer-Aided Engineering and Manufacturing and currently codirects the Genetic Algorithms Research and Applications Group (GARAGe). Dr. Goodman was the Founding Chair of ACM SIEVO, the Special Interest Group on Genetic and Evolutionary Computation, and was elected a Senior Fellow of the International Society for Genetic and Evolutionary Computation.