I. INTRODUCTION
Conducting hybrid nanocomposites with organic and inorganic phase is a special class of materials which have sparked enormous interest in the last two decades as these materials exhibit unique and extraordinary properties which can be applied in diverse areas. Specially their high conductivity and low weight ratio have triggered much interest to explore different types of conducting nanocomposites by incorporating various types of oxides into the host-conducting polymer. By doing so, the usual properties of the host can be tailored to obtain a desired hybrid material with superior performance. Reference Snook, Kao and Best1–Reference Navarro, Weitz, Bittner, Scolari, Mews, Burghard and Kern3
The substituted group at the ortho position in aniline ring takes part in resonance as a result, the electron-rich radical causes more electron density. The density of electrons influences the polarons and bipolarons to hopp along the direction of applied field. Hence, the conductivity of the ortho-substituted polyaniline has high conductivity than polyaniline. In recent years, these substituted polyaniline composites have attracted a special interest academically and industrially because of their good chemical stability, corrosion resistance, relatively light weight, simple acid/base doping/dedoping chemistry, and also it is inexpensive to prepare the nanocomposites. It exhibits dramatic changes in its physical properties depending on the method of synthesis and state of protonation. The applications of ortho-chloropolyaniline nanocomposites have been expanded over different fields by combining it with different nanomaterials which result in excellent properties of the nanocomposite materials. Most often, it is been used with carbonaceous materials in many applications, such as electrodes of super capacitors, Reference Hirata, Gotou and Ohba4 sensors, Reference Szabo, Szeri and Dekany5 nanoelectronics, etc.
Graphite oxide (GO) being a derivative of graphite is also considered supreme because of its material properties. GO is basically an insulator but at high temperatures it is a semiconductor with conductivity between 1 and 5 × 10⁻³ S/cm. Reference Cai and Song6 GO exhibits large surface to volume ratio, which makes it chemically stable and the possession of functionalities coming from carbonyl, hydroxyl, and epoxy groups provide sufficient defects resulting in excellent nanocomposite performance with a number of polymeric materials. It is also hydrophilic because of the oxygen functionalities of the graphene oxide layers within GO which allows it to disperse in water. Reference Lakshmi, Roy, Khasim, Faisal, Sajjan and Revanasiddappa7–Reference Singha, Thomas and Kulkarni9 GO is compatible with OPANI matrix to form composite because of the presence of many active edges and tunable oxygen functionalities on its basal planes which facilitates the surface modification. Reference Roy, Parveen, Deshpande, Bhat and Koppalkar10,Reference Wojkiewicz, Fauveaux and Miane11
In this study, we have focused on the preparation of OPANI/GO nanocomposites using a facile polymerization technique which aims at a better interaction between GO and OPANI leading to excellent properties including the enhanced conductivity which meets various applications. The electrical conductivity and dielectric properties of OPANI/GO composites were investigated in these composites. The morphology of the composites was analyzed using the FTIR spectra and scanning electron microscopy (SEM). This work is an attempt to understand the influence of GO on charge transport mechanism in OPANI.
II. EXPERIMENTAL SECTION
The monomer Ortho-chloroaniline, ammonium persulphate (APS), Hydrochloric acid (HCl), GO, and acetone were procured from Sigma–Aldrich, India. All chemicals were of analytical reagent grade and were used as received without any further purification in the present study.
III. SYNTHESIS OF ORTHO-CHLOROPOLYANILINE AND ITS COMPOSITES
During the process of synthesis, 1 M solution of ortho-chloroaniline and 1 M HCl were added in a volumetric glass flask immersed in an ice bath maintained at 0–5° C under constant stirring using a magnetic stirrer. The above solution was stirred continuously for about 20 min to obtain ortho-chloroaniline hydrochloride. An aqueous solution of 0.25 M APS was added slowly drop wise and stirring was continued for 3 h. The polymerization was allowed to proceed for the next 24 h by leaving the reaction mixture in an ice bath. The OPANI precipitate was collected in a filter paper and was washed with three 100 mL portions of 0.2 M HCl, and also with distilled water and acetone. Washing OPANI precipitate with 0.2 M HCl removes residual monomer and oxidant. Further washings were continued with distilled water till the filtrate becomes colorless and a final washing with acetone was carried out to remove low molecular weight oligomers and as a result of this it prevents the formation of agglomerates of OPANI precipitate during drying and the product obtained was in the form of a fine powder. The obtained powder was dried under vacuum at 60° C for 24 h. Reference Maeda, Sugimoto, Kagotani, Tezuka and Inomata12–Reference Roy, Gupta, Sindhu, Parveen and Ramamurthy14
In situ polymerization of OPANI/GO composites was carried out in a volumetric flask containing 1 M solution of Ortho-chloroaniline and 1 M HCl dissolved in distilled water in equimolar ratio. GO was added to the above solution and was kept for continuous stirring for 30 min to produce homogenous dispersion of GO in the solution of ortho-chloroaniline hydrochloride. 0.25 M APS was dissolved in distilled water to give 100 mL solution which was then added slowly to the above solution drop wise for about 20 min to initiate polymerization. Since the polymerization of ortho-chloroaniline is an exothermic process, the temperature of the reaction mixture has to be monitored during the progress of the reaction and should be maintained between 0–5° C. The reaction was continued for about 3 h with constant stirring and then was left in an ice bath for 24 h for complete polymerization of the monomers. Then the reaction mixture was filtered and washed with HCl, distilled water, and acetone. After filtration and washings, the obtained composite product was vacuum-dried at 60° C for 24 h. Likewise, all the composite samples with different loadings of GO being added in OPANI were synthesized. The load fraction of GO in OPANI was limited to 2, 4, 6, 8, and 10 weight percentage because the increase in load fraction hinders the dispersion of the dispersant in the polymer matrix since GO has the tendency to agglomerate and also enhances stacking due to van der Waals attraction and bonding interactions.
IV. CHARACTERIZATIONS
The Fourier transform infrared spectra for all the compositions along with pure OPANI were recorded on a Perkin Elmer 1600 spectrophotometer in KBr medium in the frequency range of 500–4000 cm−1. The surface morphology of the composites was imaged using Philips XL 30 ESEM. The frequency-dependent electrical conductivity of the composite powders at room temperature was measured by two probe technique using laboratory made setup on pressed pellets of composites. The dielectric behavior of the samples was studied by sandwiching the pellets of the composites between silver electrodes in the frequency range of 50 Hz to 5 MHz using the Hioki LCR Q meter.
V. RESULTS AND DISCUSSION
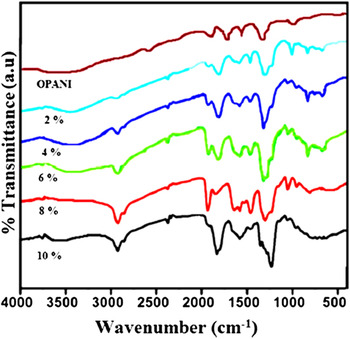
Figure 1 shows the FTIR spectra of pure OPANI and its composites in transmittance mode. In case of pure OPANI, the prominent peak at 1280 cm−1 corresponds to the chloro group attached to the phenyl ring indicating the formation of Ortho-chloropolyaniline through polymerization. During the formation of composite, the oxygen containing functional groups of GO facilitates the physical and chemical interaction between OPANI and GO. The structural changes occurring during the formation of OPANI/GO composites are been reflected in the FTIR spectra. No remarkable changes are observed in the characteristic peaks of OPANI/GO composites when compared with that of pure OPANI. The peaks observed in 2, 4, and 6 wt% composites at 750–930 cm−1 correspond to ortho-disubstituted aromatic rings. The band at ∼1170 cm−1 in all the composites reveals the presence of Ortho-chloropolyaniline. The C–H in-plane bending deformation occurs at ∼1166 cm−1 for the quinoid and ∼1172 cm−1 for the benzoid rings. Benzoid and quinoid vibrations are also detected as bands at ∼1500 and 1600 cm−1. The absorption band at ∼1240 cm−1 which is attributed to C–N stretching + ring deformation + C–H bending vibration mode is significant for OPANI/GO samples. It can be assigned to the C–N stretching vibration indicating secondary aromatic amine group in protonic acid doped Ortho-chloropolyaniline demonstrating the formation of C–N covalent bond between the polymer chain and the carboxyl groups onto the GO surface Reference Roy, Parveen, Ambika Prasad and Anilkumar15–Reference Parveen, koppalkar and Roy17 and the peaks at 2890 cm−1 that have been noticed in all the composites can be assigned for N–H stretching vibration. Thus, it can be concluded that there exists a substantial interaction between OPANI and GO and hence results in the formation of composites. Reference Roy, Parveen, Ambika Prasad and Anilkumar15–Reference Parveen, koppalkar and Roy17
FTIR spectra of OPANI and OPANI/GO composites.

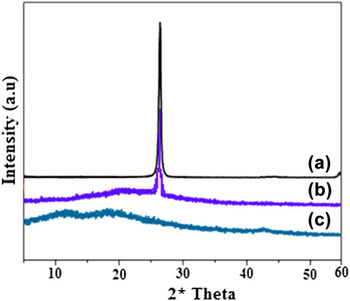
The x-ray diffraction pattern (XRD) patterns of GO, OPANI–GO composites, and pure OPANI are shown in Fig. 2. The natural graphite exhibits a higher intensity with the diffraction peak at 2θ = 26.3° [Fig. 2(a)], indicating that the spatial arrangement of the pure graphite microchip layer is very neat, and it is also correlated to an interlayer spacing of about 0.34 nm by the Prague formula calculation at the (002) diffraction peak. In the XRD pattern (JCPDS File No. 41-1487) of the GO, the (002) layer spacing of the diffraction peak intensity decreased relatively when dispersed in OPANI as shown in Fig. 2(b). The appearance of the GO diffraction peak in composites confirms the presence and modification of the diffraction pattern of OPANI/GO composite. The observed broad peak also indicates that the graphene sheets are loosely stacked, and it is different from the crystalline graphite. The pure OPANI sample exhibits a broad reflection peak at around 2θ = 23.6°, which is characteristic of the polymer as can be seen in Fig. 2(c).
XRD spectra of GO, PANI–GO composites, and OPANI.

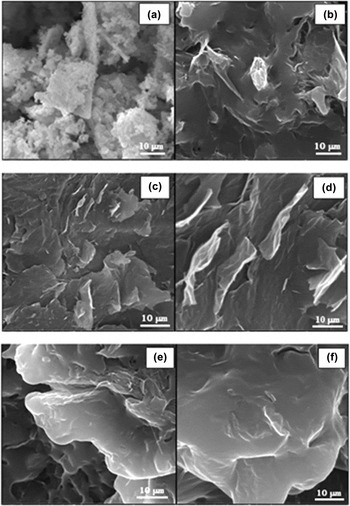
Figure 3(a) shows the SEM micrograph of pure OPANI. The morphology of pure OPANI seems to be agglomerated indicating that the grains are fused and represents a coalesced morphology.
SEM images of OPANI and OPANI/GO composites.

Figure 3(b) shows the SEM image of 2 wt% of OPANI/GO composite. Addition of GO into conducting polymer matrix by in situ polymerization mechanism affects the morphology of pure OPANI and leads to the formation of composites which is indicated by a well-defined and typical folding nature in the micrographs of the composites which is totally different from that of pure OPANI. No agglomeration of the particles was noticed, instead the composites changed their morphology which is crumpled, wrinkled, and also at times folded with no uniform distribution.
The surface morphology changed into flaky for 4 and 6 wt% composite as can be seen in Figs. 3(c) and 3(d).The average flake thickness is about few nanometers (nm) and the structures seem to be uniform, wherein GO particles are well incorporated and homogeneously distributed in the matrix which is highly favorable for polarizability due to the strong anisotropy of flake like OPANI/GO composites. Distribution is found to be nearly uniform without any segregation or the presence of large agglomerates. These micrographs indicate a multilayered composite structure formed by random stacking of GO platelets within the conducting polymer matrix representing a paper-like morphology and hence can be regarded as layered composites. For 8 and 10 wt% composites there was much deviation in the morphology from planarity to crumpled nature as shown in Figs. 3(e) and 3(f). From the above images, it can be assessed that due to the hydrophilic nature of GO, it can easily intercalate exhibiting osmotic type of swelling and hence it can be analyzed that the interlayer spaces within the host lattice are filled with such intercalated layers. During the formation of the composite, the flakes seem to be curled, scrolled, and folded within the composite due to constant stirring of the dispersion in the process of synthesis.
From the morphology of all the composites, it can be depicted that the 2D platelet-like GO sheets are stacked by several layers well within the OPANI matrix. These particles exhibit the property of buckling due to its hydrophilic nature and hence the morphology appears to be swelled and curled with increase in concentration of GO in OPANI indicating that GO platelets are well absorbed onto the surface of OPANI. Finally, it can be interpreted that the appearance of such layered structure results from uniform dispersion of GO in conducting polymer matrix and also due to a strong interaction between the oxygen functional groups.
VI. DIELECTRIC PROPERTIES
The complex dielectric constant as a function of frequency is in accordance with Jonscher's power law given by the relation ε* = ε′ − ε″. The dielectric constant response of a material is due to electronic, ionic, dipolar, and space charge polarizations. Out of these, the space charge contribution depends upon the purity and the perfection of the matrix. Its influence is in general noticeable only in the low frequency region. In the present study, the influence of space charge polarization mechanism is significant because of the defects been induced in the matrix by the addition of GO into OPANI. Reference Dhawan, Singh and Rodrigues18,Reference Parveen and Roy19 The dielectric behavior of all the composites along with OPANI was investigated in the frequency range of 102–106 Hz at room temperature.
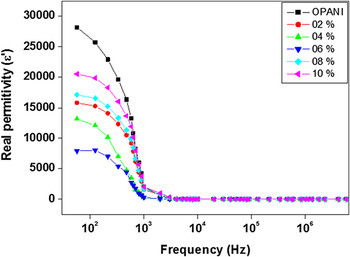
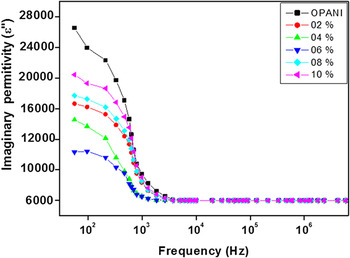
The variation of real (ε′) and imaginary (ε″) part of permittivity as a function of frequency for OPANI and OPANI/GO at room temperature is shown in Figs. 4 and 5. From these plots, it can be inferred that the value of ε′ is high for pure OPANI compared to the composite samples and among the composites, it has been noticed that the values of ε′ are low for the intermediate composite sample which is 6 wt% of GO in OPANI. Reference Faisal and Khasim20 It has been observed that the values of ε′ increases with the level of doping of GO in OPANI in the lower frequency side and gradually decreases with increase in frequency and almost remain independent of the frequency beyond 103 Hz. The graph of imaginary part of permittivity also exhibits a similar trend as that of real part of permittivity with frequency and becomes almost constant beyond 103 Hz. Both ε′ and ε″ exhibit strong dispersion toward low frequency side which is mainly due to accumulation of charge carriers at the interface between the sample and the electrodes resulting in space charge polarization along with non-negligible ionic conductivity. At high frequencies, the contribution of charge accumulation is minimal and hence the dielectric constant value remains relatively constant and also the charge carriers fail to respond to the external field and the low dielectric constant is due to lattice polarization. This accounts to linear decrease in the values at low frequency region and a frequency-independent plateau region at high frequencies. Reference Singjai, Wongjamras, Yu and Tunkasiri21,Reference Senthil, Badapanda, Kumar, Kumar and Panigrahi22
Variation of real part of permittivity (ε′) as a function of frequency.

Variation of imaginary part of permittivity (ε″) as a funcution of frequency.

The dielectric behavior of such composite materials can be used for various applications, such as in conductive paints, rechargeable batteries, sensors, MOS devices, and so forth.
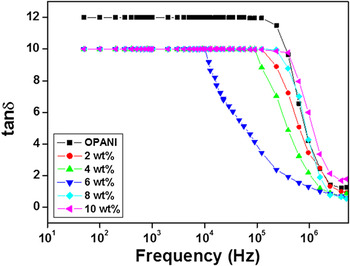
Figure 6 gives the variation of tan δ as a function of frequency for all the compositions as well as OPANI. It can be observed that the value of dielectric loss is high for OPANI and remains constant for all the composites up to the applied frequency of about 104 Hz. Thereafter, it gradually decreases for 6 wt% composite and further decrease in the values is also been noticed for the other composites as well. With the increase in frequency beyond 106 Hz the dielectric loss reduces completely for all the sample products.
Variation of tan δ as a function of frequency.

The electric modulus represents the real dielectric relaxation process which corresponds to the relaxation of the electric field in the material when the electric displacement remains constant. The electrical response of materials containing some degree of ionic conductivity can be investigated using the complex electric modulus relation M* = M′ + jM″, where M′ is the real part of the electric modulus, M″ is the imaginary part of electric modulus. This parameter is the reciprocal of permittivity and is widely used to analyze ionic conductivities. Reference Kumar, Naik, Roy, Harish and Viswanath23
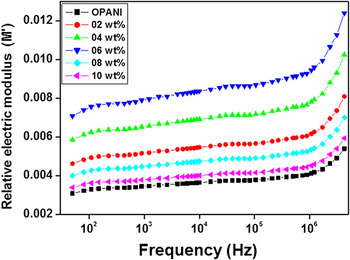
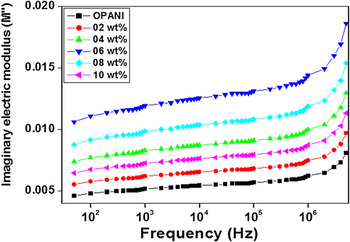
The variation of real and imaginary electric modulus as a function of frequency for various filler loadings is shown in Figs. 7 and 8. From the graphs, it can be inferred that the values of M′ and M″ are almost constant in case of all the composites along with pure OPANI up to the frequency range of 106 Hz without any appreciable change in the value and the low values of M′ and M″ toward the lower frequency range may be due to space charge or ionic polarization at the room temperature. Also, it is been noticed that the values of M′ and M″ increase toward the higher frequency side beyond 106 Hz exhibiting a dispersion shift. It can also be understood that at higher frequencies, the ions are spatially confined to their potential wells executing localized conduction of charge species in the bulk matrix rather than hopping from one site to the neighboring site. Reference Roy, Gupta, Sindhu, Ramamurthy and Madras24,Reference Abbas, Chandra, Verma, Chatterjee and Goel25
Variation of real part of electrical modulus as a function of frequency.

Variation of imaginary part of electrical modulus as a function of frequency.

From the impedance spectroscopic study, it can be understood that the impedance properties in a material occur due to motion of charges which can be either due to dipole re-orientation, space charge formation, charge displacement over short distances or can be long range mobility and so on. A noteworthy aspect of the ac impedance analysis gives us an idea of the various contributions to conductivity such as the conduction process happening within the bulk of the material, through grains or grain boundaries or between the grains and sample electrodes. Reference Roy, Anilkumar and Ambika Prasad26
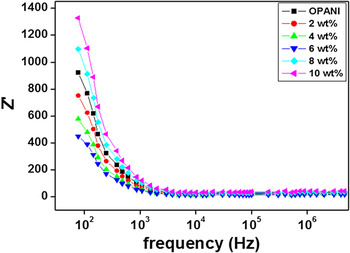
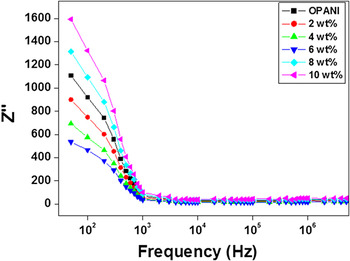
The complex impedance of the present composite material can be described by the equation Z* = Z′ + Z″, Where Z′ and Z″ are the real and imaginary parts of impedance, respectively.
The variation in real (Z′) and imaginary part of impedance (Z″) as a function of frequency for all the composites along with OPANI is shown in Figs. 9 and 10. It can be seen that, in both the plots the values of Z′ and Z″ decrease gradually up to the frequency range of 103 Hz and thereafter remain constant and almost dropping down close to zero for all the composite samples and also for OPANI, which can be concluded by observing the merging of all the curves at frequencies greater than 103 Hz. Also, the impedance value is low for the intermediate composite with 6 wt% of GO in OPANI and is high for 10 wt% composite.
Variation of real part of impedance as a function of frequency.

Variation of imaginary part of impedance as a function of frequency.

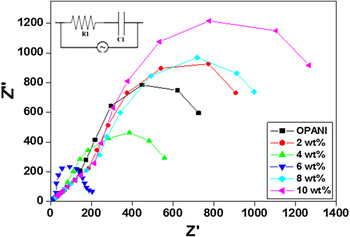
The Cole–Cole graphs indicate a decrease in electrical resistance with increasing filler concentration as well as with the applied frequency, as shown in Fig. 11. The impedance value depends on the bulk resistance and grain resistance in a complex LCR circuit. The bulk resistance and grain resistance decrease with increase in GO concentration and as a result the impedance value also decreases. Reference Xiang, Chen, Li and Bian27,Reference Wakabayashi, Fujita, Ajiki and Sigrist28 It is observed that as the filler concentration increases, the area under the curve decreases up to percolation threshold, indicating a sharp drop in the resistance. The formation of semicircular arc indicates that the presence of two different components in the composites forms a series resistor and geometrical capacitance and a decrease in the arc area indicates increase in the bulk conductivity as shown in inset figure. The formation of two semicircles is observed and it shows that relaxation time decreases with increase in applied frequency till 6 wt% and increases thereafter, which might be due to increase in grain resistance.
Cole–Cole plots.

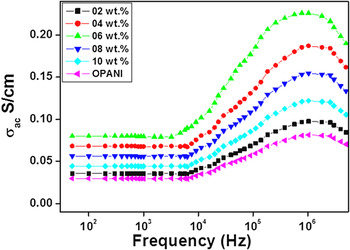
The variation of ac conductivity of OPANI/GO composites as a function of applied frequency is shown in Fig. 12. GO content was found to effect significantly the conductivity of the resulting composites. It can be observed that in the low frequency region, there is a distinct dispersion in the values of conductivity without much variation in their values up to a frequency of about 104 Hz for all the samples including OPANI. There is a significant change in conductivity curves of the composites beyond this frequency and exhibit a maximum at frequencies of 106 Hz. When 2 wt% of GO was incorporated into OPANI there was a slight enhancement in conductivity but further rise in conductivity was not proportional to addition of GO wt%. The conductivity values for 10 wt% composite were more than 2 wt% sample but less compared to 4, 6, and 8 wt% composites. Reference Roy, Koppalkar and Ambika Prasad29 The decrease in conductivity of OPANI/GO composite for 10 wt% of GO content may be due to increased insulating behavior of GO in the core of the composite. The addition of greater weight percentage of GO may lead to imperfections in the chain thus affecting the continuous charge delocalization process in the chain.
Variation of ac conductivity as a function of frequency.

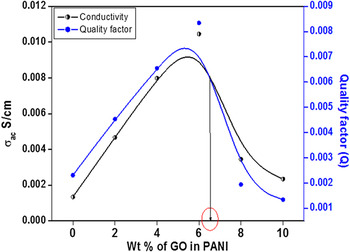
Among all the composites, 6 wt% composite shows a maximum conductivity of about 20 × 10−2 S/cm due to low dielectric constant and impedance value of composite. The conductivity of this particular composite was improved due to excellent interaction between OPANI and GO components. The conductivity of the composite was about four times better than the conductivity of pure OPANI. Such high conductivity of the composites might be an indication of particle–particle interfaces, which leads to overall percolation conductivity as shown in Fig. 13. The composites prepared herein are heterogeneous systems with both crystalline and amorphous regions. Conduction occurs through electron delocalization via substituted group in the crystalline domains which are surrounded by amorphous nonconducting regions consisting of disordered or folded chains. Reference Rogers, Takacs and Thompson30 The composite forms a dense network having many cross-linked connections which may favor the charge transfer across the sample between conducting and nonconducting phases.
Percolation against various wt% of GO in OPANI.

VII. CONCLUSION
A series of OPANI/GO composites with improved electrical and dielectric response have been synthesized successfully by incorporating GO into the OPANI matrix with different weight ratios by following a simple and versatile in situ polymerization method. The effect of GO content in the composite with respect to conductivity and dielectric properties of OPANI/GO has been investigated by different techniques. FTIR results show successful incorporation of GO in the OPANI matrix, leading to the formation of OPANI/GO composites due to interaction between the two components. Among all the composites, 6 wt% sample shows a better dispersion as well as homogenous distribution of GO in OPANI exhibiting flaky and folded nature in its micrograph obtained from the SEM. Also it was found that, the 6 wt% composite possesses a higher value of conductivity compared to pure OPANI. Such an improvement in conductivity can be explained due to large specific area and excellent homogenous dispersion of GO in OPANI which forms a conducting path in the OPANI matrix and assist the flow of charge carriers across the polymer chain. It was also noticed that the incorporation of GO into the OPANI matrix has a significant influence on the dielectric behavior of the nanocomposite. The results investigated in the present work show that the composites exhibit greater potential in terms of conductivity and dielectric performance. Hence, it can be anticipated that these hybrid materials exhibit better performance and open new opportunities for many technological applications.