Introduction
Around the globe, large-carnivore conservation is typically in conflict with human activities, and the way these conflicts are framed can impact human–wildlife coexistence (Treves & Karanth Reference Treves and Karanth2003, Woodroffe et al. Reference Woodroffe, Thirgood and Rabinowitz2005a, Peterson et al. Reference Peterson, Birckhead, Leong, Peterson and Peterson2010, Redpath et al. Reference Redpath, Young, Evely, Adamas, Sutherland and Whitehouse2013). Most studies of human–wildlife conflict focus on the impacts of wildlife on human livelihoods (e.g., livestock depredations, crop losses or property damage); however, some argue that discussions around these conflicts should be reframed (Peterson et al. Reference Peterson, Birckhead, Leong, Peterson and Peterson2010). Definitions of ‘conflict’ centre around human disagreements about incompatible goals and interference in achieving them (Peterson et al. Reference Peterson, Birckhead, Leong, Peterson and Peterson2010); this precludes wildlife from consideration as party to a conflict, and depicting wildlife as ‘conscious human antagonists’ can be detrimental (Peterson et al. Reference Peterson, Birckhead, Leong, Peterson and Peterson2010, Redpath et al. Reference Redpath, Bhatia and Young2015). Young et al. (Reference Young, Marzano, White, McCracken, Redpath and Carss2010) suggest human–wildlife conflicts be split into two categories: human–wildlife impacts (HWIs), which focus on the impacts of wildlife on humans and their activities (or vice versa); and human–human conflicts about wildlife. This shift has not gained much traction; most published literature has not changed the way these issues are framed (Redpath et al. Reference Redpath, Bhatia and Young2015).
HWIs between large carnivores and humans are well documented; carnivores can kill livestock and people, while people use lethal control methods to minimize carnivores’ impacts on their livelihoods (Woodroffe Reference Woodroffe, Gittleman, Wayne, Macdonald and Funk2001). Humans are responsible for substantial carnivore population declines and range contractions (Woodroffe Reference Woodroffe, Gittleman, Wayne, Macdonald and Funk2001, Ripple et al. Reference Ripple, Estes, Beschta, Wilmers, Ritchie and Hebblewhite2014). Those with livelihoods linked to livestock (e.g., food, clothing, income) are least likely to tolerate carnivores (Mishra Reference Mishra1997, Patterson et al. Reference Patterson, Kasiki, Selempo and Kays2004, Frank et al. Reference Frank, Woodroffe, Ogada, Woodroffe, Thirgood and Rabinowitz2005). Fear, threat of livestock loss and actual losses can all lead to lethal carnivore control (Naughton-Treves & Treves Reference Naughton-Treves, Treves, Woodroffe, Thirgood and Rabinowitz2005), thus social factors significantly impact carnivore conservation (Treves & Karanth Reference Treves and Karanth2003). Generally, these factors include: people’s attitudes and behaviours towards carnivores; costs to people coexisting with carnivores; and benefits that act as incentives for people to coexist with carnivores (Winterbach et al. Reference Winterbach, Winterbach, Somers and Hayward2013). Incorporating these factors when developing carnivore management plans is vital, as negative attitudes towards these species can hinder conservation initiatives (Mishra et al. Reference Mishra, Allen, McCarthy, Madhusudan, Bayarjargal and Prins2003, Naughton-Treves et al. Reference Naughton-Treves, Grossberg and Treves2003). Solutions that minimize negative HWIs, increase local stakeholder tolerance of carnivores and cultivate coexistence between people and wildlife are needed (Treves & Karanth Reference Treves and Karanth2003, Treves & Bruskotter Reference Treves and Bruskotter2014, Redpath et al. Reference Redpath, Bhatia and Young2015, van Eeden et al. Reference van Eeden, Eklund, Miller, López-Bao, Chapron and Cejtin2018).
Views towards wildlife are often determined by the species’ value as a resource (Lamarque et al. Reference Lamarque, Anderson, Fergusson, Lagrange, Osei-Owusu and Bakker2009). If a species has no monetary value to local stakeholders, it may garner negative attitudes (Mbaiwa et al. Reference Mbaiwa, Ngwenya and Kgathi2008, Lamarque et al. Reference Lamarque, Anderson, Fergusson, Lagrange, Osei-Owusu and Bakker2009). While local opinions of problem carnivore species vary (Li et al. Reference Li, Jiang, Li, Tang, Li and Luo2015), positive attitudes are associated with lower monetary losses from predation (Dickman Reference Dickman2005), benefits received from ecotourism (Lindsey et al. Reference Lindsey, duToit and Mills2005, Hemson et al. Reference Hemson, Maclennan, Mills, Johnson and Macdonald2009) and increased levels of education and wealth (Naughton-Treves et al. Reference Naughton-Treves, Grossberg and Treves2003, Zimmermann et al. Reference Zimmermann, Walpole and Leader-Williams2005). Communication of benefits associated with a species, and ways to avoid risk, can lead to increased tolerance and positive perceptions of carnivores (Bruskotter & Wilson Reference Bruskotter and Wilson2014). Generally, local community members have low carnivore tolerance levels (Kansky et al. Reference Kansky, Kidd and Knight2014, Inskip et al. Reference Inskip, Carter, Riley, Roberts and MacMillan2016). This low tolerance, fuelled by actual and perceived impacts, is regularly exhibited through lethal control practices and contributes to carnivore population declines (Naughton-Treves & Treves Reference Naughton-Treves, Treves, Woodroffe, Thirgood and Rabinowitz2005, Woodroffe et al. Reference Woodroffe, Thirgood, Rabinowitz, Woodroffe, Thirgood and Rabinowitz2005b).
In Botswana, the government established a compensation programme to encourage coexistence with carnivores (Department of Wildlife and National Parks 1998, 2013); it reimburses farmers for losses to carnivores of conservation concern. In the eastern Panhandle of the Okavango Delta, high levels of livestock depredation by wild carnivores in 2013, especially lions (Panthera leo), caused villagers to kill c. 30–50% of the local lion population (LeFlore et al. Reference LeFlore, Fuller, Tomeletso and Stein2019, LeFlore Reference LeFlore2020). These killings, via retaliatory shooting and poisoning events, served to both eliminate problem individuals and prevent future attacks. In 2014, we developed a multipronged management programme aimed at both lion conservation and minimizing negative HWIs on local stakeholders. This programme established technical solutions and interventions with the goal of bridging the gap between the needs of wildlife and the needs of humans. The management programme independently investigated livestock losses, established a predator-proof livestock enclosure building programme, designed a novel early warning system linked to lion satellite GPS collars, monitored the local lion population and shared information about lions with villagers at schools and village meetings where lions were given local names (see Weise et al. Reference Weise, Hayward, Casillas Aguirre, Tomeletso, Gadimang, Somers and Stein2018, Reference Weise, Hauptmeier, Stratford, Hayward, Aal and Heuer2019, LeFlore et al. Reference LeFlore, Fuller, Tomeletso and Stein2019, LeFlore Reference LeFlore2020). We conducted in-person interviews before and after these management interventions were established. Interviews investigated local farmers’ livestock management practices, attitudes towards carnivores and conservation, perceptions of HWIs and attitudes towards the established conservation programmes. Given high levels of predation, we hypothesized that respondents had negative attitudes towards carnivores, livestock received little supervision and respondents disapproved of the government’s compensation programme (Gusset et al. Reference Gusset, Swarner, Mponwane, Keletile and McNutt2009, Hemson et al. Reference Hemson, Maclennan, Mills, Johnson and Macdonald2009, LeFlore et al. Reference LeFlore, Fuller, Tomeletso and Stein2019). We expected respondents to support the new management programme but that their tolerance for carnivores would only marginally increase, as factors that affect tolerance and attitudes are complex (Dickman & Hazzah Reference Dickman, Hazzah and Angelici2016).
Study area
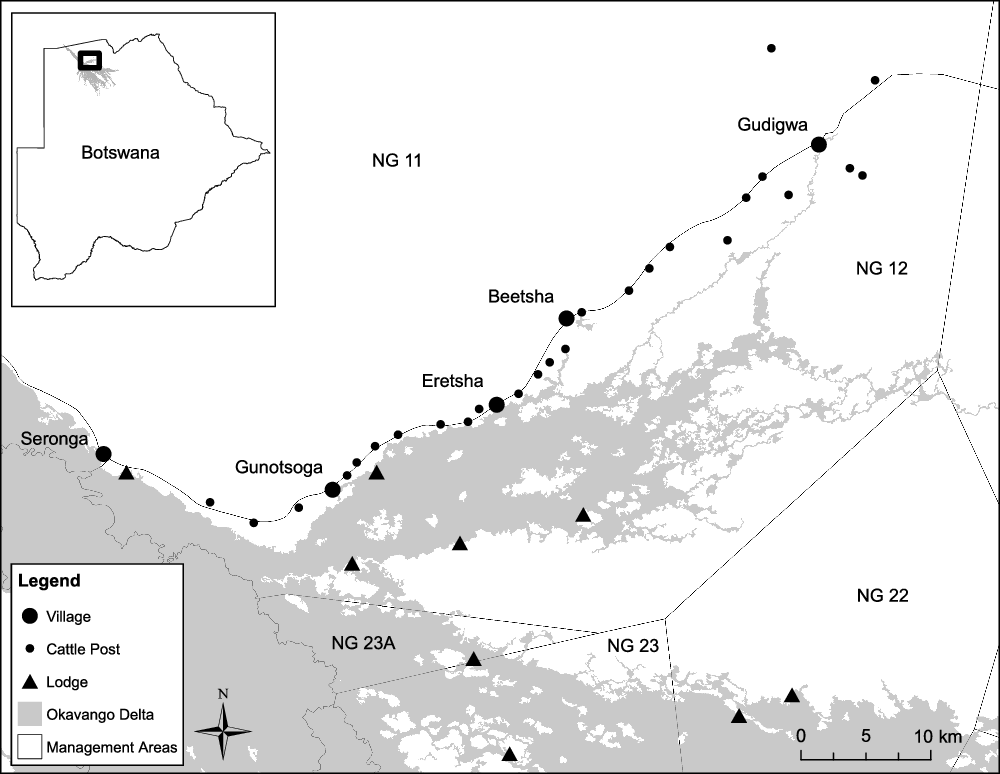
This study was conducted in northern Botswana within the Kavango-Zambezi Transfrontier Conservation Area (KAZA TFCA), an area of critical importance for lion conservation (Funston Reference Funston2014). The KAZA TFCA is c. 440 000 km2, spans five countries, includes 36 protected areas and is home to one of the largest lion populations in Africa (c. 3500 lions; Funston Reference Funston2014), classifying it as a lion stronghold (Riggio et al. Reference Riggio, Jacobson, Dollar, Bauer, Dickman and Funston2013). We focused on the eastern panhandle of the Okavango Delta (Fig. 1), a seasonally flooded wetland (McCarthy et al. Reference McCarthy, Cooper, Tyson and Ellery2000, Kgathi et al. Reference Kgathi, Kniveton, Ringrose, Turton, Vanderpost, Lundqvist and Seely2006) that connects the Delta to the rest of the KAZA TFCA and supports people, their livestock and plentiful wildlife (Ramberg et al. Reference Ramberg, Hancock, Lindholm, Meyer, Ringrose and Sliva2006, Fynn et al. Reference Fynn, Murray-Hudson, Dhliwayo and Scholte2015).
Study area map showing villages, cattle posts, safari lodges and government-defined management area boundaries. NG = Ngamiland.

Our research encompassed government-defined management areas that were slated for uses ranging from human habitation and natural resource consumption (Ngamiland (NGs) 11 and 12) to wildlife management and community/internationally run ecotourism (NGs 22, 23 and 23A) (Figure 1). Hunting is not allowed as Botswana imposed a national hunting ban in 2014 (Mbaiwa Reference Mbaiwa2018). Four ethnic groups inhabit NGs 11 and 12 (Bakgaladadi, Bambukushu, Basarwa and Bayei) and speak four languages (Sekgaladi, Sembukushu, Sesarwa and Seyei). Most people also speak Setswana, one of two national languages in Botswana. English, the second, is not widely spoken.
Villagers are agropastoralists, keeping livestock (cattle, Bos taurus/Bos indicus; goat, Capra hircus; horse, Equus caballus; and donkey, Equus asinus) and tending crops during the growing season (typically December–April). Livestock are typically protected overnight in traditional thorn branch or wooden post enclosures, referred to locally as ‘kraals’ (LeFlore et al. Reference LeFlore, Fuller, Tomeletso and Stein2019). People live in villages and smaller familial settlements (cattle posts (CPs)). This study included four focal villages (Beetsha, Eretsha, Gudigwa and Gunotsoga) and associated CPs due to high levels of livestock depredation and proximity to critical lion habitat; there were c. 700–1600 people/village (total c. 4000) (Botswana Population and Housing Census 2011).
Methods
We conducted 409 structured interviews across focal villages in October–December 2014 and October–December 2016 (initial n = 201, follow-up n = 208). Respondents were organized by where they lived, either village centre (VC) or CP. Adult (ages ≥18 years) male and female respondents were opportunistically selected. We attempted to speak with heads of households, capturing the most influential opinions. Interviews were conducted in English and translated into a local language by native speakers MT and TCD, depending on respondent preference. We resampled the 2014 respondents during follow-up surveys in 2016 (resample rate = 65%). When circumstances made this impossible (e.g., death, remote employment, refusal), we selected additional respondents, maintaining similar sample sizes. New and repeat respondent data were pooled as management treatments were applied across all villages. In addition, no significant differences were found between key demographic characteristics or attitude metrics when compared via two-tailed Pearson’s χ2 tests and t-tests (Supplementary Table S1, available online).
Interviews comprised open- and close-ended questions with opportunities for additional explanation. Questions focused on the following: demographics; livestock husbandry techniques; livestock losses; attitudes towards carnivores; perceptions of wildlife, conservation and HWIs; attitudes towards the government compensation programme; and attitudes towards new management interventions (Table S2). Respondents were informed that responses were confidential, participation was voluntary and answering all questions was not mandatory. Initial interviews lasted 47 minutes on average (range 20–156 minutes, median 45 minutes) and follow-up interviews lasted 27 minutes (range 11–74 minutes, median 28 minutes). Results were analysed using tolerance scores, descriptive statistics, χ2 and t-tests through R statistical software (R version 3.5.1; R Core Team 2018). Tolerance scores were calculated based on responses to questions regarding respondents’ attitudes towards carnivores and the government-run compensation programme using a five-point Likert scale. Responses ranged from ‘strongly dislike/approve’ to ‘strongly like/disapprove’, and mean tolerance/approval scores were obtained by assigning values ranging from –2 to +2 to these responses.
Results
Respondent demographics
There were 201 initial (100 VC, 101 CP) and 208 follow-up (111 VC, 97 CP) interviews conducted across the four villages, with totals per village (VC and CP) ranging from 47 to 56 (Tables S3 & S4). More men than women were interviewed in both rounds (initial 69%, n = 139; follow-up 71%, n = 148), with most respondents being heads of their household (65%, n = 131; 63%, n = 131), which included seven people/household on average. Based on the Botswana Population and Housing Census (2011), projected national population growth rates (World Bank 2016) and respondents speaking for approximately seven people, we estimate our samples represented c. 30% of the total population in the area. Most respondents from the two rounds had either received no education (43%, n = 87 and 37%, n = 76, respectively) or attended secondary school (37%, n = 74 and 36%, n = 75, respectively). Most respondents owned livestock (71%, n = 143 and 82%, n = 171, respectively).
Perceptions of wildlife and conservation
Most initial respondents (75%, n = 151) believed there was more wildlife than 10 years before and that livestock predation levels were increasing (79%, n = 159). Only 18% (n = 36) of respondents thought coexistence with carnivores was possible, and 87% (n = 174) believed livestock were lions’ most favoured prey. More CP respondents believed livestock were a lion’s top prey choice than VC respondents (n = 93 versus 81, χ2 = 4.39, p = 0.036). When asked about ways to improve coexistence, respondents suggested minimizing interactions by keeping carnivores separate from people/livestock (25%, n = 50), keeping carnivores in national parks (13%, n = 27), keeping carnivores within fences (10%, n = 21), removing carnivores altogether (8%, n = 15) or that improvement was impossible (8%, n = 16).
Most initial respondents (83%, n = 167) claimed not to use lethal control to manage HWIs, although 47% of farmers (n = 67) stated they had zero tolerance of livestock depredations (i.e., after one event they would retaliate, killing offenders). Only two individuals (1%) cited killing predators to control HWIs. When asked about their knowledge of other villagers’ use of lethal control within the last year, four individuals (2%) reported a total of four separate instances of individual lion killings. In the follow-up surveys, 6% (n = 12) of respondents reported using lethal control methods to manage HWIs; 3% (n = 7) reported they knew of a total of seven lions, four spotted hyenas and eight African wild dogs killed by villagers in the previous year.
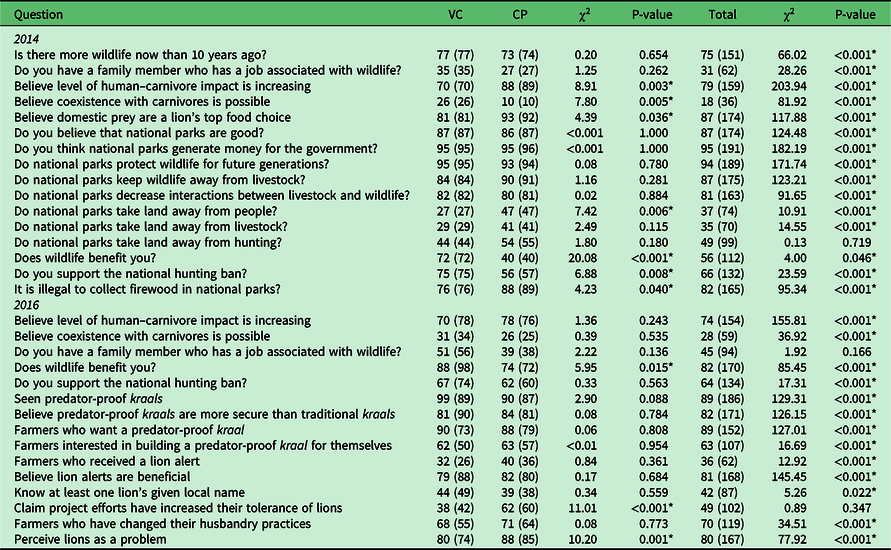
Most initial respondents (87%, n = 174) believed national parks are good, citing income for the government (95%, n = 191), protecting wildlife for future generations (94%, n = 189), keeping wildlife from livestock (87%, n = 175) and reducing HWIs (81%, n = 163) (Table 1). A third believed national parks take land from people (37%, n = 74) or livestock (35%, n = 70), and half thought they take land from hunting (49%, n = 99).
Percentages of ‘yes’ responses (numbers of respondents in parentheses) to questions of conservation importance from initial surveys in 2014 (VC n = 100, CP n = 101, total n = 201) and follow-up surveys in 2016 (VC n = 111, CP n = 97, total n = 208) by location with associated χ2 tests for homogeneity.

Follow-up surveys also included questions regarding the established management interventions. Total percentage ‘yes’ responses (number of respondents in parentheses) and associated χ2 goodness of fit tests also shown.
*Significant p-values.
CP = cattle post; VC = village centre.
While more initial respondents believed wildlife benefitted them (56%, n = 112, χ2 = 4.00, p = 0.046) and supported the national hunting ban (66%, n = 132, χ2 = 23.59, p < 0.001), VC and CP respondents’ views were dissimilar. More VC respondents believed wildlife benefitted them (72%, n = 72 versus 40%, n = 40, χ2 = 20.08, p < 0.001) and supported the hunting ban (75%, n = 75 versus 56%, n = 57, χ2 = 6.88, p = 0.008) (Table 1). Conversely, more CP respondents (47%, n = 47; VC 27%, χ2 = 7.42, p = 0.006) believed national parks take land from people and held more negative views towards carnivores. More CP respondents believed livestock predation was increasing (88%, n = 89 versus 70%, n = 70, χ2 = 8.91, p = 0.003), and fewer believed coexistence was possible (10%, n = 10 versus 26%, n = 26, χ2 = 7.80, p = 0.005).
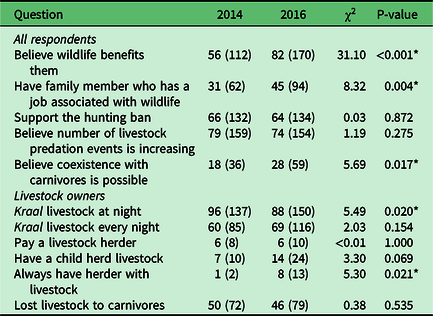
As with initial surveys, more VC follow-up respondents believed wildlife benefitted them compared to CP respondents (88%, n = 98 versus 74%, n = 72, χ2 = 5.95, p = 0.015) (Table 1). In general, more follow-up respondents believed wildlife benefitted them (82%, n = 170, χ2 = 85.45, p < 0.001) (Table 1), a significant increase from initial surveys (χ2 = 31.1, p < 0.001) (Table 2). Respondents who supported the hunting ban remained constant between initial and follow-up surveys (66%, n = 132 versus 64%, n = 134, χ2 = 0.03, p = 0.872), as did those who believed that livestock depredations were increasing (79%, n = 159 versus 74%, n = 154, χ2 = 1.19, p = 0.275 (Table 2).
Comparison by χ2 tests for homogeneity for key questions involving wildlife, conservation and livestock management from initial surveys in 2014 and follow-up surveys in 2016.

Percentages of respondents who answered ‘yes’ shown (numbers of respondents in parentheses). All respondents answered questions about wildlife and conservation (2014 n = 201, 2016 n = 208), while only livestock owners answered questions about livestock management (2014 n = 143, 2016 n = 171).
* Significant p-values.
Livestock husbandry
In initial surveys, only 6% (n = 8) of livestock owners paid a herder to guard livestock, 7% (n = 10) had children herd livestock and 1% (n = 2) always had a herder with livestock (Table 2). Most livestock owners reported kraaling livestock at night (96%, n = 137), but only 60% (n = 85) reportedly kraal livestock every night. Most (76%, n = 109) livestock owners were willing to modify husbandry practices to minimize depredations. Some 50% (n = 72) of livestock owners lost livestock to carnivores in the year before initial surveys and 46% (n = 79) lost livestock during the study. Initial respondents owned 3611 livestock and follow-up respondents owned 3383 livestock, with cattle being the most prevalent livestock in the area (Table S5). In the year leading up to the initial surveys, respondents reported that 10% (n = 371) of owned livestock were killed by carnivores. This number declined during the study as respondents reported losing 5% (n = 181) of livestock, with lions responsible for 75% of those losses. According to government valuation of livestock by national average market value (Department of Wildlife and National Parks 2013), livestock killed by carnivores in the year before the initial surveys were valued at c. US$97,000, and during the study killed livestock were valued at c. US$47,000 (Table S6).
While fewer respondents reported kraaling their livestock at night during the study (88% (n = 150), down from 96% (n = 137), χ2 = 5.49, p = 0.02), more kraaled their livestock every night (60% (n = 85) to 69% (n = 116), χ2 = 2.03, p = 0.154). Respondents who paid a herder remained constant (6% (n = 8) to 6% (n = 10)); respondents who had children herd livestock (7% (n = 10) to 14% (n = 24), χ2 = 3.30, p = 0.069) and always had a herder with livestock (1% (n = 2) to 8% (n = 13), χ2 = 5.3, p = 0.021) increased.
Tolerance/approval scores
Initial surveys yielded a tolerance score for lions of –0.79 (σ = 1.03) (Table 3), with 61% (n = 123) of respondents having negative attitudes. Initial survey respondents were less tolerant of having lions close to the village (tolerance score = –1.53, σ = 0.67), with 94% (n = 189) of respondents having negative attitudes. Respondents were slightly more tolerant of predators in general, with 48% (n = 96) having negative attitudes (tolerance score = –0.45, σ = 1.11). For these metrics, CP respondents had significantly more negative attitudes than VC respondents.
Mean tolerance/approval scores by location for initial surveys in 2014 (VC n = 100, CP n = 101, total n = 201) and follow-up surveys in 2016 (VC n = 111, CP n = 97, total n = 208) with associated t-statistics.

Further comparison by t-statistic of total mean tolerance scores between initial and follow-up surveys also shown.
* Significant p-values.
CP = cattle post; VC = village centre.
Overall, 59% (n = 118) of respondents had negative attitudes towards the government-run compensation programme (approval score = –0.09, σ = 1.34) (Table 3), with 84% (n = 99) citing low and slow payments as reasons for dissatisfaction. There was no significant difference in approval scores between VC and CP. Initial survey respondents were asked about their interest in a potential non-government livestock insurance. A total of 90% (n = 129) of livestock owners were interested and 86% (n = 111) were willing to pay to participate; however, they were unwilling to pay enough to sustain the programme, with 69% (n = 76) only willing to pay less than c. US$25 annually (BWP250, range US$10–600, mean US$46; US$1 = BWP10, July 2015).
Follow-up respondents were more tolerant of lions and carnivores than initial respondents, with tolerance scores increasing to –0.13 (σ = 1.16, t = –6.04, p < 0.001) and –0.03 (σ = 1.08, t = –3.70, p < 0.001), respectively (Table 3). There was no significant difference in tolerance of lions near villages (tolerance score = –1.45, σ = 0.98, t = –0.97, p = 0.333). CP respondents continued to have stronger negative attitudes towards lions and having lions near villages than VC respondents.
Management programme perceptions
Follow-up respondents had positive views of the established management programme. Most had seen the predator-proof kraals (89%, n = 186) and believed they were more secure than traditional kraals (82%, n = 171). Most livestock owners (89%, n = 152) wanted their own kraal, with 63% (n = 107) interested in building one, citing limited time and resources as impediments. Only 36% of farmers (n = 62) had received a lion alert, but most believed alerts were beneficial (81%, n = 168). A total of 42% of respondents (n = 87) knew the local name of at least one lion. Half (49%, n = 102) believed management interventions increased their lion tolerance, with a more significant increase occurring with CP respondents (χ2 = 11.01, p < 0.001). Most livestock owners (70%, n = 119) reported changing husbandry practices due to the programme, increasing the frequency of kraaling. Despite these positive trends, 80% of respondents (n = 167) still perceived lions to be problematic.
Discussion
Livestock husbandry and losses
Limited livestock supervision, which contributes to predation levels in northern Botswana, likely results from complacency following the establishment of the government compensation programme and a declining herding culture (Breitenmoser et al. Reference Breitenmoser, Angst, Landry, Breitenmoser-Würsten, Linnell, Weber, Woodroffe, Thirgood and Rabinowitz2005, Dickman et al. Reference Dickman, Macdonald and Macdonald2011). Children attend school and are unable to tend livestock, villagers state that herding is looked down upon as a profession and farmers do not have the resources to pay herders. These circumstances, along with growing human and livestock populations, have led to increased livestock depredation (Messmer Reference Messmer2000, Krafte Holland et al. Reference Krafte Holland, Larson and Powell2018). Improved livestock management methods minimize HWIs and help decrease the number of carnivore killings (Ogada et al. Reference Ogada, Woodroffe, Oguge and Frank2003, Treves & Karanth Reference Treves and Karanth2003, Woodroffe et al. Reference Woodroffe, Frank, Lindsey, ole Ranah and Romañach2007), and future efforts to prevent predation should focus on improving livestock management and educating farmers about the benefits of better livestock management (Eklund et al. Reference Eklund, Lopez-Bao, Tourani, Chapron and Frank2017, Krafte Holland et al. Reference Krafte Holland, Larson and Powell2018).
Initial reports that 10% of livestock were lost to carnivores in 1 year were above levels elsewhere (0.02–5.50%; Kruuk Reference Kruuk1980, Karani Reference Karani1994, Frank Reference Frank1998, Patterson et al. Reference Patterson, Kasiki, Selempo and Kays2004, Graham et al. Reference Graham, Beckerman and Thirgood2005, Kolowski & Holekamp Reference Kolowski and Holekamp2006, Hemson et al. Reference Hemson, Maclennan, Mills, Johnson and Macdonald2009). This is likely due to unusually high levels of predation prior to the study (LeFlore et al. Reference LeFlore, Fuller, Tomeletso and Stein2019), overstatement of actual losses (purposefully or due to recall bias) (Tarrant et al. Reference Tarrant, Manfredo, Bayley and Hess1993) and/or negative attitudes/perceptions of carnivores (Dickman Reference Dickman2010, Dickman et al. Reference Dickman, Hazzah, Carbone and Durant2014). Depredation levels over the 2-year span between surveys (5%) were in line with the trends noted above. This reduction could be caused by stronger management practices resulting from the established programme, a decline in the local lion population as a result of retaliatory killings in 2013 and/or more awareness of the issues during the study. Losses claimed here were reported through an interview process and potentially influenced by response or recall bias. However, both perceived costs and actual losses impact attitudes and perceptions of local stakeholders, all directly affecting conservation (Dickman & Hazzah Reference Dickman, Hazzah and Angelici2016). Although overall levels of loss may have been overestimated, our independent investigations confirmed what villagers reported here – lions were responsible for 75% of livestock losses (LeFlore et al. Reference LeFlore, Fuller, Tomeletso and Stein2019).
Attitudes towards carnivores
CP respondents had more negative perceptions of wildlife, conservation and HWIs than VC respondents. CP residents typically have fewer resources, less access to education (Lagendijk & Gusset Reference Lagendijk and Gusset2008, Gebresenbet et al. Reference Gebresenbet, Bauer, Vadjunec and Papeş2018), live more remotely, own more livestock and are more likely to have negative interactions with carnivores, contributing to negative attitudes (Zimmerman et al. Reference Zimmermann, Walpole and Leader-Williams2005). Even though respondents generally had low tolerance of carnivores, only 6% or less reported using lethal control to manage HWIs, which is lower than another study in Botswana, where c. 12% had attempted to kill a lion (Hemson et al. Reference Hemson, Maclennan, Mills, Johnson and Macdonald2009). Given previous retaliatory killings and poisoning events in 2013 (LeFlore et al. Reference LeFlore, Fuller, Tomeletso and Stein2019), this low level is unlikely; respondents may have been reluctant to share information because carnivore killing is illegal (Cross et al. Reference Cross, St. John, Khan and Petroczi2013). We therefore utilized projective questioning to ask people about others’ behaviour, in addition to their own (Cross et al. Reference Cross, St. John, Khan and Petroczi2013). While the effects and frequency of carnivore killings in northern Botswana are still largely unknown (Gusset et al. Reference Gusset, Swarner, Mponwane, Keletile and McNutt2009), they were significant in East Africa (Woodroffe & Frank Reference Woodroffe and Frank2005), where 19 out of 20 collared lions were lost in retaliatory killings. Investigation into lethal control of lions and other carnivores in the Delta is required.
Half of all farmers had lost livestock to carnivores and c. 90% of respondents believed a lion’s top prey choice was livestock. Actual losses to and perceived costs of carnivores contribute to local stakeholders’ negative attitudes (Naughton-Treves Reference Naughton-Treves1997, Naughton-Treves et al. Reference Naughton-Treves, Grossberg and Treves2003). These real and perceived costs likely contribute to the belief that coexistence with lions is impossible. We suggest that the government-run compensation programme alone has not effectively changed villagers’ willingness to coexist with carnivores and requires modification (Gusset et al. Reference Gusset, Swarner, Mponwane, Keletile and McNutt2009).
Management programme efficacy
While farmers were willing to participate, a non-governmental insurance programme proved infeasible. Farmers were only willing to pay a minimal premium, so a continued significant external investment would be required (Nyhus et al. Reference Nyhus, Fischer, Madden and Osofsky2003, Reference Nyhus, Osofsky, Ferraro, Madden, Fischer, Woodroffe, Thirgood and Rabinowitz2005, Dickman et al. Reference Dickman, Macdonald and Macdonald2011). Management strategies are likely only popular and effective if community costs are kept to a minimum. Our results suggest that intensive management programmes, established here alongside government compensation, can positively impact tolerance of carnivores. We posit that an expansion and streamlining of the lion alert programme, along with increased levels of herding, could greatly reduce livestock losses in the area and help increase tolerance further. Tolerance scores significantly increased, although respondents continued to have negative attitudes towards carnivores, albeit response bias may have influenced these reported attitudes. However, this was unlikely, as respondents maintained strong negative attitudes towards lions near their village, while general attitudes towards lions significantly increased. Conservation efforts encouraging human–carnivore coexistence typically target reducing livestock depredation, providing economic incentives for coexistence and/or improving tolerance through education (Western et al. Reference Western, Macdonald, Loveridge and Dickman2019). The management efforts discussed here, alongside government compensation, address the targets mentioned above while supporting the effectiveness of a multipronged approach to promoting coexistence with carnivores (Western et al. Reference Western, Macdonald, Loveridge and Dickman2019). Increased local stakeholder tolerance of and coexistence with carnivores can be achieved through intensive, interdisciplinary and locally tailored management actions (Dickman Reference Dickman2010, Dickman et al. Reference Dickman, Macdonald and Macdonald2011, Treves & Bruskotter Reference Treves and Bruskotter2014).
Conclusion
While tolerance levels increased over the course of our study, negative attitudes persisted and likely impede coexistence with carnivores in the Okavango Delta and KAZA TFCA (Mishra et al. Reference Mishra, Allen, McCarthy, Madhusudan, Bayarjargal and Prins2003, Naughton-Treves & Treves Reference Naughton-Treves, Treves, Woodroffe, Thirgood and Rabinowitz2005, Funston Reference Funston2014). Both real and perceived costs contribute to negative attitudes. Addressing these attitudes should be central to future conservation efforts, and understanding site-specific HWIs is necessary before implementing mitigation strategies (Woodroffe et al. Reference Woodroffe, Frank, Lindsey, ole Ranah and Romañach2007, Dickman et al. Reference Dickman, Macdonald and Macdonald2011). The governmental compensation programme alone does not fully address HWIs or negative attitudes towards carnivores (Dickman et al. Reference Dickman, Macdonald and Macdonald2011) and requires revision. Understanding the viewpoints of people affected by HWIs is integral to the development and assessment of conservation management strategies.
Supplementary material
To view supplementary material for this article, please visit https://doi.org/10.1017/S0376892920000120.
Acknowledgements
We sincerely thank the respondents for sharing their perspectives with us and we recognize all community members and leaders for their continued interest and support. The Botswana Ministry of Environment, Wildlife, and Tourism and Department of Wildlife and National Parks granted permission for this research; in particular, we acknowledge M Flyman and M Mweze for their support. We thank P Sheller and Ngami Data Services for sharing GIS data. Finally, we thank two anonymous reviewers for providing thoughtful comments and suggestions.
Financial support
This work was funded by a J William Fulbright Research Scholarship, University of Massachusetts Amherst Graduate School, National Geographic Big Cats Initiative (grant numbers: B5-15 and B10-16) and Mellon Mays Graduate Initiative through the Social Science Research Council.
Conflict of interest
None.
Ethical standards
Survey procedures and questions were approved by the University of Massachusetts Institutional Review Board (IRB #2019-5619) and the Botswana Ministry of Environment, Wildlife and Tourism (research permit EWT 8/36/4 XXVII (61)).