I. Introduction
Data are at the core of today’s businesses. In the financial sector, banks have traditionally maintained strict control over customer data and services. However, the emergence of open banking initiatives worldwide has enabled customer-authorized sharing of financial data among banks and regulated third-party providers (TPPs), with the aim of increasing competition, improving payment services, and mitigating fraud. According to Babina, Bahaj, Buchak, De Marco, Foulis, Gornall, Mazzola, and Yu (Reference Babina, Bahaj, Buchak, De Marco, Foulis, Gornall, Mazzola and Yu2025), up to 80 countries have considered open banking policies, and 49 have implemented them. Among TPPs, fintech firms have emerged as key beneficiaries of open banking initiatives, particularly those focused on payment services, such as payment initiation and account aggregation. By gaining authorized access to bank customers’ data, these firms can develop and deliver new financial services. This is crucial, as fintech firms can offer innovative digital solutions that incumbent financial institutions often lack, thus positioning themselves to redesign the financial landscape by reducing operational costs and compressing margins (see, e.g., Frost (Reference Frost2020), Feyen, Frost, Gambacorta, Natarajan, and Saal (Reference Feyen, Frost, Gambacorta, Natarajan and Saal2021), and Cornelli, Frost, Gambacorta, Rau, Wardrop, and Ziegler (Reference Cornelli, Frost, Gambacorta, Rau, Wardrop and Ziegler2023)).
This article examines how open banking affects fintech firms. We analyze the implementation of Europe’s open banking reform, formalized through the Second Payment Services Directive (PSD2), and its effects on fintech performance, investment, labor intensity, productivity, and funding structure using a data set of Spanish fintech firms from 2014 to 2022. Given PSD2’s regulatory focus on the payments sector, our identification strategy exploits the differential exposure of payment-focused fintech firms relative to fintech firms whose business models do not involve payment processing or payment-account access. We estimate the causal effects using a difference-in-differences design comparing treated and control firms before and after PSD2.
Our results indicate that payment fintech firms directly affected by open banking improved performance relative to the control group. On average, treated firms show a 24-percentage point increase in return on assets (ROA) after PSD2. They also reduce investment in intangible and tangible assets, maintain higher liquidity, and shift toward higher labor costs with lower labor intensity but a greater share of permanent employment, resulting in productivity gains. In terms of funding, treated firms reduce reliance on long-term bank debt and move toward market-based funding. Payment fintech firms obtain larger, more stable, and more frequent equity funding after PSD2. Firms attracting greater external equity financing also reduce their reliance on long-term bank debt the most, consistent with a shift from bank-based to market-based financing following open banking. The changes in performance and funding among payment fintechs appear to be driven mainly by revenue growth, as firms leveraged customer data to boost income and benefited from increased attention from both consumers and investors.
Our findings inform policymakers aiming to promote innovation and competition through data-driven financial regulation. The results also help fintech investors, managers, and entrepreneurs understand how regulatory changes affect firm performance and financing, including capital structure and funding conditions.
This article contributes to two main strands of the literature: open banking and the fintech ecosystem. Prior studies have shown that open banking improves access to financial services for households and small-to-medium-sized enterprises (Nam (Reference Nam2023), Babina et al. (Reference Babina, Bahaj, Buchak, De Marco, Foulis, Gornall, Mazzola and Yu2025)), promotes financial inclusion (Fang and Zhu (Reference Fang and Zhu2023)), fosters competition (Polasik, Huterska, Iftikhar, and Mikula (Reference Polasik, Huterska, Iftikhar and Mikula2020)), and increases informational efficiency in borrower selection (He, Huang, and Zhou (Reference He, Huang and Zhou2023)). However, the adoption of open banking initiatives is shaped by consumer trust and privacy concerns regarding data sharing (Parlour, Rajan, and Zhu (Reference Parlour, Rajan and Zhu2022), Polasik and Kotkowski (Reference Polasik and Kotkowski2022), Bijlsma, van der Cruijsen, and Jonker (Reference Bijlsma, van der Cruijsen and Jonker2023), and Babina et al. (Reference Babina, Bahaj, Buchak, De Marco, Foulis, Gornall, Mazzola and Yu2025)). While prior studies have considered the effects of bank data portability on the profitability of banks (Lin, Zhang, and Zachariadis (Reference Lin, Zhang and Zachariadis2025)) and fintech firms (Peón and Sun (Reference Peón and Sun2025)), the broader implications for fintech firm dynamics and funding structures remain underexplored. This article contributes to the literature on open banking and customer data sharing by providing empirical evidence on how open banking influences fintech firms’ competitiveness and financial structure.
Previous research has highlighted how fintech firms have disrupted traditional financial services (Philippon (Reference Philippon2018), Vives (Reference Vives2019), Thakor (Reference Thakor2020), Bao and Huang (Reference Bao and Huang2021), Boot, Hoffmann, Laeven, and Ratnovski (Reference Boot, Hoffmann, Laeven and Ratnovski2021), and Berg, Fuster, and Puri (Reference Berg, Fuster and Puri2022)). The rise of fintech is shaped by multiple factors, such as the relatively high cost of financial services (Philippon (Reference Philippon2018)), lack of competition in banking markets (Claessens, Frost, Turner and Zhu (Reference Claessens, Frost, Turner and Zhu2018), Frost (Reference Frost2020)), favorable economic climate (Haddad and Hornuf (Reference Haddad and Hornuf2019)), the presence of technology clusters (Laidroo and Avarmaa (Reference Laidroo and Avarmaa2020)), and access to diverse funding sources (Haddad et al. (Reference Haddad and Hornuf2019), Brandl and Hornuf (Reference Brandl and Hornuf2020)). While existing literature has examined the factors contributing to the performance of these new competitors (Carbó-Valverde, Cuadros-Solas and Rodríguez-Fernández (Reference Carbó-Valverde, Cuadros-Solas and Rodríguez-Fernández2022), Salerno, Sampagnaro and Verdoliva (Reference Salerno, Sampagnaro and Verdoliva2022), and Andrikopoulos and Dassiou (Reference Andrikopoulos and Dassiou2024)), there is limited research on how data-sharing regulations shape the development of the fintech ecosystem. Our article addresses this gap by providing empirical evidence on how data-driven financial regulations can influence the growth dynamics of new financial service providers.
The article is structured as follows: Section II presents background information on PSD2 and the data. Section III outlines the identification strategy and the methodology used for the empirical analysis. Section IV presents the main findings. Section V explores the channels through which open banking affects fintech firms’ dynamics and funding. Section VI reports robustness checks. Section VII concludes and discusses the implications of our findings.
II. Institutional Background and Data
A. The European Open Banking Framework: PSD2
Countries worldwide are adopting open banking to drive innovation, enhance competition, and empower customers within their financial sectors.Footnote 1 In the European Union, open banking was established with the approval of the PSD2,Footnote 2 which came into effect on Jan. 13, 2018. Its objective was to increase competition and innovation in the payments industry while enhancing consumer protection and the security of payment services. Since PSD1 was passed in 2007, there had been significant innovations in the digital payments market, such as the rise of application programming interfaces (APIs) and an increase in online payment fraud.
Notably, PSD2 introduced two major innovations that reshaped the European payments landscape. First, it created a legal framework for TPPs to access customers’ payment account data and to initiate payments on their behalf. These TPPs include account information service providers (AISPs) and payment initiation service providers (PISPs). Second, it introduced new security requirements, notably strong customer authentication (SCA) and some regulatory technical standards (RTS) which provide detailed specifications for secure communications between banks and TPPs.
In addition to creating new types of actors (TPPs), PSD2 also imposed obligations on existing payment service providers (PSPs), a broader category that includes banks, electronic money institutions (EMIs), and other licensed entities authorized to execute payment transactions. Although not classified as TPPs, these PSPs are subject to PSD2 provisions, especially those related to customer authentication, transaction security, and interoperability. For instance, EMIs and payment gateways were required to update their technical infrastructure to comply with SCA and RTS protocols and to ensure compatibility with TPP access mechanisms. As a result, even firms not explicitly labeled as TPPs were functionally affected by PSD2, particularly those involved in payment initiation, processing, or wallet-based services.
The PSD2 framework in Europe stands out from other jurisdictions’ open banking initiatives due to two main factors. First, PSD2 is a regulatory-driven initiative rather than a market-driven one.Footnote 3 Unlike in countries such as the United States, India, and Japan, where open banking is driven largely by market forces, PSD2 establishes a legal mandate for financial institutions to provide authorized TPPs with standardized and secure access to customer data with the users’ consent. Consequently, PSD2 simplifies data access for TPPs without the need for lengthy negotiations with each financial institution, thus also increasing customers’ trust.
Second, PSD2 is specifically focused on payments. It mandates access to payment account data and services to enhance competition and innovation within the payments industry. This focus contrasts with broader frameworks that encompass multiple sectors beyond banking.Footnote 4 PSD2’s primary focus on the payments sector is clear from its denomination and scope,Footnote 5 as stated in Article 2.1: “This Directive applies to payment services provided within the Union.” To achieve this, the regulation places special emphasis on introducing open banking services by allowing TPPs to access payment account information and initiate payments. It also focuses on enhancing the convenience and security of digital payments (SCA and RTS).Footnote 6 These security measures provide a level of detail and enforceability that distinguishes PSD2 from less stringent regulations in other jurisdictions. This approach is relevant because, by mandating such comprehensive security protocols, PSD2 bolsters consumer trust in digital payments.
B. Data and Sample Composition
To identify fintech firms operating in Spain,Footnote 7 we rely on the FinTech Radar, a database compiled by the Banco de España using publicly available informationFootnote 8 from official registers, industry associations, and firms’ websites. Firms are classified as fintech according to the Financial Stability Board’s (FSB) definition.Footnote 9 The FinTech Radar provides information on firms’ business activities, corporate affiliations, headquarters location, fiscal identifiers, incorporation dates, NACE classifications (Nomenclature of Economic Activities in the European Community), registration records,Footnote 10 operational status, technological infrastructure, and funding history.Footnote 11 As of January 2025, the database includes 794 fintech firms identified by unique fiscal identifiers.
To obtain firm-level financial information, we merge the FinTech Radar with the microdata on individual enterprises (CBI) in the Central Balance Sheet Data Office of Banco de España.Footnote 12 Because the CBI covers nonfinancial firms, our analysis focuses on nonbank fintech institutions,Footnote 13 while the impact of open banking on banks and other lending institutions lies outside the scope of the article. By matching the list of fintech firms from the FinTech Radar with the microdata available in the CBI, we construct a panel data set of Spanish fintech firms with detailed balance sheet information. Using the CBI, rather than alternative private databases such as Orbis, provides more standardized and comprehensive financial data and broader firm coverage. The final sample includes 423 fintech firms with complete balance sheet information.
Finally, we match our sample (CBI + FinTech Radar) with data on equity funding from Dealroom.co, a database with extensive coverage of European startups and technology ecosystems, including information on funding amounts, number of rounds, investor origin and type, and funding stage. Dealroom.co reports 1,034 funding rounds involving 456 Spanish fintech firms during our sample period (2014–2022). Within our matched sample, 95 fintech firms (178 firm-year observations) received a total of €304,334 million in market funding over this period. Payment fintech firms account for 19.19% of the total market funding.
To ensure that our final sample of fintech firms is representative of the total population of fintech firms in the FinTech Radar, we compared the distribution of fintech firms by business model in our sample to that of the population. Table A1 of the Supplementary Material reports the breakdown of firms across payment and nonpayment fintech categories and shows that our sample closely mirrors the population distribution, capturing a substantial share of firms in each segment.
III. Empirical Analysis and Methodology
A. Identification Strategy
To identify the causal impact of open banking regulation on fintech firms, we exploit the implementation of the European PSD2 directive as a quasi-natural experiment. Our identification strategy rests on the premise that fintech firms focused on payment services were differentially exposed to this policy intervention compared to firms whose business models do not involve payment processing or access to payment accounts.Footnote 14
Consequently, treated firms are fintech firms classified as payment service providers in the FinTech Radar. In our panel data set, 50 of 423 fintech firms operating in Spain between 2014 and 2022 fall into this category. These payment services fintechs include nine companies registered with the corresponding licenses as TPPs: three AISPs and six PISPs. The remaining payment fintechs identified by the FinTech Radar as payment services providers are EMIs, electronic wallets, payment gateways, and mobile payments companies. While these firms are not explicitly licensed as TPPs, they were functionally affected by the regulation since PSD2 had broad implications for their operations and strategy. EMIs, though not TPPs, are licensed PSPs authorized to issue electronic money and provide payment services. They are therefore subject to key PSD2 provisions, including SCA and RTS. E-wallets, though they do not issue money themselves, facilitate payment transactions with preloaded or linked funds and often integrate bank transfers and data aggregation. Payment gateways, though they do not initiate payments, act as intermediaries between merchants and acquiring banks, securely routing data and implementing SCA protocols. Mobile payment providers have evolved into multifunctional platforms, offering digital wallets, account-to-account transfers, and PISP/AISP services. Consequently, e-wallets, payment gateways, and mobile payment providers were de facto affected by PSD2. Operating within the payment value chain and relying on licensed partners (EMIs or TPPs), they had to integrate SCA-compliant checkout flows, protocols, and APIs, thus experiencing significant technological and strategic adjustments.Footnote 15
By contrast, our control group consists of 373 fintech firms whose business models lie outside the functional and legal scope of PSD2. According to the FinTech Radar, these firms are classified as nonpayment services fintech. These include fintechs offering financial software and infrastructure, personal finance, financial advisory services, media and information, real estate, asset management, digital identity, robo-advisory, and social trading. Unlike payment services providers, these fintech firms do not provide or process payment transactions, nor do they require access to customers’ payment accounts or bank data to operate. Their core services are built on diverse types of data (e.g., market prices, user-input preferences, public information) and operate under distinct regulatory frameworks that do not fall within the scope of PSD2. While some of these firms could, in principle, benefit indirectly from the reduction of information asymmetries caused by increased data in the financial ecosystem, PSD2 neither mandates nor facilitates data access or interoperability for these categories. Moreover, there are no obligations under PSD2 that apply to their activities in terms of licensing, authentication, or API integration. Thus, the regulatory and operational exposure of these firms differs substantially from that of payment services providers, reinforcing their suitability as a control group. We complement this classification with additional analyses (see Section VI), which confirm that these firms did not experience changes in outcomes attributable to the implementation of PSD2.
B. Difference-in-Differences (DiD) Analysis
To address our research question, we employ a difference-in-differences (DiD) specification. Specifically, the DiD approach compares changes in outcomes between treated (payment services fintech) and control (nonpayment services fintech) fintech firms before and after the implementation of PSD2. To conduct our empirical analysis and to ensure a balanced period with an equal number of years before and after the implementation of PSD2, we focus on the period from 2014 to 2022. Following standard practice in the literature, we use a two-way fixed effects estimator that includes firm and year fixed effects, as shown in equation (1):

where
$ {y}_{i,t} $
 represents the dependent variable for firm i in period t. As indicated before, we focus on two main sets of outcomes: fintech dynamics and funding structure.
First, regarding fintech dynamics, we consider variables that measure the performance, growth, investment, labor intensity, and productivity of fintech firms. To measure performance, we employ a set of variables: return on assets (ROA), return on equity (ROE), operating ROA (EBIT to total assets), EBITDA ROA, ordinary net profits to total assets, and a dummy variable indicating whether profits exceeded the average profits of the preceding 3 years (High-Profit). Growth dynamics are proxied by the annual growth rate of the fintech’s assets (∆Assets) and capital (∆capital). We examine the impact of open banking on firms’ investment decisions by distinguishing between different types of investments: tangible assets (%Tangible assets), intangible assets (%Intangible assets), and financial investments (%Financial Investments). Additionally, we incorporate a liquidity ratio (%Current assets). We further investigate PSD2’s impact on fintech dynamics in terms of labor intensity (∆#Employees), labor costs (Labor costs), share of permanent employees (%Permanent employees), and firms’ productivity (Productivity). All the variables are defined in Table B1 of the Supplementary Material.
Second, we analyze the impact of open banking on fintech firms’ funding. In doing so, we distinguish between traditional debt funding and alternative equity market funding. The debt funding structure of fintech firms is captured by the ratio of bank debt (nonbank debt) to total liabilities—defined here as financial obligations excluding equity—(Bank debt_liab and Nonbank debt_liab) and total assets (Bank debt_assets and Nonbank debt_assets). By scaling our measures by assets and liabilities, we ensure that the results are not driven by substantial changes in firms’ balance sheet structures. Moreover, we also distinguish between long-term and short-term debt. We also compute the cost of debt funding (Debt cost)—defined as the ratio of interest on borrowed funds to total debt—and Interest burden, which is calculated as the ratio of interest on borrowed funds to the sum of gross operating profits and financial revenues.
Finally, we also examine fintechs’ access to alternative equity market funding (e.g., seed capital, venture capital, or Series A funding). This is relevant because evidence from media reports suggests that the adoption of open banking has attracted significant investment to payment-focused fintech firms.Footnote 16 Moreover, Dealroom.co reports that European payment fintech firms raised €29.7 billion between 2018 and 2024, making them the largest subsector within the fintech ecosystem. Figure A4 of the Supplementary Material illustrates that after open banking was introduced in 2018, a significantly higher proportion of alternative funding went to payment fintechs, with their share reaching almost 40% of all fintech funding in 2020. This trend is also observed in other jurisdictions that have implemented open banking.Footnote 17
To examine access to alternative market funding, it is essential to recognize that this type of equity funding exhibits cyclical behavior. Fintech companies do not receive market funding on a consistent annual basis. Typically, they secure funding in phases, often aligning with major milestones such as product launches, regulatory changes, or significant market traction. These phases are characterized by periods of intense funding activity followed by quieter intervals. Using Dealroom.co data, we observe that only 18.56% of fintech companies received funding two or more times within the same calendar year. On average, funding rounds for fintech are separated by approximately 14.89 months. Therefore, the total funding obtained in a given year may depend on the amounts secured in previous years. To account for this variability, and also in line with prior literature (Conti, Dass, Di Lorenzo, and Graham (Reference Conti, Dass, Di Lorenzo and Graham2019), Conti and Graham (Reference Conti and Graham2020), and Ralcheva and Roosenboom (Reference Ralcheva and Roosenboom2020)), we consider a rolling window to compute total market funding. Specifically, we include the current year and the 3 preceding years.
To examine the impact of open banking on equity funding, we employ several dependent variables, including the cumulative funding obtained in the current year and the 3 previous years (funding volume). To account for the intensive and extensive margin, following Davis, Haltiwanger, and Schuh (Reference Davis, Haltiwanger and Schuh1996) and Haltiwanger, Jarmin, and Miranda (Reference Haltiwanger, Jarmin and Miranda2012), we compute the symmetric growth rate
$ \left(\frac{x_t-{x}_{t-1}}{x_t+{x}_{t-1}}\right) $
 of cumulative funding over firms’ equity (∆Funding_equity). This measure, bounded between −1 and +1, mitigates the distortions of normal growth rates while capturing the magnitude of alternative funding received relative to firms’ equity. We also compute the standard deviation of the funding obtained within this same period (SD_Funding). Finally, to capture investors’ attention, we consider the total number of investors participating in firm i in year t (#Investors), a dummy variable equal to 1 if firm i received alternative equity funding for the first time in year t (First_Funding), and the time elapsed between consecutive equity funding rounds (Funding_Interval).
$ {X}_{i,t-1} $
 includes a set of fintech-level controls. All the independent financial variables are lagged by one period to avoid endogeneity concerns. Fintech size, which is measured using the natural logarithm of total assets, will capture scale effects and access to resources. Asset structure, computed as the ratio of current assets to total assets, controls for the composition of firms’ balance sheets and the relative weight of liquid versus fixed assets, reflecting their operational flexibility and short-term investment orientation. Solvency, which is measured as the ratio of total equity to total assets, controls the financial robustness and internal funding capacity of firms. We also consider a measure of fintech efficiency, using the ratio of operating revenues to the total sum of equity and noncurrent liabilities, to capture the firm’s ability to generate income relative to its long-term funding structure. Liquidity, measured as current assets to current liabilities, controls for short-term financial flexibility and the firm’s capacity to meet immediate obligations. Finally, we consider the age of the fintech firm as the number of years since the firm’s founding to account for lifecycle differences and experience effects among firms. All the accounting variables are winsorized to the minimum and maximum values at the 1st and 99th percentiles, respectively, to avoid biases arising from outliers or potential misreporting of accounting information.
Post-PSD2
t × Payment FinTech
i is our variable of interest. It is the interaction of Payment FinTech
i a dummy that takes the value 1 if the fintech is treated, and 0 otherwise, and Post-PSD2
t, a dummy that takes the value 1 for 2018 and subsequent years, following the implementation of PSD2, and 0 for earlier years. This interaction is therefore our DiD term, and the estimation of
$ {\beta}_1 $
 will capture the causal effect of the treatment on the outcome. Standard errors are clustered at the firm level.
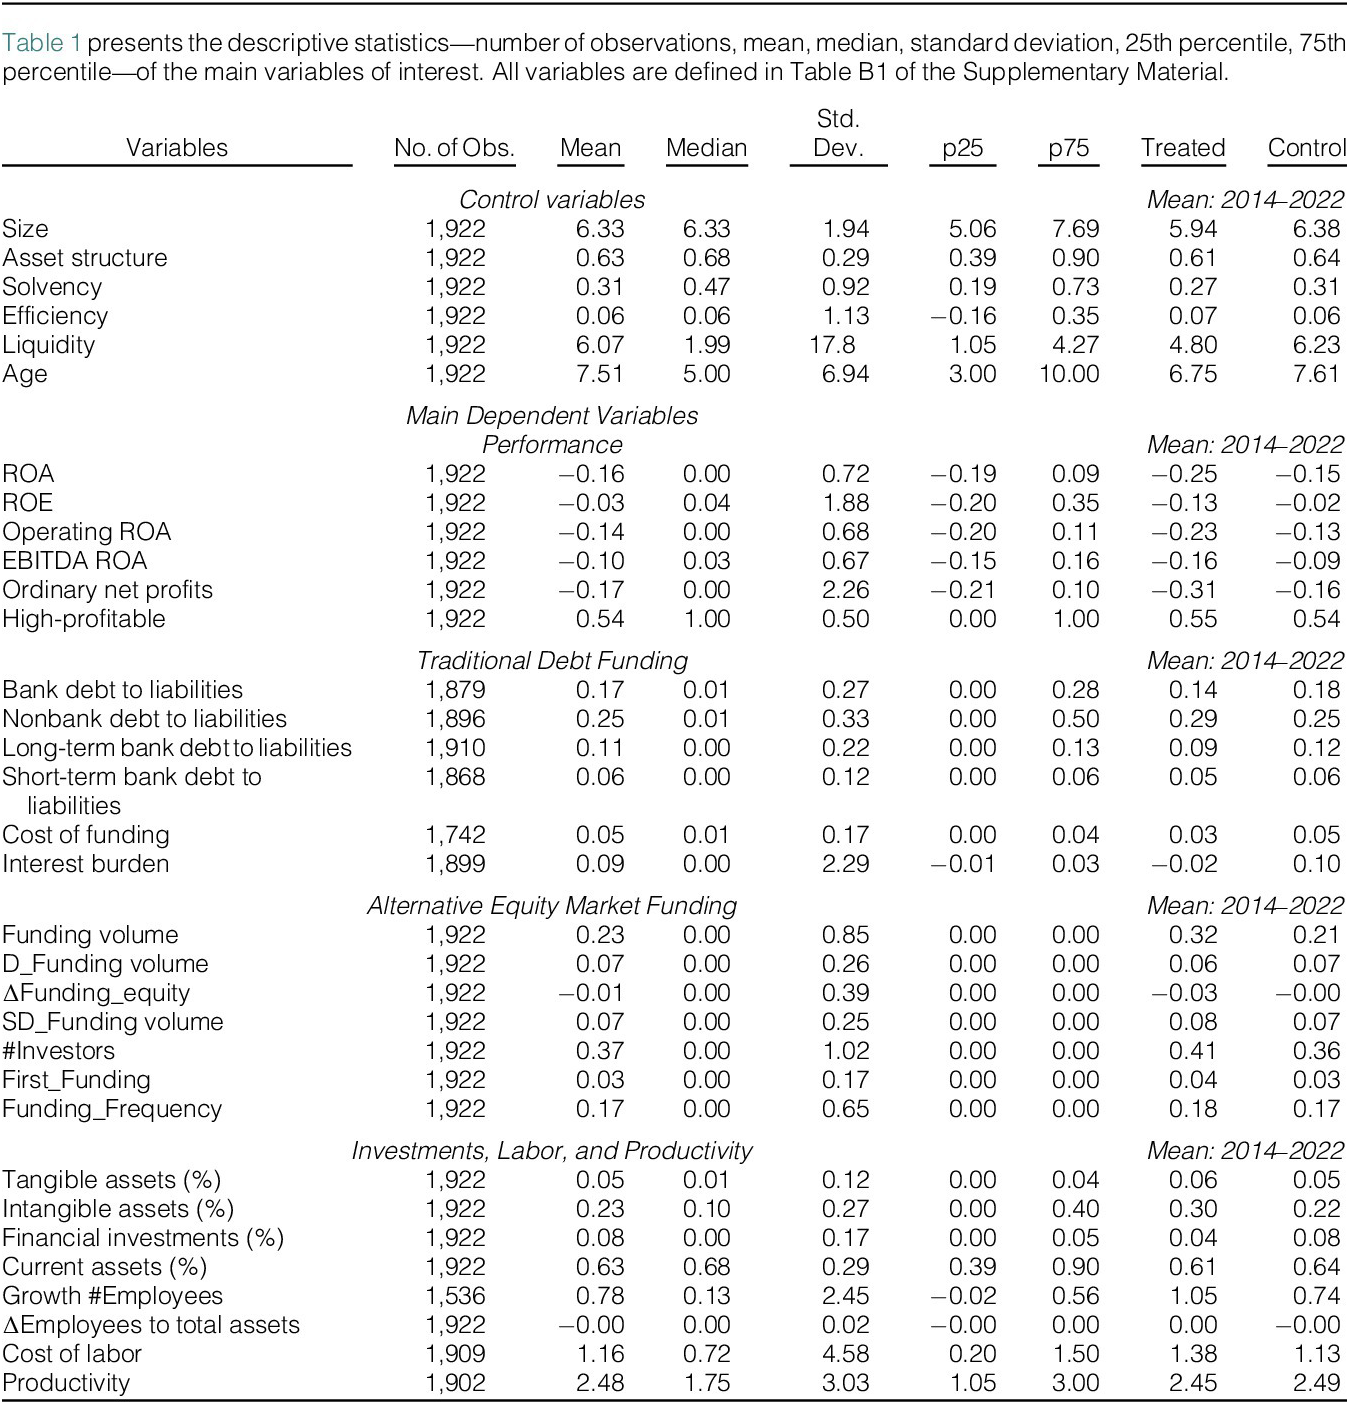
Table 1 reports summary statistics for the key dependent and control variables for treated and control firms,Footnote 18 while Table A2 of the Supplementary Material presents the number of treated and control firms per year, with the percentage of treated firms remaining constant at around 11%.

TABLE 1 Long description
The table contains 9 columns: Variables, Number of Observations, Mean, Median, Standard Deviation, p 25, p 75, Treated Mean (2014 to 2022), and Control Mean (2014 to 2022).
* Control variables (1,922 observations):
- Size: Mean 6.33, Median 6.33, Std. Dev. 1.94.
- Asset structure: Mean 0.63, Median 0.68, Std. Dev. 0.29.
- Solvency: Mean 0.31, Median 0.47, Std. Dev. 0.92.
- Efficiency: Mean 0.06, Median 0.06, Std. Dev. 1.13.
- Liquidity: Mean 6.07, Median 1.99, Std. Dev. 17.8.
- Age: Mean 7.51, Median 5.00, Std. Dev. 6.94.
* Performance (Main dependent variables, 1,922 observations):
- R O A: Mean minus 0.16, Median 0.00, Std. Dev. 0.72.
- R O E: Mean minus 0.03, Median 0.04, Std. Dev. 1.88.
- Operating R O A: Mean minus 0.14, Median 0.00, Std. Dev. 0.68.
- E B I T D A R O A: Mean minus 0.10, Median 0.03, Std. Dev. 0.67.
- Ordinary net profits: Mean minus 0.17, Median 0.00, Std. Dev. 2.26.
- High-profitable: Mean 0.54, Median 1.00, Std. Dev. 0.50.
* Traditional debt funding:
- Bank debt to liabilities (1,879 obs): Mean 0.17, Median 0.01.
- Nonbank debt to liabilities (1,896 obs): Mean 0.25, Median 0.01.
- Long-term bank debt to liabilities (1,910 obs): Mean 0.11, Median 0.00.
- Short-term bank debt to liabilities (1,868 obs): Mean 0.06, Median 0.00.
- Cost of funding (1,742 obs): Mean 0.05, Median 0.01.
- Interest burden (1,899 obs): Mean 0.09, Median 0.00.
* Alternative equity market funding (1,922 observations):
- Funding volume: Mean 0.23, Median 0.00.
- D underscore Funding volume: Mean 0.07, Median 0.00.
- Delta Funding underscore equity: Mean minus 0.01, Median 0.00.
- S D underscore Funding volume: Mean 0.07, Median 0.00.
- Number of Investors: Mean 0.37, Median 0.00.
- First underscore Funding: Mean 0.03, Median 0.00.
- Funding underscore Frequency: Mean 0.17, Median 0.00.
* Investments, labor, and productivity:
- Tangible assets percentage: Mean 0.05, Median 0.01.
- Intangible assets percentage: Mean 0.23, Median 0.10.
- Financial investments percentage: Mean 0.08, Median 0.00.
- Current assets percentage: Mean 0.63, Median 0.68.
- Growth Number of Employees (1,536 obs): Mean 0.78, Median 0.13.
- Delta Employees to total assets: Mean minus 0.00, Median 0.00.
- Cost of labor (1,909 obs): Mean 1.16, Median 0.72.
- Productivity (1,902 obs): Mean 2.48, Median 1.75.
C. Parallel Trends
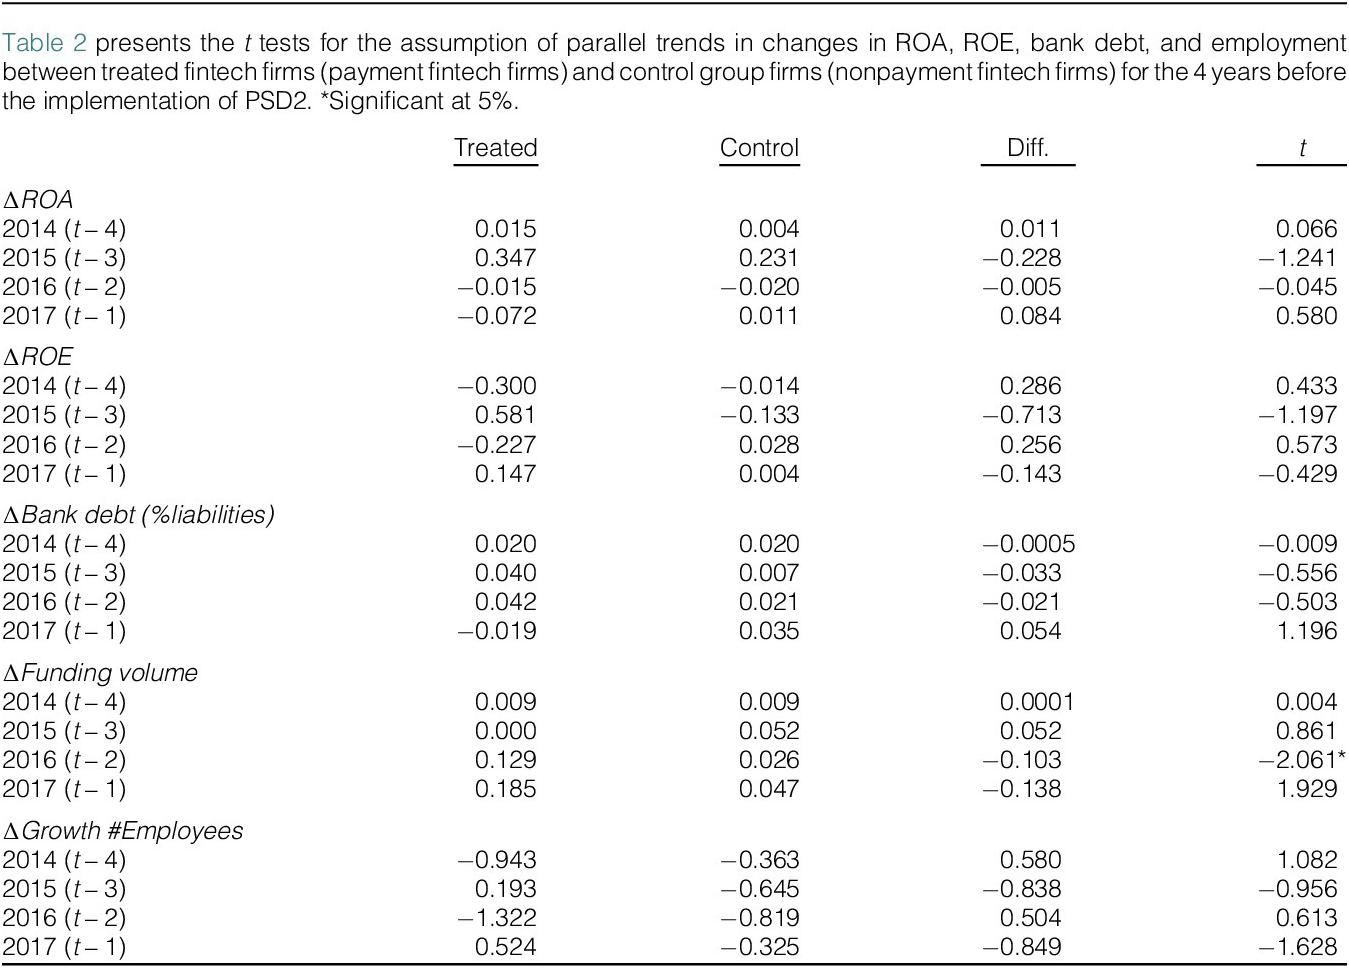
To establish the validity of the DiD analysis, we check whether the treated group and the control group exhibit similar trends in outcomes prior to the implementation of open banking. Following Lemmon and Roberts (Reference Lemmon and Roberts2010) and Calderon and Schaeck (Reference Calderon and Schaeck2016), and as is standard in the DiD literature, we test the parallel trends assumption by examining whether changes in the outcome variables are similar across the two groups of firms before the implementation of the treatment. Table 2 presents the t-test results for the differences in means between the treatment and control groups over the 4 years prior to PSD2 implementation in terms of performance (ROA and ROE), funding (bank debt and alternative equity market funding), and employment.Footnote 19 All t-test results are insignificant at the conventional value of 5%. Thus, the parallel trends assumption holds. This result indicates that, in the absence of treatment, changes in the outcome variables are similar for the two groups of fintech firms.

TABLE 2 Long description
The table contains five sections, each with columns for Treated, Control, Diff. (Difference), and t (t-statistic).
1. Delta R O A (Return on Assets):
- 2014: Treated 0.015, Control 0.004, Diff. 0.011, t 0.066.
- 2015: Treated 0.347, Control 0.231, Diff. minus 0.228, t minus 1.241.
- 2016: Treated minus 0.015, Control minus 0.020, Diff. minus 0.005, t minus 0.045.
- 2017: Treated minus 0.072, Control 0.011, Diff. 0.084, t 0.580.
2. Delta R O E (Return on Equity):
- 2014: Treated minus 0.300, Control minus 0.014, Diff. 0.286, t 0.433.
- 2015: Treated 0.581, Control minus 0.133, Diff. minus 0.713, t minus 1.197.
- 2016: Treated minus 0.227, Control 0.028, Diff. 0.256, t 0.573.
- 2017: Treated 0.147, Control 0.004, Diff. minus 0.143, t minus 0.429.
3. Delta Bank debt (percentage of liabilities):
- 2014: Treated 0.020, Control 0.020, Diff. minus 0.0005, t minus 0.009.
- 2015: Treated 0.040, Control 0.007, Diff. minus 0.033, t minus 0.556.
- 2016: Treated 0.042, Control 0.021, Diff. minus 0.021, t minus 0.503.
- 2017: Treated minus 0.019, Control 0.035, Diff. 0.054, t 1.196.
4. Delta Funding volume:
- 2014: Treated 0.009, Control 0.009, Diff. 0.0001, t 0.004.
- 2015: Treated 0.000, Control 0.052, Diff. 0.052, t 0.861.
- 2016: Treated 0.129, Control 0.026, Diff. minus 0.103, t minus 2.061 (significant at 5 percent).
- 2017: Treated 0.185, Control 0.047, Diff. minus 0.138, t 1.929.
5. Delta Growth number of Employees:
- 2014: Treated minus 0.943, Control minus 0.363, Diff. 0.580, t 1.082.
- 2015: Treated 0.193, Control minus 0.645, Diff. minus 0.838, t minus 0.956.
- 2016: Treated minus 1.322, Control minus 0.819, Diff. 0.504, t 0.613.
- 2017: Treated 0.524, Control minus 0.325, Diff. minus 0.849, t minus 1.628.
In addition to the t test, we conduct an event study to check for pretrends in the main outcome variables. Figures A1–A3 of the Supplementary Material plot the dynamic DiD estimates for performance (ROA and operating ROA), debt funding (bank and long-term bank debt), and alternative equity funding (growth rate and total volume). Across all specifications, the coefficients in the pretreatment period are close to zero and statistically insignificant, confirming the absence of pretrends and supporting the validity of the parallel trends assumption. The only exception is a slight decline in bank and long-term bank debt 1 year prior to PSD2, which, though not statistically significant, may indicate an anticipation effect in the substitution of fintechs’ funding structures.Footnote 20 While the post-treatment coefficients are discussed in detail in Section VI.C, it is reasonable to observe that the slight decline in the coefficient at t = 2 (year 2020) for performance and alternative equity market funding can be explained by the COVID-19 crisis, which temporarily reduced investment activity and profitability across the fintech sector. Subsequently, at t = 3 (year 2021), both coefficients increased again as the global economic environment improved and financial markets stabilized. For bank debt and long-term bank debt, the coefficients remain negative and stable after the implementation of PSD2, consistent with the substitution of bank financing by market-based and equity funding sources.
IV. Baseline Results
A. Fintech Firm Dynamics
1. Performance and Growth Dynamics
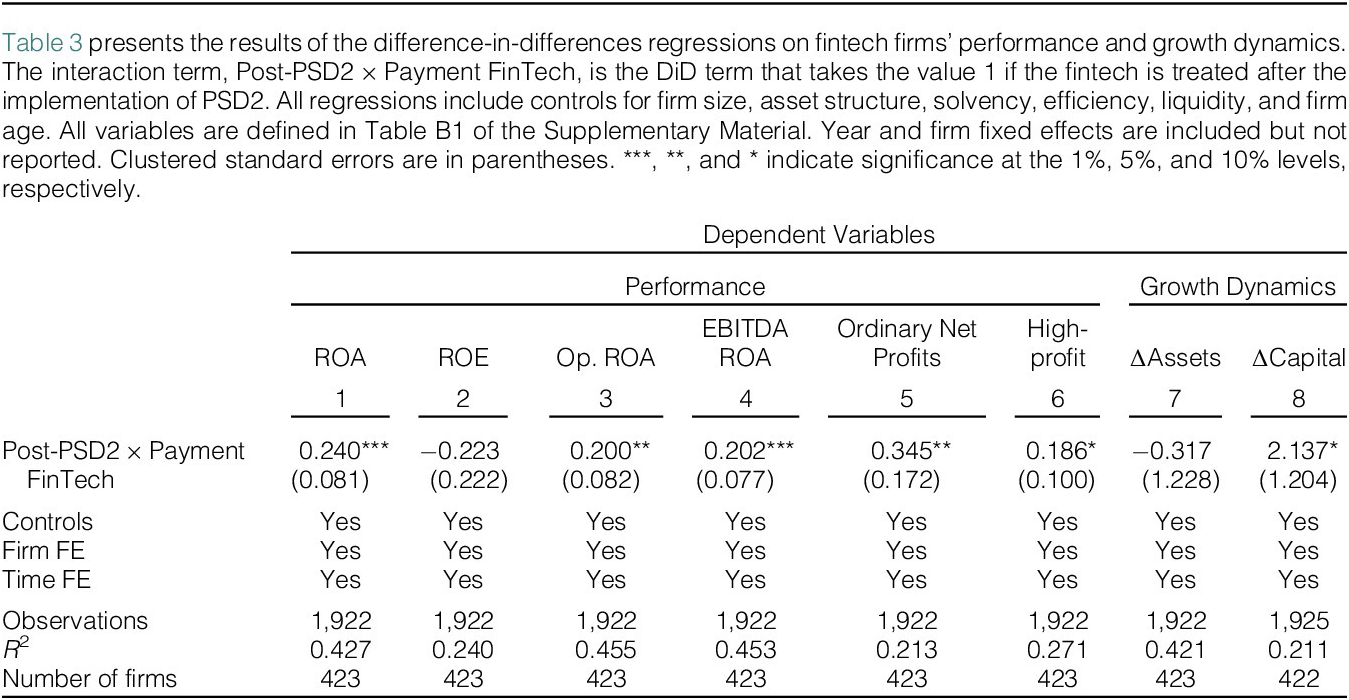
Table 3 presents the results of the baseline regression for performance (columns 1–6) and growth (columns 7 and 8). The adoption of the open banking framework led to improvements in profitability for payment services fintechs. ROA, operating ROA, and EBITDA ROA are all positive and statistically significant, suggesting that the open banking regulation enhanced operating performance. The profit dummy also becomes significantly positive, meaning that treated firms are more likely to report profits above their 3-year historical average. On average, treated firms exhibit a 24-percentage point increase in ROA after the implementation of open banking compared to control fintech firms. This effect is also economically large, as it corresponds to a roughly 150% change relative to the mean ROA over the sample period. It is important to interpret this magnitude in context. Most fintechs in the sample are young and unprofitable, consistent with their startup nature, which makes profitability measures more volatile for these firms than for mature financial institutions. Against this backdrop, the large treatment effect should be understood as reflecting both the structural unprofitability of early-stage fintechs and the strong impact of regulatory change on their business models, rather than as an isolated shift in operating performance.

TABLE 3 Long description
The table is divided into two main categories: Performance (columns 1 to 6) and Growth Dynamics (columns 7 and 8).
Dependent variables for each column are:
1. R O A
2. R O E
3. Op. R O A
4. E B I T D A R O A
5. Ordinary net profits
6. High-profit
7. Delta Assets
8. Delta Capital
The primary independent variable is the interaction term Post-P S D 2 times Payment FinTech. Its coefficients and standard errors (in parentheses) are:
1. 0.240*** (0.081)
2. -0.223 (0.222)
3. 0.200** (0.082)
4. 0.202*** (0.077)
5. 0.345** (0.172)
6. 0.186* (0.100)
7. -0.317 (1.228)
8. 2.137* (1.204)
All models include Controls, Firm F E, and Time F E (all marked Yes).
Summary statistics:
* Observations: 1,922 for columns 1-7; 1,925 for column 8.
* R-squared values range from 0.211 to 0.455.
* Number of firms: 423 for columns 1-7; 422 for column 8.
Asterisks indicate significance levels: *** for 1 percent, ** for 5 percent, and * for 10 percent.
Moreover, this effect on performance is not driven by a change in firms’ assets (column 7), which could artificially inflate ROA even if profits remained unchanged. However, column 2 (ROE) of Table 3 shows no significant effect of PSD2 on ROE. This finding should be interpreted together with the results regarding the growth in firms’ capital. Column 8 of Table 3 shows that treated fintech firms experienced a larger growth in equity compared to control firms. Consequently, any gains in profitability are offset by increases in equity, leaving ROE unchanged. Since we do not observe a significant increase in total assets but do observe growth in equity, this suggests a shift in capital structure toward greater reliance on equity financing rather than balance sheet expansion.Footnote 21
2. Investments, Labor Intensity, and Productivity
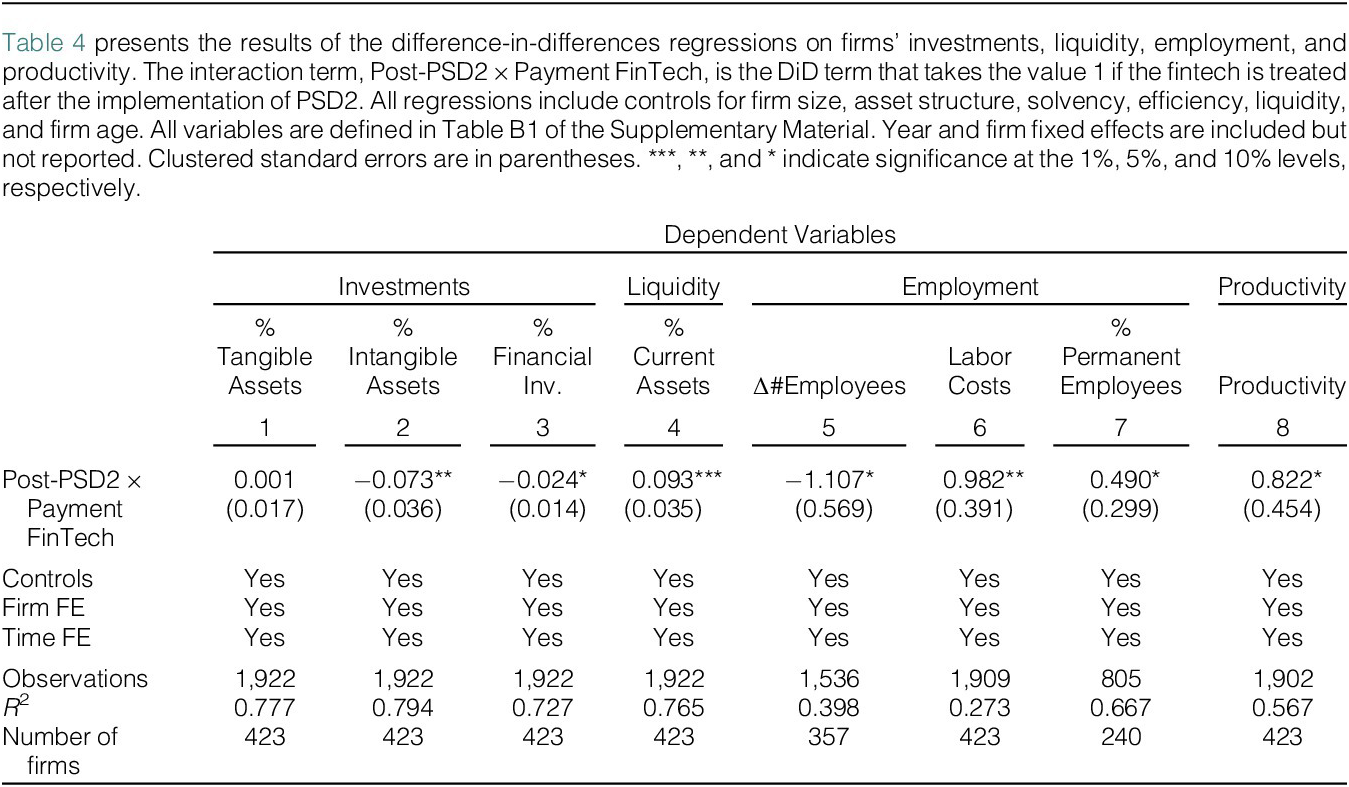
Table 4 shows that payment services fintechs invest less in intangibles (column 2) and financial assets (column 3). The reduced investment in intangible and financial assets suggests that payment services firms may be prioritizing liquidity over long-term investments. This result is consistent with the larger increase in the share of current (more liquid) assets among payment service firms, as shown in column 4. Overall, this finding suggests that treated fintech firms are not using their profits for large investments and may instead be engaging in liquidity hoarding.

TABLE 4 Long description
The table consists of 8 columns representing different dependent variables.
Headers and Dependent Variables:
* Columns 1 to 3 (Investments): percent Tangible assets, percent Intangible assets, and percent Financial investments.
* Column 4 (Liquidity): percent Current assets.
* Columns 5 to 7 (Employment): change in number of Employees, Labor costs, and percent Permanent employees.
* Column 8 (Productivity): Productivity.
Key Results for the interaction term Post-P S D 2 times Payment FinTech:
* Investments: percent Tangible assets is 0.001 (0.017); percent Intangible assets is minus 0.073 (0.036) significant at 5 percent; percent Financial investments is minus 0.024 (0.014) significant at 10 percent.
* Liquidity: percent Current assets is 0.093 (0.035) significant at 1 percent.
* Employment: change in number of Employees is minus 1.107 (0.569) significant at 10 percent; Labor costs is 0.982 (0.391) significant at 5 percent; percent Permanent employees is 0.490 (0.299) significant at 10 percent.
* Productivity: 0.822 (0.454) significant at 10 percent.
Model Statistics:
* All models include Controls, Firm F E, and Time F E (all marked Yes).
* Observations range from 805 to 1,922.
* R-squared values range from 0.273 to 0.794.
* Number of firms ranges from 240 to 423.
Regarding the impact on labor demand, Table 4 shows that payment services fintechs exhibit lower growth rates of total employees (column 5). However, they have increased their labor costs (column 6). This finding suggests a shift from low-skill to high-skill labor, with the latter being inherently more expensive, because of the need for specialized skills in technology development, data analysis, and regulatory compliance. Furthermore, when examining changes in workforce composition (column 7), we find that payment services fintechs exhibit a higher ratio of permanent to nonpermanent employees after the adoption of open banking.Footnote 22 A higher share of permanent contracts typically signals a shift toward more qualified, specialized, and stable positions, consistent with the idea that post-PSD2 payment fintechs increasingly rely on skilled labor. Finally, these treated firms exhibit higher productivity (column 8), which also reflects the effective utilization of specialized, highly skilled labor.
B. Funding Structure
1. Traditional Debt Funding
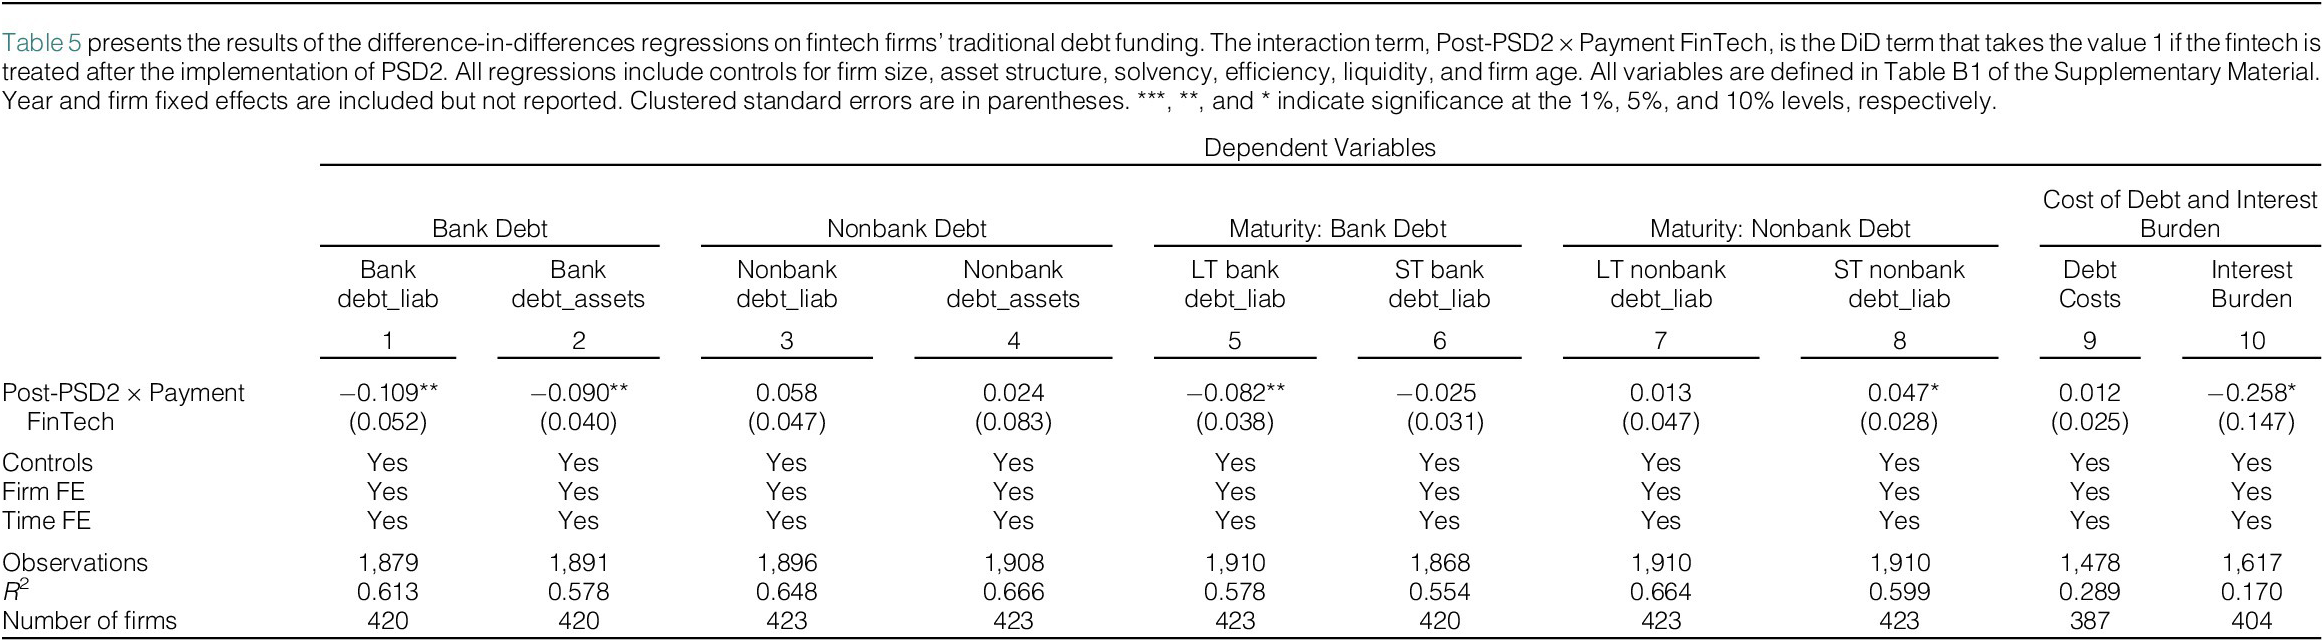
To examine the effect on debt funding, we use a sequential approach. First, we explore treated fintech firms’ use of bank and nonbank debt (e.g., trade credit, bonds, and government loans). After the implementation of the open banking framework, payment services fintechs rely less on bank debt compared to other fintech firms (columns 1 and 2 of Table 5 that report the effects of PSD2 on fintech firms’ debt funding structure). On average, post-PSD2 treated firms show a 10.9-percentage point reduction in bank debt relative to total liabilities compared to the control group. This effect is economically large, corresponding to a decline of roughly 64.1% relative to the sample mean of bank debt to total liabilities, and highlights that PSD2 was associated with a shift away from bank financing. However, as shown in columns 3 and 4, the negative effect on bank debt is not offset by an increase in nonbank debt. Taken together, these findings suggest a shift toward alternative financing strategies, such as internal funding or equity financing, rather than increased reliance on nonbank debt.

TABLE 5 Long description
The table presents results across 10 columns categorized into five main groups: Bank debt (1-2), Nonbank debt (3-4), Maturity: Bank debt (5-6), Maturity: Nonbank debt (7-8), and Cost of debt and interest burden (9-10).
Key findings for the interaction term Post-P S D 2 times Payment FinTech:
* Bank debt: Significant negative coefficients of -0.109 (column 1) and -0.090 (column 2) at the 5 percent level.
* Nonbank debt: Positive but statistically insignificant coefficients of 0.058 and 0.024.
* Maturity: A significant negative effect on Long-Term (L T) bank debt (-0.082 at 5 percent level) and a significant positive effect on Short-Term (S T) nonbank debt (0.047 at 10 percent level).
* Costs: A significant negative effect on Interest burden (-0.258 at 10 percent level).
Model Statistics:
* Controls, Firm F E, and Time F E are included (Yes) for all models.
* Observations range from 1,478 to 1,910.
* R-squared values range from 0.170 to 0.666.
* Number of firms ranges from 387 to 423.
We also explore the maturity of the debt and the cost of funding.Footnote 23 The effect on bank debt seems to be driven by payment services fintechs relying less than other fintechs on long-term bank debt after PSD2 implementation (column 5). On average, treated firms exhibit an 8.2 percentage point decrease in long-term bank debt. Taken together with the result for total bank debt in column 1, this finding suggests that the overall decline in bank financing is driven primarily by reductions in long-term bank debt, which does not appear to be compensated for by an increase in short-term bank debt (column 6). Moreover, we observe an increase in short-term nonbank debt (column 8), suggesting that payment services fintechs may have partly replaced long-term bank financing with more flexible borrowing, such as trade credit, factoring, or short-term private loans from nonbank sources.
Finally, we also examine the impact of the open banking framework on the cost of funding and interest burden. The cost of bank funding does not seem to be affected by the open banking framework (column 9), with payment services fintechs experiencing neither an increase nor a decrease in the financial costs (interest paid) of their debt compared to the control group. However, there is a decline in the interest burden of the treated fintech firms (column 10), suggesting that after the implementation of the open banking regulation, payment services fintechs exhibit better financial health and reduced financial risk compared to other fintech firms.Footnote 24
2. Alternative Equity Market Funding
The results presented in Section IV.B.1 suggest that the implementation of the open banking framework has led payment services fintechs to a shift toward alternative financing strategies, such as equity financing.
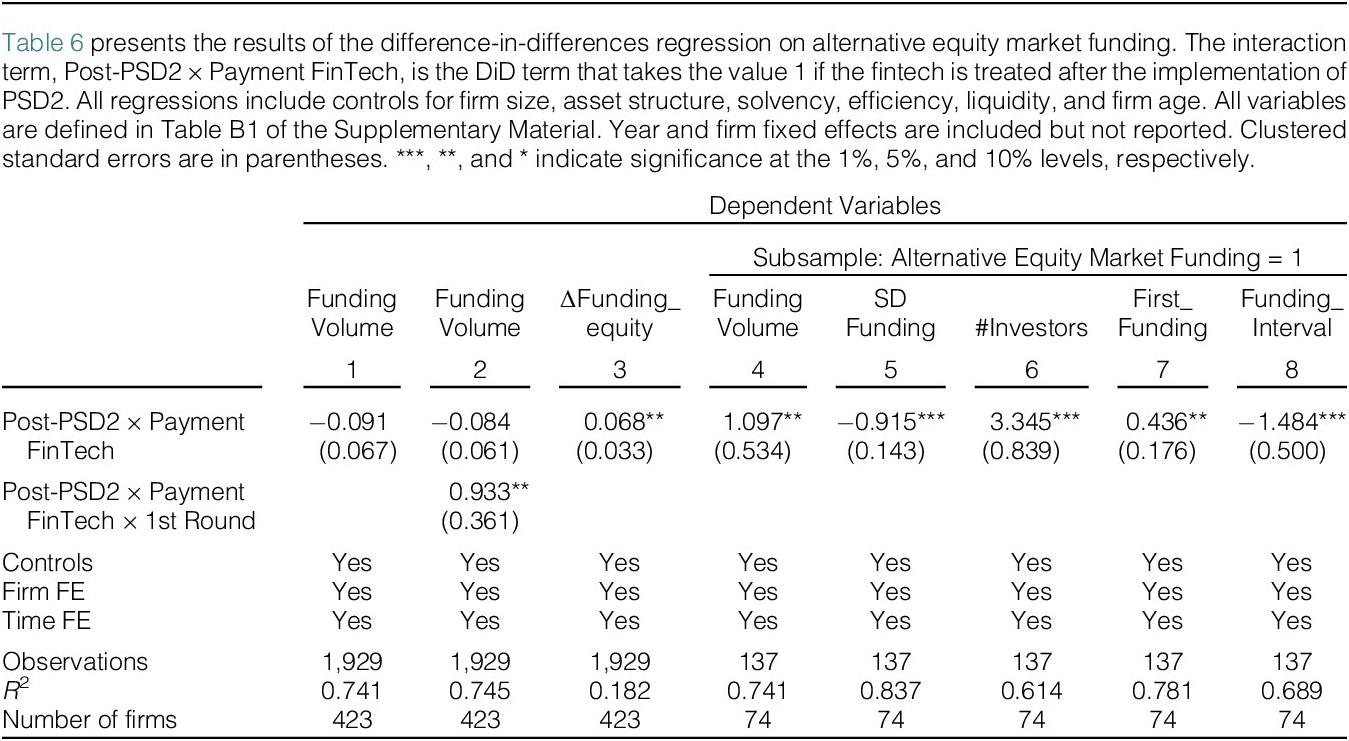
Table 6 presents the results on alternative equity market funding. While column 1 shows no differences in the total volume of alternative equity financing between treated and control fintechs, column 2 shows that payment services fintechs raising equity funds for the first time after PSD2 obtain significantly larger amounts, suggesting that the open banking framework may have acted as a catalyst for attracting investors to new entrants. For most of these firms, accessing alternative equity financing represents a new and critical step in their growth. In this sense, the benefits of open banking may be more pronounced for younger payment services fintechs entering the funding market for the first time than for established players. Using the Davis et al. (Reference Davis, Haltiwanger and Schuh1996) and Haltiwanger et al. (Reference Haltiwanger, Jarmin and Miranda2012) symmetric growth rate of cumulative funding scaled by firms’ equity (column 3), we find that payment services fintechs exhibit a higher growth rate in equity funding amounts after PSD2, suggesting that these firms were able to expand their access to external equity financing at a faster pace relative to the control group.

TABLE 6 Long description
The table presents difference-in-differences regression results across 8 columns.
Header Row 1: Columns 4 through 8 are grouped under the subsample Alternative equity market funding equals 1.
Header Row 2: Column numbers 1 through 8.
Header Row 3: Dependent variables are Funding volume for columns 1, 2, and 4; Delta Funding_equity for column 3; S D funding for column 5; #Investors for column 6; First_Funding for column 7; and Funding_Interval for column 8.
Row: Post-P S D 2 times Payment FinTech
- Column 1: -0.091 (0.067)
- Column 2: -0.084 (0.061)
- Column 3: 0.068** (0.033)
- Column 4: 1.097** (0.534)
- Column 5: -0.915*** (0.143)
- Column 6: 3.345*** (0.839)
- Column 7: 0.436** (0.176)
- Column 8: -1.484*** (0.500)
Row: Post-P S D 2 times Payment FinTech times 1st Round
- Column 2: 0.933** (0.361)
- All other columns are blank for this interaction.
Model Specifications:
- Controls, Firm F E, and Time F E are marked as Yes for all 8 columns.
- Observations: 1,929 for columns 1-3; 137 for columns 4-8.
- R-squared: Ranges from 0.182 (column 3) to 0.837 (column 5).
- Number of firms: 423 for columns 1-3; 74 for columns 4-8.
Asterisks indicate significance levels: *** for 1 percent, ** for 5 percent, and * for 10 percent.
Furthermore, we also rerun our models on the subsample of fintech firms that have obtained funding in a given year (equity-market-funded fintech firms). Within this group, payment services fintechs raise larger funding amounts (column 4) and exhibit more stable funding (column 5). This finding is important, as greater funding stability enables these firms to plan more effectively and reduces uncertainty that may otherwise deter investment, thereby supporting a smoother funding trajectory.
Payment fintech firms attract more investors per round on average (column 6), pointing to a broadening of their investor base and heightened visibility in the market. Column 7 shows that payment fintechs have a higher likelihood of being first-time fundraisers among equity-market-funded fintech firms. Finally, column 8 shows that the time between consecutive funding rounds shortened significantly for treated firms, consistent with an acceleration of their funding cycles and with more regular access to alternative equity financing.Footnote 25
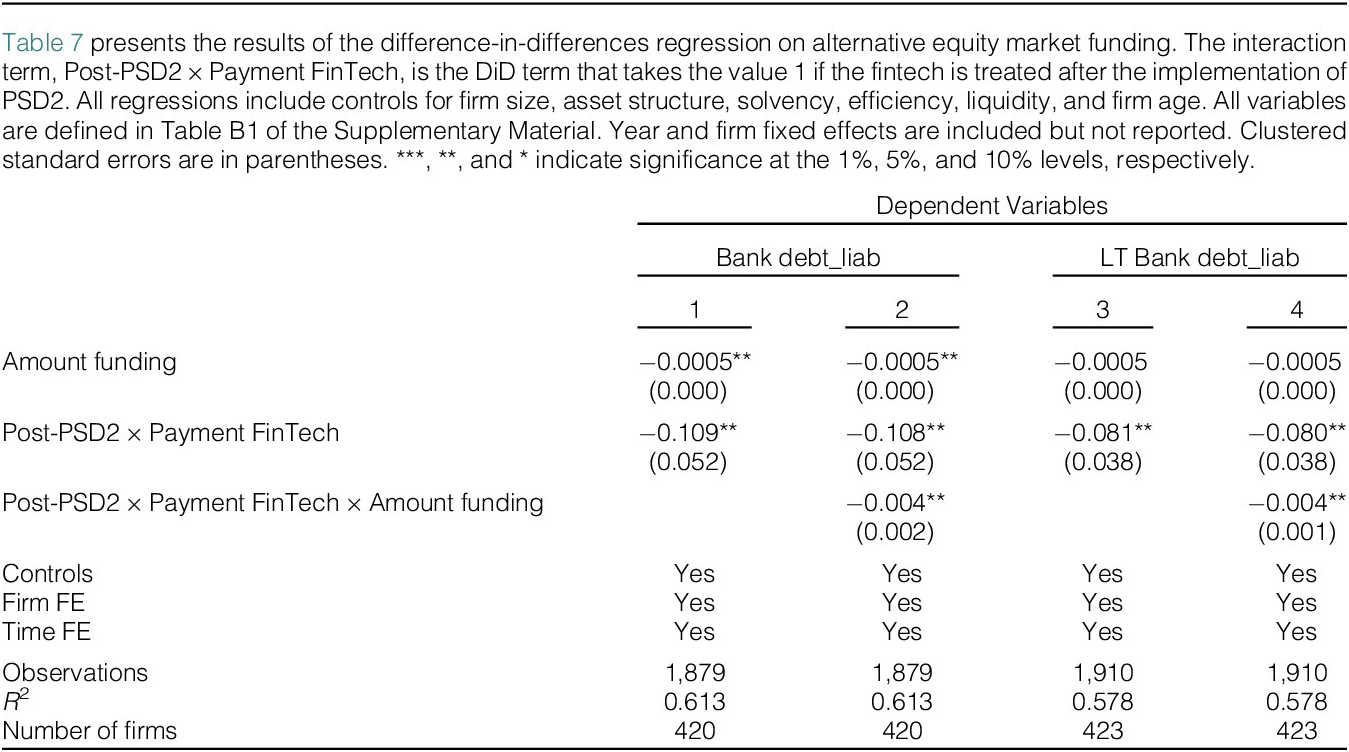
Moreover, in Table 7, we examine whether the alternative equity funding received is larger for those firms that have reduced bank debt, particularly long-term bank debt, more intensively. The three-way interaction (Post-PSD2 × Payment FinTech × Amount Funding) indicates that the substitution away from bank financing is more pronounced among firms raising more equity funding. This pattern is consistent with payment fintech firms rebalancing their funding structure by increasingly relying on venture capital, private equity, and other alternative investors to finance growth, rather than maintaining relationships with banks for long-term credit.

TABLE 7 Long description
A statistical table with four columns of results. The first two columns measure Bank debt_liab and the last two measure L T Bank debt_liab.
* Amount funding: -0.0005 (significant at 5 percent) for columns 1 and 2; -0.0005 (not significant) for columns 3 and 4.
* Post-P S D 2 times Payment FinTech: -0.109 (significant at 5 percent) in column 1; -0.108 (significant at 5 percent) in column 2; -0.081 (significant at 5 percent) in column 3; -0.080 (significant at 5 percent) in column 4.
* Post-P S D 2 times Payment FinTech times Amount funding: -0.004 (significant at 5 percent) in column 2 and column 4. This variable is not applicable to columns 1 and 3.
* Controls, Firm F E, and Time F E: All marked as Yes for all columns.
* Observations: 1,879 for columns 1 and 2; 1,910 for columns 3 and 4.
* R-squared: 0.613 for columns 1 and 2; 0.578 for columns 3 and 4.
* Number of firms: 420 for columns 1 and 2; 423 for columns 3 and 4.
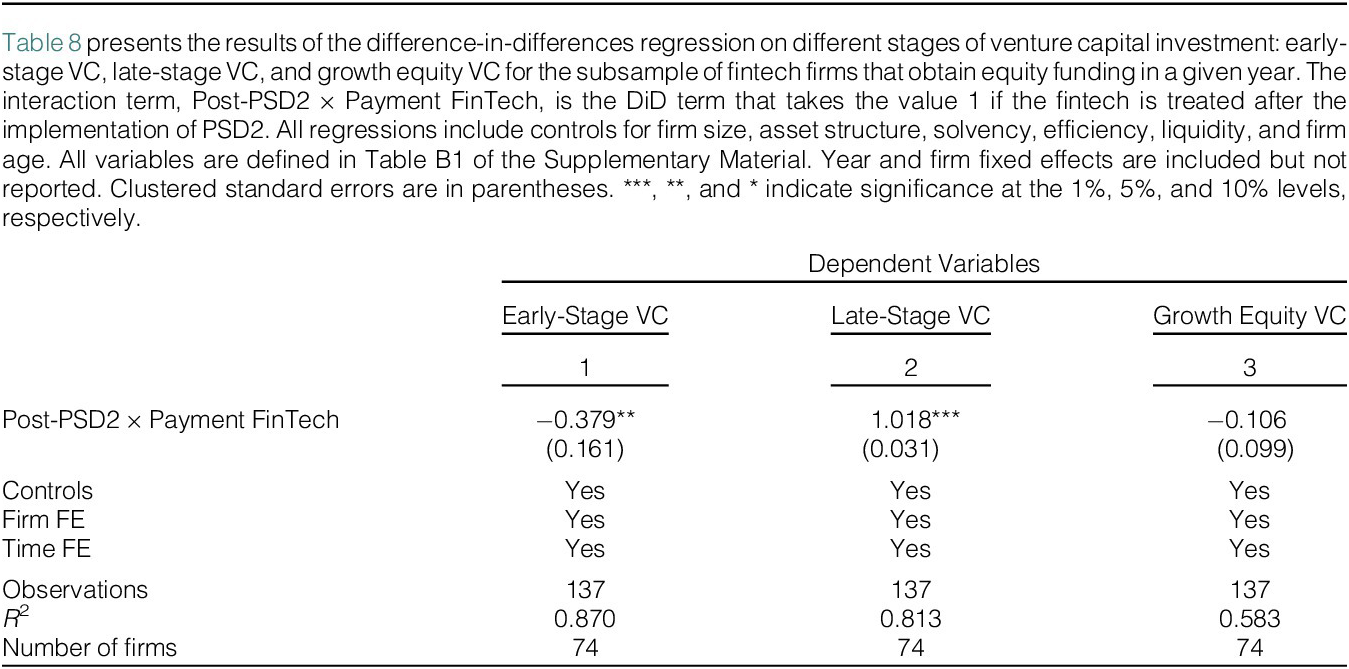
Furthermore, we analyze whether the effects of PSD2 differ across stages of venture capital investment. This is relevant because financing through venture capital could clarify the growth stage of firms, as venture capital (VC) financing typically follows a staged progression. Firms initially raise early-stage VC to fund product development and market entry, then attract late-stage VC as they scale operations, and finally secure growth equity financing when approaching maturity or a potential IPO. In doing so, we estimate the model using as the dependent variable an indicator equal to 1 if the fintech firm receives funding in a given VC stage-year, and 0 otherwise. The resulting coefficients capture changes in the probability of accessing different types of venture capital funding after the implementation of PSD2.
Table 8 shows that payment services fintechs receive more late-stage VC funding (column 2), while early-stage VC investment declines (column 1) and growth-equity VC shows no discernible change (column 3). Open banking may have facilitated the transition of these firms from the early to the later stages of venture capital financing. However, the absence of an effect on growth equity VC implies that most of these firms had not yet reached the maturity required to attract pre-IPO or large institutional equity investors.

TABLE 8 Long description
The table consists of three columns representing different V C funding stages: (1) Early-stage V C, (2) Late-stage V C, and (3) Growth equity V C.
* The primary row, Post-P S D 2 times Payment FinTech, shows the following coefficients and standard errors:
- Column 1: minus 0.379 with a standard error of 0.161, significant at the 5 percent level.
- Column 2: 1.018 with a standard error of 0.031, significant at the 1 percent level.
- Column 3: minus 0.106 with a standard error of 0.099, not statistically significant.
* Fixed Effects and Controls:
- Controls, Firm F E, and Time F E are marked as ‘Yes’ for all three columns.
* Summary Statistics:
- Observations: 137 for all columns.
- R-squared: 0.870 for Early-stage, 0.813 for Late-stage, and 0.583 for Growth equity.
- Number of firms: 74 for all columns.
Finally, we also examine whether the composition of investors in alternative equity market funding rounds changed for payment fintechs after the adoption of PSD2, with a particular focus on bank and non-EU investors.Footnote 26 Banks can play a dual role in the fintech ecosystem: not only as competitors in payment services but also as potential strategic investors seeking to acquire technology, market access, or partnerships. The results (Table A5 of the Supplementary Material) show no significant effects for bank investors in either the full sample (column 1) or the subsample of equity-funded fintechs (column 3). This suggests that after PSD2, banks remained cautious regarding direct investment in fintech competitors. Turning to non-EU investors, a different pattern emerges. In the full sample (column 2), the coefficient is not statistically significant. Yet, in the subsample of fintechs that raised equity funding (column 4), the coefficient is significant at 1%. Open banking could have enhanced the visibility of European payment fintechs, making them more attractive to international capital providers.
V. Potential Channels
A. Revenue-Driven Versus Cost-Driven Channels
There are two main channels by which firms can become more profitable: a revenue-driven channel and a cost-driven channel. The revenue-driven channel focuses on increasing sales and revenue, enabling firms to generate additional profits, while the cost-driven channel focuses on improving cost efficiency, enabling firms to maintain their income sources while cutting operational expenses.
Payment fintech firms may have increased revenues through personalized services, broader market reach, and innovative products, reflecting improved access to customer financial data under open banking and enhanced payment security. Moreover, payment fintech firms may have improved performance through greater operational efficiency and productivity. As both channels could be driving the improved performance, we examine their relative contributions to better understand the primary drivers of profitability.
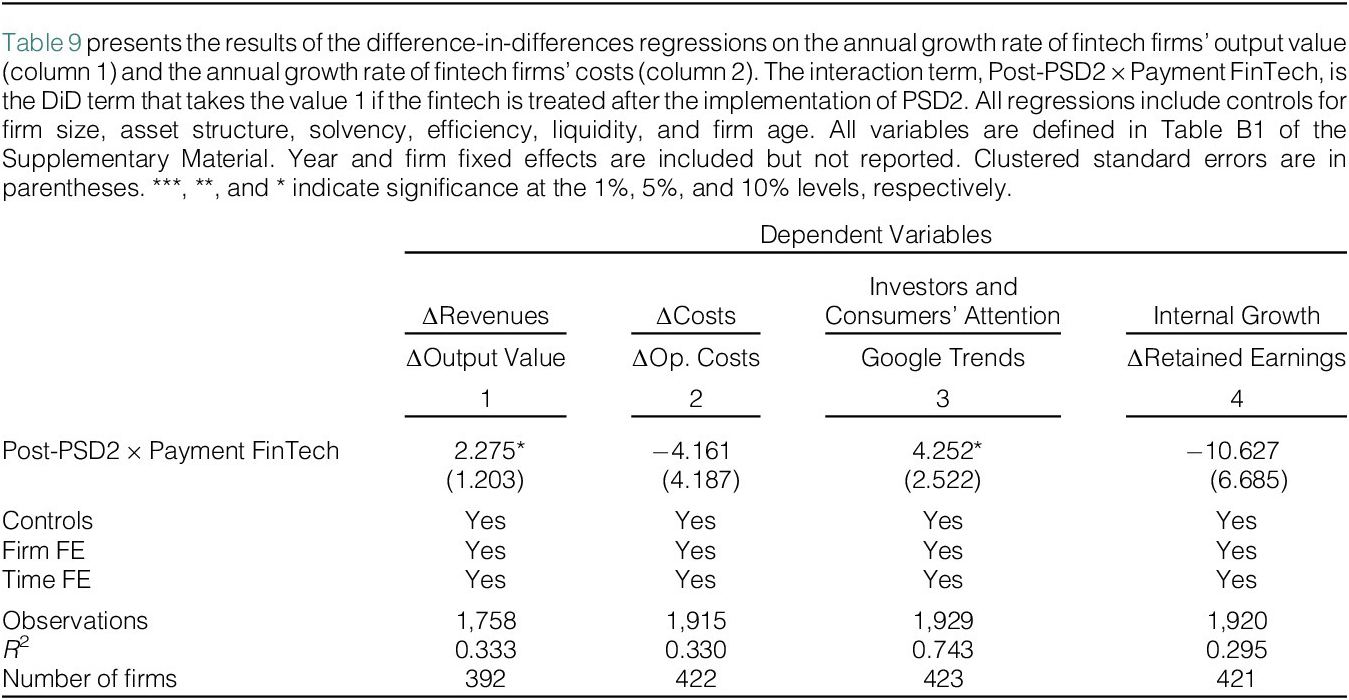
To test the revenue and cost-driven channels, we use the annual growth rate of total sales and changes in stock (∆Output value) and the annual growth rate of total inputs and personnel expenses (∆Op. costs), respectively. The signs of the coefficients in Table 9 support the revenue-driven channel.

TABLE 9 Long description
A table with four columns representing different regression models.
Column 1: Delta Revenues (Dependent variable: Delta Output value). The interaction term Post-P S D 2 times Payment FinTech is 2.275 with a standard error of 1.203, significant at the 10 percent level. Observations: 1,758. R-squared: 0.333. Number of firms: 392.
Column 2: Delta Costs (Dependent variable: Delta Op. costs). The interaction term is minus 4.161 with a standard error of 4.187. Observations: 1,915. R-squared: 0.330. Number of firms: 422.
Column 3: Investors and consumers attention (Dependent variable: Google trends). The interaction term is 4.252 with a standard error of 2.522, significant at the 10 percent level. Observations: 1,929. R-squared: 0.743. Number of firms: 423.
Column 4: Internal growth (Dependent variable: Delta Retained earnings). The interaction term is minus 10.627 with a standard error of 6.685. Observations: 1,920. R-squared: 0.295. Number of firms: 421.
All models include Controls, Firm F E, and Time F E (all marked Yes). Standard errors are clustered and reported in parentheses.
B. Investors’ and Consumers’ Attention
As an additional mechanism, we examine whether the increase in performance and the attraction of equity investors could be explained by a rise in both investors’ and consumers’ attention. Prior studies have shown that search intensity is a good proxy for investors’ attention (Da, Engelberg, and Gao (Reference Da, Engelberg and Gao2011)) and consumers’ demand (Vosen and Schmidt (Reference Vosen and Schmidt2011)). We use the Google Trends index to capture firm visibility and public interest, which may reflect adoption and revenue potential, while also signaling market momentum to investors and increasing attractiveness for alternative equity financing.Footnote 27
Payment fintechs experienced an increase in Google search intensity after the implementation of open banking (column 3 of Table 9). This finding is consistent with the idea that PSD2 not only reshaped the regulatory and competitive environment but also heightened public attention on payment fintechs. This increase in visibility and attention may have raised consumer demand for payment fintechs, boosting their revenues (as shown in Section V.A) and greater investor attention, making these firms more appealing investment targets and ultimately facilitating higher levels of equity funding.
C. Internal Growth
Finally, we investigate whether the increase in performance observed after the adoption of PSD2 translated into greater internal capitalization through retained earnings.
The results in column 4 of Table 9, however, do not provide evidence in favor of this mechanism. Internal growth through retained earnings did not play a central role in explaining the decline in bank debt and the rise in equity financing after PSD2. Instead, the evidence points to external channels—particularly consumer and investor attention and the inflow of alternative equity investors—as the primary drivers of the funding shifts.
VI. Robustness
A. Challenges to Identification
Although our identification strategy is carefully designed, we implement a set of robustness tests to assess the reliability of our approach.
1. Licensed and Nonlicensed Payment Fintechs
There is heterogeneity within the treated group. Nine treated firms hold a payment license (EMI, AISP, or PISP), while the remainder do not. A related concern is that licensed treated firms (TPPs) may be directly affected by PSD2, whereas others are indirectly affected through broader regulatory and technological changes. To address this issue, Table A6 of the Supplementary Material reruns the baseline regressions, defining the treated group as payment services fintechs holding a payment license (EMI, AISP, or ASPSP), while the control group remains the same as in the benchmark exercise. Table A7 of the Supplementary Material instead defines the treated group as payment services fintechs without a license, while the control group is unchanged.
In both cases, the estimated effects are similar to the main findings of the article. Regarding economic significance, compared to the baseline estimations, the analysis restricted to licensed payment services fintechs reveals a larger increase in ROA—32.8 versus 24 percentage points in the baseline—but a smaller reduction in bank debt—6 versus 10.9 percentage points.
2. Control Group: Excluding Robo-Advisors and Asset Managers
As an additional robustness check, we restrict the control group to fintech firms least likely to benefit from PSD2-type data access. Specifically, we exclude robo-advisors and asset management fintech firms from the control group, as these segments may indirectly benefit from banking data even if not directly targeted by open banking regulation. The results reported in Table A8 of the Supplementary Material remain unchanged, and the magnitude of the treatment coefficients increases slightly, reinforcing the interpretation that our findings are driven by PSD2-induced effects on payment fintech firms rather than broader fintech dynamics.
3. Resampling of the Control Group
To evaluate the robustness of the estimated treatment effect to the composition of the control group, we perform a resampling exercise by repeatedly selecting random subsets of control firms. In each of 1,000 iterations, the set of treated firms is kept fixed, while a random subset of 150–350 control firms is drawn from the full pool of nontreated fintechs. We then re-estimate the baseline specification on each resampled data set.
Figure A5 of the Supplementary Material shows the distribution of the estimated DiD coefficients and their p values for ROA, bank debt, and equity‑funding growth. For ROA (Graph A5a of the Supplementary Material), the coefficients cluster around the benchmark estimate (+0.23), and about 99% of iterations yield significance at the 10% level. For bank debt (Graph A5b of the Supplementary Material), the distribution centers on −0.10 (close to the −0.109 estimate in Table 5), with significance in roughly 85% of iterations. For equity‑funding growth (Graph A5c of the Supplementary Material), the distribution is also centered on the benchmark estimate, and the coefficient is significant in 78% of iterations. Overall, these patterns indicate that our main results are not driven by the specific composition of the control group.
4. Placebo Test with Random Treatment Assignment
To test whether our estimated effects could arise purely by chance, we conduct a placebo exercise based on random assignment of the treatment. In each of 1,000 iterations, we randomly select 50 firms (the same number contained in the actual treated group) and assign them to the treatment group, creating a placebo treatment indicator that is then used to re-estimate the model.
Figure A6 of the Supplementary Material presents the histograms of the estimated coefficients and corresponding p values from the placebo experiment. The distributions are centered around 0 for ROA, bank debt, and the growth rate of equity funding, with estimated effects significant only about 10% of the time, which is consistent with the random nature of the exercise. This confirms that the original treatment effects do not arise spuriously under random assignment and validates the choice of our control group, since an effect of PSD2 is observed only for treated firms.
5. Anticipation Effects
As discussed in Section II.A, although PSD2 came into force in January 2018, it was enacted in 2015. Thus, the staggered implementation of PSD2, particularly due to the gradual enforcement of SCA and RTS, could challenge our identification. Here, we address possible anticipation and delayed effects by conducting two complementary analyses.
First, to assess whether the estimated effects could be driven by preexisting dynamics or unrelated trends, we conduct a test in which we shift the treatment year. We reassign the treatment year to each year from 2014 to 2022, recalculating the placebo treatment indicator (did_placebo) and re-estimating the model within a symmetric window of 4 years before and 4 years after each placebo treatment year (Figure A7 of the Supplementary Material). For ROA, the coefficient is significant only in 2018 (the actual policy year), and far from significant in all other years. For bank debt, the coefficient not only is significant in 2018 but also shows a significant and stronger effect in 2017. This could reflect a possible anticipation effect, which is plausible when examining firms’ funding, as financial (equity) markets and banks may have adjusted expectations ahead of the formal implementation of PSD2. In contrast, anticipation is unlikely for revenue or performance variables, which can only respond after the policy changes business operations. Finally, for the growth rate of equity funding, we observe that the growth of alternative finance also seems to have an anticipation effect, suggesting that alternative equity finance becomes a relevant source of funding at the same time as bank debt decreases, in line with our findings in Section IV.B.2. Taken together, these results provide evidence consistent with a substitution pattern, in which the growing importance of alternative sources of capital may be associated with a decline in bank debt.
Second, we perform a DiD analysis, in which we consider the post-treatment period to start in 2016. To maintain the same number of years before and after treatment, we use the sample period from 2012 to 2019. The results, shown in Table A9 of the Supplementary Material, maintain the expected signs (positive for ROA, negative for bank and long-term bank debt, and positive for the growth rate of equity funding) but are not statistically significant.
6. LLM as a Judge
We perform an additional robustness analysis, in which we collect the descriptions of these fintech firms’ activity from the FinTech Radar and send them via API to GPT-4o, excluding the name of the company and all other information. We then use the prompt shown in Table A10 of the Supplementary Material, in which we essentially describe our identification strategy to ChatGPT. The idea is for the LLM to serve as an independent judge.
The LLM identifies 48 of the 50 treated firms as treated. The few false negatives correspond to borderline cases whose descriptions emphasize payment facilitation or merchant support tools without explicitly mentioning payment execution or account access. Manual verification confirms that these borderline firms are still subject to PSD2 obligations, validating the accuracy of our treated definition.
B. Subsample Analyses
To ensure that our findings are not driven by specific subsets of fintech firms, we perform a series of subsample analyses for our key outcomes: performance, bank debt, and alternative equity funding, reported in Tables A11–A14 of the Supplementary Material. Each table focuses on one outcome variable, and each column corresponds to a different subsample restriction.
First, we restrict the sample to fintech–year observations that meet the Banco de España’s Central Balance Sheet Data Office quality standards.Footnote 28 This ensures that our results are not affected by potential accounting misreporting. Column 1 in all tables shows that the results remain unchanged. Second, we extend the sample period from 2012 to 2022 to rule out biases linked to early fintech developments under PSD1. Column 2 shows that the estimates remain consistent. Third, we exclude 2020 to avoid distortions from COVID-19 shocks to performance, financing conditions, and investment. Column 3 confirms that the results are qualitatively similar. In column 4, we restrict the sample to microfirms (fewer than 10 employees) to verify that the results are not driven by the largest fintechs, a relevant test given that the average fintech employs 7 workers. The main results hold. Column 5 limits the sample to firms classified under CNAE/NACE codesFootnote 29 (the Spanish and European industry classifications) corresponding to technological (M, N) or financial (K) activities. This serves as an additional filter to ensure that our sample effectively captures fintech firms and complements the Banco de España’s FinTech Radar classification. The results remain qualitatively unchanged. Finally, column 6 excludes firms located in major fintech clusters (Madrid, Barcelona, and Valencia) to ensure that our findings are not driven by location‑specific advantages such as superior access to customers or funding. The estimates continue to hold.
Across all subsamples, the share of treated firms remains stable and comparable to the full sample (11.9%), confirming that the restrictions do not disproportionately alter the treatment–control composition and reinforcing the robustness of our results.
C. Dynamic DiD Specification
To examine the dynamic effects of PSD2, we augment the baseline specification by decomposing the post-treatment period into year-specific effects. Specifically, we replace the single interaction term Post-PSD2t × Payment FinTechi with a set of interactions between the treatment indicator and year dummies for each post-PSD2 year. This specification uses the same sample, controls, and fixed effects as the baseline model, differing only in that it allows the treatment effect to vary over time. By doing so, we can trace the year-by-year evolution of the effects and assess their statistical significance in each post-treatment period. Table A15 of the Supplementary Material shows that the post-PSD2 effects persist over time.
The dynamic estimates also show that PSD2 effects did not fully materialize in 2018, but became clearer from 2019 onward. This timing is consistent with gradual adjustment: payment fintechs needed time to update infrastructure, comply with SCA and RTS requirements, integrate APIs, and translate access to payment account data into commercial activity. A similar logic applies to funding. Investors may have waited to observe regulatory adaptation and market traction before increasing equity financing, and fintech funding rounds are discrete events linked to milestones rather than annual flows.
VII. Conclusion
Open banking enables customer-authorized access to financial data and reshapes competition in financial services. This article examines how Europe’s open banking reform affects fintech firms. The PSD2 setting allows us to identify the fintech segment most directly exposed to the reform: payment services providers. We study the effects of open banking on fintech firm dynamics and funding using a difference-in-differences framework. To do so, we combine the Banco de España’s FinTech Radar with firm-level balance sheet and equity funding information to construct a panel of 423 Spanish fintech firms over the period 2014–2022.
Our results show relevant changes in both firm dynamics and financing. On average, treated firms exhibit a 24-percentage point increase in ROA after the implementation of this open banking initiative compared to control fintech firms. Moreover, payment fintech firms invest less in intangible and tangible assets, prioritizing liquidity over long-term investments. These firms also exhibit reduced labor intensity but increased labor costs and an increased share of permanent employees, indicating a shift toward higher skilled, more expensive labor. This change contributed to higher productivity among treated firms. In parallel, treated firms reduce their reliance on bank debt, especially long-term bank debt, and increase their reliance on equity funding, including larger and more stable equity funding among firms that secure external equity.
Evidence on mechanisms points to revenue growth and increased visibility for payment fintechs after PSD2, suggesting that access to customer data primarily strengthened revenue generation rather than reducing costs, while also attracting greater attention from both consumers and investors. Our results are robust to a range of checks, including tests of the identification strategy, anticipatory effects, random treatment assignments, and alternative sample specifications.
The Spanish setting features a relatively centralized open‑banking infrastructure, where Redsys plays a central role as the primary API provider connecting banks and TPPs, facilitating interoperability and potentially contributing to uniform adoption patterns. Jurisdictions with multiple API providers may exhibit more fragmented competitive and technical dynamics. Future research could examine how the degree of centralization in open‑banking infrastructures shapes the effects of data‑access regulation across markets.
Although our analysis focuses on fintech firms, open banking regulations such as PSD2 affect a wide range of actors, including banks and credit institutions. Investigating the impact of open banking on them represents an important avenue for future research.
Overall, this article contributes to the literature on open banking by providing empirical evidence on its effect on the dynamics of nonbank competitors, especially payment fintech firms. These insights are valuable for policymakers and stakeholders aiming to foster innovation and competition in the financial sector through data-driven financial regulations. Our findings can inform decisions on how to regulate this increasingly important segment of the financial system.
Supplementary Material
To view supplementary material for this article, please visit http://doi.org/10.1017/S0022109026103135.
Funding statement
Cuadros-Solas acknowledges financial support from the Spanish Ministry of Science, Innovation and Universities, Project PID2024-161782NB-I00.