

Introduction
Maize is the third most important food crop in India, after rice and wheat, cultivated in an area of 9.5 million hectares with an annual production of 24.5 million tonnes (Susha et al., Reference Susha, Das, Nath, Pandey, Paul and Ghosh2018). The adaptability of maize to diverse agro-ecologies and seasons along with high yield potential is unmatched to any other crops (Dass et al., Reference Dass, Jat, Singh and HK2008; Sharma et al., Reference Sharma, Singh, Dhyani and Dube2011). Maize can be a potential driver for diversification of the predominant rice–wheat cropping system in the Indo-Gangetic Plains of India (Gupta and Seth, Reference Gupta and Seth2007; Ladha et al., Reference Ladha, Kumar, Alam, Sharma, Gathala, Chandra, Saharawat, Balasubramanian, Ladha, Singh, Erenstein and Hardy2009; Saad et al., Reference Saad, Das, Rana, Sharma, Bhattacharyya and Lal2016; Das et al., Reference Das, Saharawat, Bhattacharyya, Sudhishri, Bandyopadhyay, Sharma and Jat2018) and contribute to food and nutritional security of the nation. The low yields of maize (~2.44 t/ha) in India are the outcome of several factors of which weed infestation appears to be the most critical. Wide spacing and slow initial growth rate of maize crop favour the preponderance of weeds, competing with the crop for nutrients, water, sunlight and space. Presence of weeds reduces the photosynthetic efficiency, dry matter production and distribution to economical parts and there by reduces the sink capacity of the crop resulting in poor grain yield (Das and Yaduraju, Reference Das and Yaduraju2011). Weed interference can cause maize yield losses by 15–75% (Sen et al., Reference Sen, Singh, Sharma, Singh, Singh and Pal2000), 84.3% (Pandey et al., Reference Pandey, Prakash, Singh and Mani2001) and 15–85% (Susha et al., Reference Susha, Das and Sharma2014). Brown manuring (BM) is the ‘no-till’ form of green manuring wherein a selective herbicide is applied to desiccate the legume plants before flowering rather than using cultivation. The existing BM technique adopted for rice involves growing Sesbania bispinosa (hereafter referred to as Sesbania) with the crop as a co-culture for the initial 25–30 days after sowing (DAS) and thereafter knocked down by a selective herbicide 2,4-D (Maitra and Zaman, Reference Maitra and Zaman2017). Sesbania leaves/residue become brown/yellow in colour upon degradation of chlorophyll and hence referred to as ‘brown manure’. The dead Sesbania residues are left standing in the field along with the main crop until they decompose in situ thereby adding organic manure. Principally, Sesbania as a live cover offers interference (at pre-killing period) initially, and later as a dead residue mulch offers stimulation (at post-killing period). The study of Oyeogbe et al. (Reference Oyeogbe, Das, Bhatia and Singh2017) indicates that BM decreases weed interference through smothering effects or allelopathy and reduces herbicide dose and residue in the soil. This will reduce herbicide intake into the environment (Das, Reference Das2001; Gupta and Seth, Reference Gupta and Seth2007; Singh et al., Reference Singh, Ladha, Gupta, Rao and Singh2007; Ladha et al., Reference Ladha, Kumar, Alam, Sharma, Gathala, Chandra, Saharawat, Balasubramanian, Ladha, Singh, Erenstein and Hardy2009; Sharma et al., Reference Sharma, Singh, Dhyani and Dube2010a; Ramachandran et al., Reference Ramachandran, Veeramani and Prema2012; Das et al., Reference Das, Ahlawat and Yaduraju2014a). Besides, in situ Sesbania biomass like other residues can conserve soil moisture (Lal, Reference Lal1997; Sharma et al., Reference Sharma, Singh, Dhyani and Dube2010a, Reference Sharma, Singh, Dhyani and Dube2010b) and reduce irrigation water requirement, sequester C and N in the soil (Singh et al., Reference Singh, Singh and Timsina2005; Sharma et al., Reference Sharma, Singh, Dhyani and Dube2010a, Reference Sharma, Singh, Dhyani and Dube2010b; Verhulst et al., Reference Verhulst, Kienle, Sayre, Deckers, Raes, Limon-Ortega, Tijerina-Chavez and Govaerts2011; Bhattacharyya et al., Reference Bhattacharyya, Das, Pramanik, Ganeshan, Saad and Sharma2013; Das et al., Reference Das, Bhattacharyya, Sharma, Das, Saad and Pathak2013; Bhattacharyya et al., Reference Bhattacharyya, Das, Sudhishri, Dudwal, Sharma, Bhatia and Singh2015), reduce greenhouse gases emissions and mitigate climate change (Lal, Reference Lal2004; Oyeogbe et al., Reference Oyeogbe, Das, Bhatia and Singh2017) and increase crop yield and farm income (Jalota et al., Reference Jalota, Buttar, Sood, Chahal, Ray and Panigrahy2008; Sharma et al., Reference Sharma, Singh, Dhyani and Dube2010a, Reference Sharma, Singh, Dhyani and Dube2010b, Reference Sharma, Singh, Dhyani and Dube2011). Sesbania BM in rice decreased weed density by 37–42% (Singh et al., Reference Singh, Chhokar, Gopal, Ladha, Gupta, Kumar, Singh, Ladha, Singh, Erenstein and Hardy2009) and 41–56% (Nawaz et al., Reference Nawaz, Farooq, Lal, Rehman, Hussain and Nadeem2017). Gangaiah and Babu (Reference Gangaiah and Babu2016) reported that BM crop (Sesbania) generated up to 1.21 t/ha dry biomass and 3.09 t/ha fresh biomass in 30 days and thereby accumulated 35.7, 3.9 and 17.2 kg/ha nitrogen, phosphorous and potassium, respectively. Moreover, BM reduced the weed biomass production (g/m2) by 40.5%.
An emerging weed problem in arable cropping systems has been the preponderance of perennial weed, Cyperus rotundus reported in maize (Susha et al., Reference Susha, Das and Sharma2014), soybean (Tuti and Das, Reference Tuti and Das2011; Kumar et al., Reference Kumar, Das and Yaduraju2012; Das et al., Reference Das, Paul and Yaduraju2014b), tomato (Gilreath and Santos, Reference Gilreath and Santos2004), etc. Furthermore, the recommended selective herbicides for maize in India like atrazine, pendimethalin, alachlor, 2,4-D, etc., has limited efficacy in controlling the aforesaid weed (Singh et al., Reference Singh, Walia, Kaur and Shergill2010; Behera et al., Reference Behera, Das, Ghosh, Kaur and Singh2018). Therefore, we investigated if Sesbania BM could be used to control C. rotundus and other weed species due to Sesbania's competitive ability (fast germination and emergence, fast growth resulting in high shading ability, below-ground competition for water and nutrients). The present study aims to develop a BM practice with optimum Sesbania seed rate, and time and dose of herbicide (2,4-D) application in maize crop with respect to weed control, crop productivity and economic feasibility. The hypotheses were: an optimized BM practice could control weeds better in maize without undue interference to crop; and this BM combined with a pre-emergence broad-spectrum selective herbicide would lead to better management of diverse weeds and harness higher maize yield and income. The specific objectives of the study were: to compare the overall effects of BM on weed management with that of the recommended herbicide through a preliminary trial (Experiment I); and to optimize the seed rate of Sesbania, and time, and dose of 2,4-D for achieving adequate weed management and superior maize yield and profitability (Experiment II).
Materials and methods
Experimental sites
The experiments were undertaken under natural weeds infestations in maize during rainy seasons (July to October) in 2011–2014 (~4 years) at the ICAR-Indian Agricultural Research Institute, New Delhi (28°35′N latitude, 77°12′E longitude and at an altitude of 228.6 m above mean sea level). The climate is sub-tropical, semi-arid with 710 mm annual rainfall. About 80% of the annual rainfall is received during July–September when maize is grown. The differences between maximum and minimum temperatures and rainfall on a daily basis in maize growing period during 2012–2014 are presented in Figs 1(a) and (b). The experimental field soil (Inceptisol; Typic Haplustept) was well drained and sandy loam (at 0–0.15 m depth). The initial status of soil (before starting of these experiments): slightly alkaline (pH 7.8); organic C 0.51% (Walkley and Black, Reference Walkley and Black1934); electrical conductivity 0.64 dS/m; both available P and K were medium with 23.3 kg P2O5/ha (Olsen et al., Reference Olsen, Cole, Watenabe and Dean1954) and 250.5 kg K2O/ha (Jackson, Reference Jackson1973); and available N was low with 272.6 kg N/ha (Subbiah and Asija, Reference Subbiah and Asija1956). The status of N, P and K is according to the nutrients rating chart available for Indian soils.
Temperature (°C) and rainfall (mm) during 2012, 2013 and 2014 in maize: (a) daily differences between maximum (Tmax) and minimum (Tmin) temperatures; (b) daily rainfall (mm).

Experiments, treatments and herbicides
Experiment I: This was a preliminary trial with six treatments (Table 1) and four replications, laid out in a randomized complete block design. The objective was to compare/evaluate the effects of two BM modules (BM I and II) with the recommended weed management practices in maize (ICAR-Indian Agricultural Research Institute, New Delhi, India), viz., atrazine + 1 hand weeding and atrazine + pendimethalin, towards controlling weeds including C. rotundus in maize-growing regions of India.
Details of treatments adopted in the Experiments I and II

a In all brown manuring treatments, pendimethalin, which is selective to both maize and Sesbania was applied pre-emergence with 1.0 kg/ha at 2 DAS to kill initial flushes of weeds.
Experiment II: This study involved 11 treatments (Table 1) comparing eight BM combinations (T1 to T8) with three controls (T9, T10 and T11). The BM treatments included a three-way factorial combination of Sesbania seed rates (15 and 25 kg/ha), 2,4-D dose (0.25 and 0.50 kg a.i./ha) and application time (25 and 35 DAS). The controls comprised recommended tank-mixture application of atrazine 0.75 kg a.i./ha + pendimethalin 0.75 kg a.i./ha (atrazine + pendimethalin; control 1), weedy control (WC; control 2) and weed-free control (WFC; control 3). Compared to the BM treatments adopted in Experiment I, one higher Sesbania seed rate at 25 kg/ha and one extended date for the killing of Sesbania at 35 DAS were adopted in this study in order to maximize the BM effects on weeds. Sesbania plants, being very succulent and highly susceptible to 2,4-D, another treatment with 50% lower dose of 2,4-D at 0.25 kg a.i./ha was adopted to economize BM. The gross plot area was 5.0 m × 4.9 m (~7 rows; 5 m long). The net plot areas (the area actually harvested for yields) were 3.5 m × 4.0 m (5 rows; 4 m long). For BM, Sesbania seeds at 10, 15 or 25 kg/ha (as applicable) were sown uniformly by broadcasting in the respective treatments before the sowing of maize, and wrecking (i.e. slight stirring of surface 0–0.05 m soil by a hoe) was done to cover Sesbania seeds with the soil.
Pendimethalin, which is selective to both maize and Sesbania, was applied at 1.0 kg a.i./ha as pre-emergence at 2 DAS in all BM treatments to control initial flushes of weeds. 2,4-D at 0.25 and 0.50 kg a.i./ha was applied at 25 and 35 DAS, which resulted in gradual drying up of Sesbania plants that served as dry mulch. Weeds were allowed to grow with crops throughout the crop-growing period in WC, whereas weeds were removed through four manual weeding, done at 15, 30, 50 and 70 DAS for making plots weed-free throughout the cropping period in WFC. Atrazine and pendimethalin at required quantities were mixed in the spray-tank just before application at 2 DAS. All herbicides were applied with 400 litres/ha water using a knapsack sprayer, fitted with a flat fan nozzle (Sukun Agencies India, Mumbai, Maharashtra, India).
Crop sowing and agronomic practices
Maize (cv. HQPM 1) was sown on plain/flat land with 0.7 m (row–row) × 0.3 m (plant–plant) spacing at 0.03–0.04 m depths using 20 kg seed/ha. The dates of sowing were 7 July 2011, 10 July 2012, 2 July 2013 and 5 July 2014 and the emergence of maize was recorded on 12 July 2011, 15 July 2012, 6 July 2013 and 10 July 2014. To facilitate sowing, a manually-operated hand plough was used to open small furrows along the rows. Two maize seeds were dibbled at 0.30 m distance (forming a hill) to maintain plant to plant spacing along the rows. Maize seedlings were thinned to one plant per hill upon emergence. Maize continued to grow throughout the rainy season (July–October) and was harvested on 26 October 2011, 27 October 2012, 22 October 2013 and 25 October 2014. Depending on the rainfall received and resultant soil surface cracking observed, four irrigations were applied to maize in 2011, 2012 and 2014, whereas five irrigations were given in 2013 in all treatments. A recommended dose of 120 kg N, 60 kg P2O5 and 40 kg K2O per ha in the form of urea, single superphosphate and muriate of potash, respectively, was applied to maize. Half dose of N and full dose of P and K were applied at sowing, and the remaining N was top-dressed in equal amounts at 30 and 60 DAS. No diseases appeared in maize. Stem borer and shoot fly infestations were observed in maize, and carbofuran (3G) 25 kg/ha was applied along maize crop rows to control these insects.
Analyses for weed control effects
Weeds were collected by pulling out from an area of 0.90 m length (along the rows; 3 maize plants) and 0.70 m width (across the rows; 1 row width) at 60 DAS. This area was randomly chosen involving one central row in each plot. Weed species were identified, counted and kept for sun-drying for 2 days, and, then, were put in an oven at 70 ± 5 °C for 48 h for recording dry weights. Weed control efficiency (WCE), which reflects per cent reduction in weed density by a treatment, was determined using Eqn (1) (Nath et al., Reference Nath, Das and Rana2016).

where WPc and WPt are the weed density (no./m2) in WC and treatment plots, respectively.
Weed control index (WCI), which reflects per cent reduction in weed dry weight by a treatment, was determined using Eqn (2) (Nath et al., Reference Nath, Das and Rana2016).

where WDc and WDt are the weed dry weights (g/m2) in WC and treated plots, respectively.
Weed index (WI), which reflects per cent yield loss due to weeds in a treatment, was calculated using Eqn (3) (Asres and Das, Reference Asres and Das2011).

where Y wf and Y t are the maize yields in WFC and treatments, respectively.
Maize and Sesbania emergence, maize leaf area index and yield
The days of emergence of maize, Sesbania and weeds were recorded from all plots including BM plots through daily observation from 2 DAS onwards. The emergence was recorded when two cotyledonary leaves of Sesbania and broad-leaved weeds (BLWs), and the cotyledonary leaf of maize and grassy weeds of approximately 75% of plants emerged from the soil. Maize leaf area, which reflects the overall photosynthetic activity of maize plants across treatments, was recorded at 60 DAS. Three maize plants, having a land area of 0.90 m × 0.70 m, were collected from the place where weeds were sampled (mentioned above) at 60 DAS. All maize leaves were separated from plants and their area was measured using a leaf area meter (LI-COR 3100, LI-COR, Lincoln, NE, USA) and leaf area index (LAI) was determined using Eqn (4).

At maturity, maize cobs were harvested from the net plot areas across the treatments and cobs were dehusked manually. Grains were separated from the cobs by using a Sheller machine (Bharat Industries, Karnal, Haryana, India), weighed and grain yield was reported at 15% moisture (Oyeogbe et al., Reference Oyeogbe, Das, Bhatia and Singh2017).
Maize production economics
The cost for all treatments included common costs of agronomic inputs/operations (namely, tillage, seed, sowing, fertilizers, irrigation, plant protection, harvesting, threshing, etc.) required for maize cultivation and costs of inputs/operations such as the costs of Sesbania seed, 2,4-D and its application, hand weeding, etc., required extra for particular treatment. All these costs were determined as per the prevailing market prices of respective inputs/operations. Gross returns (GR) was determined using Eqn (5). The net returns (NR) and net benefit:cost (NB:C) were worked out following Eqns (6) and (7), respectively. The NB:C is the NR (in $) that could accrue from investing $1.0 in the cost of production. All costs/values in Indian Rupees (INR/ha) were converted to USD ($)/ha in respective years following X-rates (2016).


Statistical analysis
The data were analysed using the ‘analysis of variance (ANOVA) technique’ as applicable to a randomized complete block design (both single-factor and three-factor analysis) as per the procedures described by Rangaswamy (Reference Rangaswamy2006). For Experiment II, the ANOVA was carried out for the 3-year period, considering year as a random effect. All data (weed, crop and soil parameters) were subjected to Kolmogorov–Smirnov and Levene tests for normality and homogeneity of variance. The uniformity in error variance was non-significant; hence, the data were pooled over the years. Weed data (density, dry weight) were subjected to square-root $(\sqrt {x + 0.5} )$ transformation (Das, Reference Das1999), and analysed using ANOVA. The significance of difference among different treatments was tested by the variance ratio (F test) at 5% level of significance (P ⩽ 0.05). Least significant difference (LSD) values were calculated for the parameters that exhibited significant difference. A linear regression analysis was done to work out the relationship between Sesbania biomass input and soil organic carbon/total soil nitrogen. A contrast analysis among treatments and controls (Experiment II) was performed using SAS 9.1 (SAS Institute, Cary, NC, USA).
Results
Experiment I (weed control and maize growth and yield)
Weed flora of the experimental maize field under WC situations (Table 2) comprised of three grassy weeds, namely, Acrachne racemosa (Heyne ex Roem and Schult) Ohwi., Dactyloctenium aegyptium (L.) P. Beauv. Willd. and Setaria viridis (L.) Beauv.; three BLWs, namely, Trianthema portulacastrum L., Commelina benghalensis L. and Digera arvensis (L.) Forsk.; and perennial sedge namely C. rotundus L. Cyperus rotundus was the most dominant weed (84 plants/m2; 39.1%), followed by A. racemosa (Heyne ex Roem and Schult) Ohwi. (38 plants/m2; 17.7%) and T. portulacastrum L. (37 plants/m2; 17.2%). The other weed species, having <10% relative density, were of less importance in maize crop.
Species-wise weed density (number/m2 and per cent basis) at 30 DAS (n = 8) in the field in 2011 (Experiment 1)

All the four weed control treatments being on par brought about a significant reduction in total weed density and weed dry weight compared to WC (Table 3). Lowest weed density (8.1 plants/m2) was recorded with BM II (15 kg/ha Sesbania seed + 2,4-D 0.50 kg a.i./ha applied at 25 DAS along with pre-emergence pendimethalin), while lowest weed dry weight was recorded with Atrazine + HW. Atrazine + pendimethalin (tank-mix) resulted 100% control of grassy weeds but could not suppress the problematic sedge C. rotundus, which constituted 90.2% of the total weed population and 51.5% of the total weed dry weight. In contrast, BM II and BM I (10 kg/ha Sesbania seed + 2,4-D 0.50 kg a.i./ha applied at 25 DAS along with pre-emergence pendimethalin) displayed superior control of C. rotundus with approximately 50% reduction in weed density and 40% reduction in weed dry weight compared to the tank-mixture. BM II recorded a superior WCE (Fig. 2(a)) and WCI (Fig. 2(b)) being at par with atrazine + pendimethalin and atrazine + HW. Weed index, representing maize yield losses due to weeds (Fig. 2(d)), was significantly lower in atrazine + HW (5%), BM II (7%) and atrazine + pendimethalin (8%) compared to WC (~55%). The BM practice BM II being on par with the herbicide treatments recorded significantly higher LAI compared to WC (Fig. 2(c)) and gave high maize grain yields which were comparable to WFC (Fig. 2(d)).
(a) Weed control efficiency (WCE); (b) weed control index (WCI); (c) maize leaf area index (LAI) at 60 DAS and (d) maize grain yield and yield loss, across the treatments (Experiment I). Means with at least one letter common are not statistically significant at P < 0.05 (LSD).

Density and dry weight of different weeds categories and maize grain yield across the treatments at 60 DAS (Experiment I)

a The total weed densities/dry weights have been calculated by summing up the original values followed by (x + 0.5)½ transformation.
b Square-root (x + 0.5)½ transformed values. For details of treatments, see Experiment I in Table 1.
Experiment II
Combined ANOVA for weed parameters, yield and economics
The effects of BM seed rate (S), time of 2,4-D application (T), dose of 2,4-D (D) and their interaction along with contrasts (BM v. controls) on weed parameters, maize yield and economics have been presented in combined ANOVA table (Table 4). Year effect was found significant for weed density, weed dry weight and maize stover yield. The main effects of Sesbania seed rate (S), dose (D) and time (T) of 2,4-D application, and the S × T interaction effects were significant for all the study parameters. The T × D interaction effect was significant only for weed density and weed dry weight. The interaction effects of S × D and S × T × D as well as all year (Y) × treatment interactions were non-significant for all the study parameters. The contrast atrazine + pendimethalin (control 1) v. BM (mean of eight BM treatments) was significant for all parameters except weed density and weed dry weight, indicating that BM was on par with the standard herbicide with respect to weed control. The other contrasts, viz., C2 (WC) v. BM and C3 (WFC) v. BM, were significant for all the study parameters.
Combined analysis of variance for the studied parameters on weed growth, maize yield and economics (Experiment II)

R, replication; Y, year; C1, herbicide control (atrazine + pendimethalin); C2, weedy control; C3, weed-free control; BM, brown manuring treatment mean (T1 to T8); DF, degrees of freedom; WD, total weed density (no./m2); WDM, total weed dry matter (g/m2); GY, maize grain yield (t/ha); SY, maize stover yield (t/ha); WI, weed index (%); GR, gross returns ($/ha); NR, net returns ($/ha); NB:C, net benefit:cost.
*Significant at P ⩽ 0.05; NS: non-significant; all other interactions (Y × S, Y × T, Y × D, Y × S × T, Y × T × D, Y × S × D, Y × S × T × D, Y × C and Y × C1/C2/C3v. BM) were non-significant for all the parameters.
Weed density, weed dry weight and control efficacy
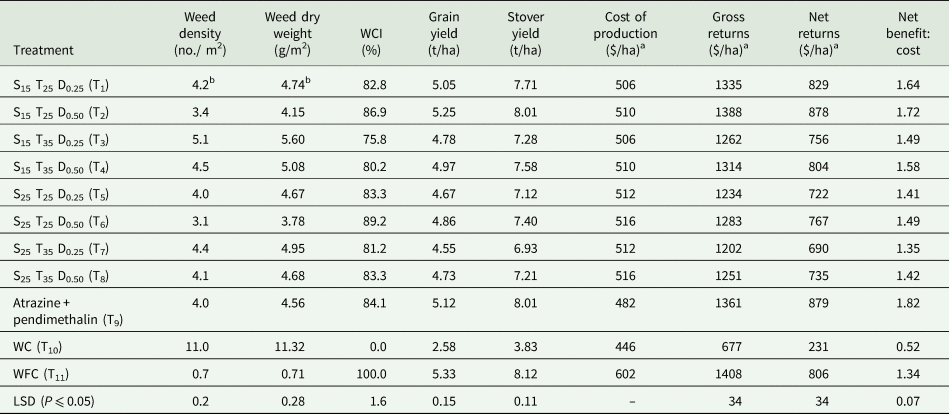
At 60 DAS, the total weed density, weed dry weight and WCI differed significantly with Sesbania seed rate (S), time of 2,4-D application (T) and 2,4-D dose (D) (Table 4). Significantly lower weed density, dry weight and WCI were observed with S~25 kg/ha (3.9 plants/m2, 4.52 g/m2 and 84.2%, respectively) against S~15 kg/ha. Similarly, T~25 DAS (3.7 plants/m2, 4.34 g/m2 and 85.6%, respectively) was superior to T~35 DAS and D~0.50 kg a.i./ha (3.8 plants/m2, 4.42 g/m2 and 84.9%, respectively) over D~0.25 kg a.i./ha for the above-mentioned parameters (Table 5). The mean of BM (T1 to T8) treatments was on par to the standard herbicide atrazine + pendimethalin (C1) in terms of weed density, weed dry weight and WCI. BM reduced weed density and weed dry weight by 62.7 and 58.3%, respectively, over WC. Overall, weed density and weed dry weight were higher during 2014 compared to 2013 and 2012. A single-factor analysis to compare the BM combinations (Table 6) confirmed that S~25 kg/ha + T~25 DAS + D~0.5 kg a.i/ha (T6: S25 T25 D0.50) and S~15 kg/ha + T~25 DAS + D~0.5 kg a.i./ha (T2: S15 T25 D0.50) led to significant reductions in weed dry weights (66.6 and 63.3%, respectively) compared to WC, and were superior to standard herbicide control. Under BM, Sesbania seed rate (S) × 2,4-D application time (T) and 2,4-D application time (T) × 2,4-D application dose (D) interaction effects were significant (Table 7), indicating that T levels responded differently to S and D levels, respectively, and vice-versa. Both S~15 and S~25 kg/ha registered significantly lower weed densities and weed dry weights at T~25 DAS against T~35 DAS. Similarly, 2,4-D application at 25 DAS as well as 35 DAS was more effective when a higher 2,4-D dose 0.50 kg a.i./ha was applied (Table 8).
Density and dry weight of weeds and weed control index (WCI) at 60 DAS in maize in Experiment II (pooled mean of 3 years)

BM, brown manuring treatment mean (T1 to T8).
a Square-root (x + 0.5)½ transformed values. For details of treatments, see Experiment II in Table 1.
b LSD for pair-wise comparison among the controls (C1, C2, C3).
c LSD for pair-wise comparison between C1/C2/C3 v. BM.
One-way comparison/single-factor analysis using RCBD for the parameters of weeds and maize studied across treatments (pooled mean of 3 years)
For details of treatments, see Experiment II in Table 1.
a $(US Dollar) 1.0 = INR (Indian Rupee) 54.82 (2012), INR 62.59 (2013), INR 61.68 (2014).
b Square-root (x + 0.5)½ transformed values.
Interaction between Sesbania seed rate (S) × 2,4-D application time (T) on weed density, weed dry weight, maize grain yield and net returns

a Square-root (x + 0.5)½ transformed values.
b See Table 10 for the value of $.
Interaction between time (T) and dose (D) of application of 2,4-D on weed density and weed dry weight

a Square-root (x + 0.5)½ transformed values.
Yield and economics
Maize grain yields and yield losses due to weeds (WI) did not differ significantly between the years; however, stover yield was significantly higher in 2013 as compared to 2012 (Table 9). Factorial analysis of treatments revealed that despite being slightly inferior in terms of weed control, S~15 kg/ha returned 6.6% higher grain yield (5.01 t/ha) and 6.5% higher stover yield (7.64 t/ha) than S~25 kg/ha. Similarly, T~25 DAS resulted 4.2 and 4.3% higher grain and stover yields, respectively, over T~35 DAS, whereas D~0.50 kg a.i./ha resulted in ~4% higher grain and stover yields over D~0.25 kg a.i./ha. Although the standard herbicide check resulted in significantly superior maize grain yield (5.12 t/ha) compared to the overall BM yield (4.86 t/ha), it was inferior to the BM combination S~15 kg/ha + T~25 DAS + D~0.5 kg a.i./ha (T2: S15 T25 D0.50). The later registered a 3-year mean grain and stover yield of 5.25 and 8.01 t/ha and was on par to the WFC. The yield response of Sesbania seed rate (S) differed with variation in 2,4-D application time (T) (Table 7). The yield of S~15 kg/ha significantly increased when 2,4-D was applied at 25 DAS (5.15 t/ha) against 35 DAS (4.87 t/ha) and similar was the case for S~25 kg/ha. The S × D and T × D and S × T × D interaction effects were non-significant for maize grain and stover yield.
Grain and stover yields of maize and weed index (WI) across the treatments during 2012–2014 (Experiment II) (pooled mean of 3 years)

For details of treatments, see Experiment II in Table 1.
BM, brown manuring treatment mean (T1 to T8).
a LSD for pair-wise comparison among the controls (C1, C2, C3).
b LSD for pair-wise comparison between C1/C2/C3 v. BM.
The average cost of cultivation (Table 10) for BM ($511/ha) was marginally higher than standard herbicide atrazine + pendimethalin by 6% and WC by 15%, but lower than WFC by 15%. Atrazine + pendimethalin resulted in significantly higher gross ($1397/ha) and NR ($914/ha) as compared to the overall BM mean ($1284 and $773/ha, respectively). However, the BM combination S~15 kg/ha + T~25 DAS + D~0.5 kg a.i/ha (T2: S15 T25 D0.50) was comparable to the herbicide check with mean gross and NR of $1388/ha and $878/ha (9% higher than WFC), respectively, and a net B:C of 1.72 (Table 6). Factorial analysis revealed that the levels S~15 kg/ha, T~25 DAS and D~0.50 kg a.i./ha were superior to their respective counterparts with respect to above economic parameters (Table 10). A significant S × T interaction effect for NR was established (Table 7), with significant higher returns from S~25 kg/ha × T~25 DAS combination ($854/ha).
Economics of maize production across the treatments in Experiment II (pooled mean of 3 years)

BM, brown manuring treatment mean (T1 to T8).
a $(US Dollar) 1.0 = INR (Indian Rupee) 54.82 (2012), INR 62.59 (2013), INR 61.68 (2014). For details of treatments, see Experiment II in Table 1.
b LSD for pair-wise comparison among the controls (C1, C2, C3).
c LSD for pair-wise comparison between C1/C2/C3 v. BM.
Discussion
Sesbania–maize interaction
For BM practice to be effective, the Sesbania interference should be minimized for the crop through proper optimization of Sesbania seed rate, and time and dose of 2,4-D application. Sesbania stimulates the crop growth through formation of a dead mulch (brown manure) while aids in conserving moisture, moderating temperature and improving soil physical, chemical and biological properties. The depths of seeding of Sesbania and maize, and moisture availability on the surface soil (0–0.03 m) after sowing created differences in the time of emergence of weeds (in 4 days), Sesbania (in 3 days) and maize (in 5 days). Sesbania with a shorter emergence time (owing to the nature of seeds and seed coats) had a competitive advantage over maize and weeds through early space capture. All BM treatments were supplemented with the herbicide pendimethalin, which eliminated initial interference from annual weeds. During initial 10 DAS, there was no visible interference of Sesbania to maize crop since maize plants with 2–3 fully-grown leaves had larger sized canopy compared to Sesbania. However, maize had much lower plant population (10–14 plants/m2) compared to Sesbania populations (~45–60 plants/m2 at 1.5 g seed/m2; 75–100 plants/m2 at 2.5 g seed/m2). At 17–18 DAS onwards, Sesbania manifested substantially higher crop growth rate and canopy coverage and created interference for space (i.e. space limitation), owing to which maize plants became slender, taller and almost in similar height as that of Sesbania plants. The biotic interference between maize, Sesbania and weeds, however, was not prolonged due to killing of Sesbania at 25 DAS by applying 2,4-D. Interference was prolonged when Sesbania was killed at 35 DAS, which offered a more negative impact on weeds as well as on maize (discussed later). Thus, Sesbania plants served as a live mulch for the initial 25/35 DAS and as a dead mulch after being killed by 2,4-D, and continued to smother weeds for the initial 35/45 DAS, depending on BM treatments. Later, a vigorous canopy cover of maize could suppress the weeds better.
Impacts on weed interference in maize
We attempted to evaluate the dual role of BM (initial interference against weed and later stimulation to crop) in maize through a series of trials under two experiments (2011–2014). In Experiment I (Table 3), BM II involving 15 kg/ha Sesbania seed + 2,4-D 0.50 kg a.i./ha applied at 25 DAS along with pendimethalin (PE) registered highest reduction in total weed density (WCE 70%) with superior control of BLWs (~63.7%) and C. rotundus (51.0%), but poor control of grasses (25.3%) compared to WC. Particularly, Sesbania BM (BM I and BM II) exhibited significant superior control of the problematic weed C. rotundus, which was rampant in the atrazine + pendimethalin and atrazine + HW treatments with 90.2 and 82.7%, respectively, of the total weed density. The weed dry weight, a more reliable estimate of weed interference than weed density (Das, Reference Das2001), was lowest in the treatment atrazine + pendimethalin tank-mixture (WCI 75%), but was statistically comparable to BM II and BM I. The positive outcome from BM treatments with respect to weed management encouraged us to conduct a second and elaborative experiment (Experiment II) employing a higher seed rate of Sesbania (25 kg/ha) with an extended date of Sesbania killing (35 DAS) for optimization of BM in maize crop.
During Experiment II, initial higher rainfall during the first 3 weeks after sowing in 2013 and 2014 affected the efficacy of pendimethalin (pre-emergence) applied to BM treatments (Fig. 1(b)). Two BM treatments, T6 (25 kg/ha Sesbania seed + 2,4-D 0.50 kg a.i./ha applied at 25 DAS) and T2 (15 kg/ha Sesbania seed + 2,4-D 0.50 kg a.i./ha applied at 25 DAS) caused greater reduction in weed density (71.8 and 69%, respectively) and weed dry weight (66.6 and 63.3%, respectively) compared to WC and were statistically superior to the herbicide check atrazine + pendimethalin tank-mixture (T9). Factorial analysis (Table 4) segregated the BM treatment effects into individual contrasts, viz., seed rate (S), 2,4-D application time (T) and 2,4-D dose (D). It revealed that T (25 DAS > 35 DAS) and D (0.50 kg a.i./ha > 0.25 kg a.i./ha) had greater impacts on weed suppression compared to S (25 kg/ha > 15 kg/ha) as found from their F ratios. The higher Sesbania populations, resulting from higher seed rate offered slightly better weed suppression owing to enhanced smothering effects. 2,4-D showed higher efficacy when applied at 25 rather than 35 DAS, since Sesbania and weeds were relatively younger and smaller at 25 DAS and, therefore, more susceptible. 2,4-D killed Sesbania and BLWs effectively and C. rotundus moderately, but grassy weeds were spared due to its narrow-spectrum activity at both 25 and 35 DAS. Higher dose-effect of 2,4-D led to better weed control at 0.50 than 0.25 kg a.i./ha. However, a selective broad-spectrum herbicide (presently lacking) in place of 2,4-D might be better. In all BM treatments, pendimethalin controlled initial infestations of dominant annual weeds, mainly, T. portulacastrum and A. racemosa, and helped Sesbania and maize to emerge in almost weed-free conditions and to smother late-emerging weeds better.
The tank-mixture consisted of atrazine (a photosystem II inhibitor) and pendimethalin (a microtubule assembly inhibitor). Atrazine killed most annual BLWs and few monocot grassy weeds, including D. arvensis (BLW), not controlled by pendimethalin (Susha et al., Reference Susha, Das and Sharma2014). Pendimethalin killed most annual monocot grassy weeds including A. racemosa and few BLWs including T. portulacastrum (mentioned above). Two different modes of action and better compatibility of these herbicides in tank-mixture led to an effective control of annual weeds, but not perennial C. rotundus (Experiment I). BM suppressed C. rotundus better than the tank-mixture in which the weed existed with 90.2% density and 51.5% dry weight of total weeds (Table 3). Cyperus rotundus shows tolerance to almost all herbicides used for maize. Practicing BM (biological intervention) and application of pre-emergence pendimethalin (chemical intervention) has been found to reduce the preponderance of C. rotundus, and lead to a better weed management.
Impacts on maize yield and economics
Maize grain yields and yield losses due to weeds did not differ significantly across years; however, stover yields were significantly higher in 2013 compared to 2012 (Table 9). This might have been due to narrower variations (T max−T min) in daily temperatures (Fig. 1(a)) due to consistently higher daily minimum temperatures during mid-September to mid-October in 2013, accompanied by intermittent showers (Fig. 1(b)). This promoted higher vegetative growth but lower grain filling of maize. Higher rainfall (~1196.6 mm) in 2013 resulted in periodic water-logging, to which maize was susceptible (Dass et al., Reference Dass, Jat, Singh and HK2008), and consequently reduced the grain yield.
Among all the BM treatments, 15 kg/ha Sesbania seed + 2,4-D 0.50 kg a.i./ha applied at 25 DAS (T2) secured higher grain yield than atrazine + pendimethalin tank-mixture (Table 6). Superior performance of T2 could be due to combined effects of superior WCE (~69%), lesser Sesbania–crop interference due to lower seed rate (compared to S~25 kg/ha) and an improved microclimate and soil properties (SOC and TSN) through Sesbania biomass addition. In this BM practice, initial temporary interference (at pre-killing period for 25 DAS) offered by the Sesbania live cover on maize might be largely compensated/mitigated by the vigorously growing maize plants at Sesbania post-killing period. Comparable LAI of maize plants obtained under the BM II (Experiment I) with atrazine + pendimethalin and WFC treatments could substantiate this fact (Fig. 2(c)). Sesbania biomass after 2,4-D application acted as a decomposing mulch, which might stimulate maize growth through conserving moisture (Sharma et al., Reference Sharma, Singh, Dhyani and Dube2010a, Reference Sharma, Singh, Dhyani and Dube2010b), accumulating soil C and N (Sharma et al., Reference Sharma, Singh, Dhyani and Dube2010a, Reference Sharma, Singh, Dhyani and Dube2010b), moderating temperature and reducing erosion (Lal, Reference Lal1997, Reference Lal2004; Singh et al., Reference Singh, Singh and Timsina2005; Verhulst et al., Reference Verhulst, Kienle, Sayre, Deckers, Raes, Limon-Ortega, Tijerina-Chavez and Govaerts2011; Ram et al., Reference Ram, Singh, Saini, Kler, Timsina and Humphreys2012). Not studied, but innumerable castings of earthworms found in BM plots (Authors' observations) indicate its effects on earthworms, and possibly, on soil micro flora/fauna. These reflected the superiority of this BM to a purely chemical method (i.e. atrazine + pendimethalin). The biological systems are resilient and can readily adjust to a change in crop plant micro-climate through capturing space and responding more to available growth factors as in case for T2. However, the treatment T6, having higher Sesbania population (25 kg seed/ha), suppressed weeds better and simultaneously offered greater interference to maize, which was not fully compensated at Sesbania post-killing period, resulting in lower yield and NR.
All BM treatments (Table 6) due to an additional application of pendimethalin and seed cost of Sesbania incurred higher cost than the atrazine + pendimethalin. But they had a lower cost than WFC. The superior BM combination S15 T25 D0.50 (T2) gave higher GR ($1388/ha) than the tank-mixture of atrazine + pendimethalin ($1361/ha), but owing to a higher cost of cultivation, their NR were equivalent. However, compared to WFC, the cost of T2 was lower by $92.0 (~15.3%) and NR higher by $72.0 (~9.0%). Thus, the T2 was found to be an economically superior alternative to WFC and environmentally superior alternative to the recommended tank-mixture of atrazine + pendimethalin.
Conclusions
The Sesbania seed rate and the time and dose of 2,4-D application, which are three important requirements for the successful adoption of BM in maize, were optimized in this study. A BM practice, involving 15 kg/ha Sesbania seed + 2,4-D at 0.50 kg a.i./ha applied at 25 DAS along with a pre-emergence application of pendimethalin 1.0 kg a.i./ha could lead to an effective weed management in maize. This BM practice was comparable with the herbicide control (i.e. atrazine + pendimethalin) on the reduction of weed population and dry weight. It also led to a better control of the noxious weed C. rotundus than the herbicide control and gave higher grain and stover yields of maize and NR. It can be recommended for the North-western Indo-Gangetic Plains of India and in similar agro-ecologies of the tropics and sub-tropics. Further studies of its impacts on the soil physico-chemical and biological properties, and greenhouse gases emissions across maize varieties grown in particular situations may reveal other sustainability benefits accruing from it and widen its adoption/application.
Acknowledgements
The authors sincerely acknowledge the necessary services and supplies provided by the Division of Agronomy, ICAR-Indian Agricultural Research Institute during the course of investigation of this research problem.
Financial support
This research received no specific grant from any funding agency, commercial or not-for-profit sectors.
Conflict of interest
None.
Ethical standards
Not applicable.



