INTRODUCTION
Phosphorus (P) is a key mineral in animal nutrition as well as posing an environmental problem (Knowlton & Herbein Reference Knowlton and Herbein2002). In Europe and North America, P excretion by animals leads to pollution, mainly due to high livestock densities as a result of which P from manure accumulates in soil and leaches, causing eutrophication problems (Terence Reference Terence2001). Furthermore, P represents more than half the cost of typical vitamin mineral premixes provided for dairy cows, thereby reinforcing the importance of reducing dietary P to match animal requirements more closely (Wu et al. Reference Wu, Satter and Soja2000). Decreasing P intake, thus decreasing P excretion in faeces, is considered a way to reduce environmental pollution (Valk & Beynen Reference Valk and Beynen2003). However, this alternative should be undertaken with caution as P deficiency can prejudice animal performance and health. Ruminants fed low P diets decrease their feed intake and thus their live weight gain (Ternouth & Sevilla Reference Ternouth and Sevilla1984). The ideal amount of P necessary to satisfy animal and microbial functions and support best performance has to be supplied without impairing the environment unduly. Thus it is crucial to examine how P is utilized by ruminants to investigate the equilibrium between the need to improve animal performance and the need to diminish P excretion.
The mathematical model described by Dias et al. (Reference Dias, Kebreab, Vitti, Roque, Bueno and France2006) allows a comprehensive view of the distribution of P in addressing P demands. This model describes P flows between bone, gut, plasma and soft tissue as a reflection of P metabolism. Phosphorus from bone can be mobilized by up to 30% during early lactation, providing the P necessary for milk production (Ternouth Reference Ternouth1990). In growing animals, P is mobilized within the body to address bone formation, although re-absorption occurs simultaneously (Wu et al. Reference Wu, Satter, Blohowiak, Stauffacher and Wilson2001). The amounts of P that animals mobilize and restore are not well established although it is known that, in deficit conditions, these amounts can be high (Wu et al. Reference Wu, Satter and Soja2000).
The objective of the current study was to assess P kinetics in growing sheep fed different levels of P in order to understand better P metabolism and to determine P requirements.
MATERIALS AND METHODS
Animals and diets
The experiment was conducted using a protocol approved by the Centre of Nuclear Energy in Agriculture (CENA) Animal Care Committee. Twelve male sheep, of Santa Inês breed, initial live weight 23 (±2·2) kg, aged 5 months, were first allocated to stalls at CENA, University of Sao Paulo where they received the experimental diets for 2 weeks. After this period, animals were placed in metabolism cages designed for isotopic studies where representative samples of faeces and urine were collected (0·1 of output) for 3 days for P analysis. Following this collection period, a single dose of 7·4 MBq of 32P in a 0·5 ml sterile isotopic saline (9 g NaCl/l) was injected into the jugular vein, and subsequently samples of faeces, urine and plasma were collected every morning before feeding for 1 week. Blood samples were taken from the jugular vein at 5 min, 1, 2, 4 and 6 h after injection and thereafter every 24 h, with the last sample taken at 144 h. After the last day of collection, the animals were sacrificed and soft tissue samples from kidney, liver, heart and muscle were taken for inorganic P determination and 32P counting. The same procedure was followed with bone, which was collected from a rib.
The basal diet comprised roughage (600 g coast cross hay/day), concentrate mixture (200 g cassava flour/day and 15 g urea/day) and 10 g mineral mixture/day. The treatments consisted of the basal diet supplemented with different amounts of dicalcium phosphate (0, 8·3, 16·6, 25 g) to provide 0, 1·5, 3·0, 4·5 g P/animal/day, representing treatments T1, T2, T3 and T4, respectively. Feed was given twice daily after samples were collected.
Analysis of samples
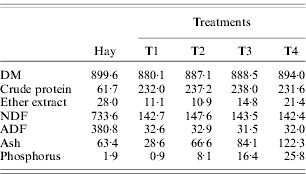
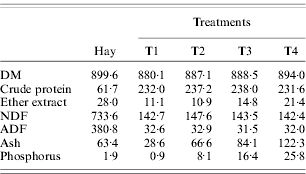
Samples of feed and feed refusals were analysed for dry matter (DM), crude protein, neutral detergent fibre (NDF), acid detergent fibre (ADF) and P concentrations. Crude protein was determined by the Kjeldahl method, ADF following recommendations of Association of Official Analytical Chemists (1995) and NDF according to Mertens (Reference Mertens2002), without using amylase or sodium sulphite (Table 1).
Chemical (g/kg DM) composition of diets fed to sheep receiving different levels of P
The inorganic P level in plasma was determined by colorimetric analysis (Fiske & Subbarow Reference Fiske and Subbarow1925). Nine millilitres of trichloricacetic acid (100 g/l) were added to 1 ml of plasma for protein precipitation and the mixture was centrifuged (Sorval/model RC2B) at 1100 g for 10 min for plasma separation. Radioisotope activity was estimated by placing 1 ml of plasma in 19 ml distilled water into counting vials. Radioactivity of 32P was measured in a Packard Liquid Scintillation Spectrometer (model 2450B) using Cerenkov radiation.
Faecal samples (1 g) were milled, dried overnight (105°C) and ashed (500°C for 8 h). Concentrated hydrochloric acid (HCl) was added to the ash and P determined by the colorimetric method. For radioactivity measurements, 1 g of ashed faecal sample was dissolved in 18 N H2SO4 and placed in a counting vial (Sarruge & Haag Reference Sarruge and Haag1974). Determination of 32P in urine was made by addition of 1 ml of urine sample to 19 ml distilled water in a counting vial. Inorganic P was determined by the vanadium-molybdenum method (Sarruge & Haag Reference Sarruge and Haag1974). Thirty ml of urine were digested in HCl (12 N), and the material dried at 55°C and thereafter incinerated at 500°C. Mineral matter was diluted in HCl (3 N) and adjusted to 10 ml according to Morse et al. (Reference Morse, Head, Wilcox, Van horn, Hissem and Harris1992).
The Vitti–Dias model
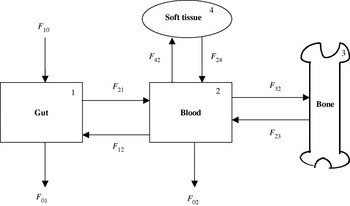
The model by Vitti et al. (Reference Vitti, Kebreab, Lopes, Abdalla, de Carvalho, de Resende, Crompton and France2000), as revised by Dias et al. (Reference Dias, Kebreab, Vitti, Roque, Bueno and France2006), was used in the current study (Fig. 1). It contains four pools: P in (1) gut lumen, (2) plasma, (3) bone, and (4) soft tissue; the flows of P between pools and into and out of the system are shown as arrowed lines. Labelled P was administered intravenously as a single dose at time zero, and the size and specific radioactivity (SRA) of the bone and soft tissue pools were measured after 7 days. The scheme assumes no re-entry of label from external sources. Blood samples were taken from the jugular vein as described earlier.
Schematic representation of the Vitti–Dias model of P metabolism. F ij represents total P flow to pool i from j, F 10 denotes ingestion of P, F 01 excretion of P in faeces, F 02 excretion of P in urine.

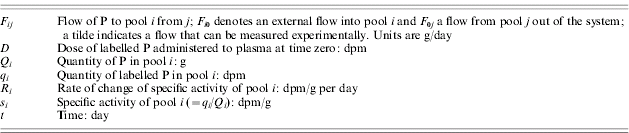
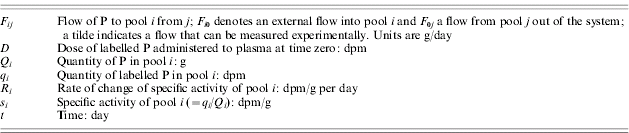
After 7 days, pool 1 (gut lumen) is assumed to be in complete steady state (i.e. isotopic and non-isotopic steady state) and pool 2 (plasma) in non-isotopic steady state. Algebraic solution to the model (see Table 2 and Fig. 1 for principal mathematical notation) then gives (Dias et al. Reference Dias, Kebreab, Vitti, Roque, Bueno and France2006):

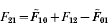





where the tilde indicates an experimentally determined flow, the SRA of the pool formed by combining pools 3 and 4 is

and the rate of change of SRA of pool 2 is

The values of s 2 and R 2 at 7 days were obtained after fitting

to the blood SRA decay curve, where t (day) is time since administration of dose, and a (dpm/g) and b (/day) are parameters. Differentiation of this equation with respect to time gives the instantaneous rate of change

which permits calculation of R 2 at 7 days. The model is solved by computing Eqns (1)–(9). Other relevant calculations include:



In calculating both P d and P a, endogenous P is represented by the flow from plasma to gut (F 12) calculated using Vitti–Dias model.
Principal symbols used in the model
Statistical analysis
The animals were assigned to four treatment groups (four P levels) in a completely randomized design. The data used in the analysis were from 12 animals, three from each level of P intake. A comparison of means between each level was carried out using the general linear models procedure (SAS 1999), with the sources of variation being P concentrations (degrees of freedom of the error=8). The standard error of mean was calculated as variance/√4. Treatment means were assessed using the least significant difference method when overall treatment effects were P<0·05. The model used was Y i=B 0+B 1X i+e i where Y i is the expected outcome for the dependent variable, B 0 the overall intercept across the animals (fixed effect), B 1 is the overall coefficient of P intake (X) and e i is the unexplained residual error. Polynomial orthogonal contrasts were performed using the GLM procedure in SAS. Probability values for linear and quadratic components of the orthogonal contrasts are reported. Cubic contrasts were non-significant in all cases. Standard error of means were obtained using the SAS LSMEANS procedure.
RESULTS AND DISCUSSION
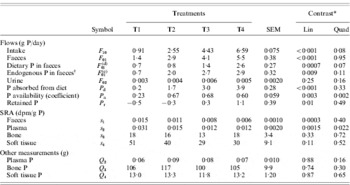
Phosphorus intake (F 10) was different among treatments increasing from T1 through T4 and leading to an increase in total P excreted in faeces (F 01) (Table 3). The correlation is demonstrated by the following equation:

A similar relationship was also reported by Dias et al. (Reference Dias, Kebreab, Vitti, Roque, Bueno and France2006), Vitti et al. (Reference Vitti, Kebreab, Lopes, Abdalla, de Carvalho, de Resende, Crompton and France2000) and Ekelund et al. (Reference Ekelund, Sporndly, Valk and Murphy2005), working with lambs, goats and dairy cows, respectively. A relationship between F 10 and faecal P of dietary origin (F 01(d)) was also found and is given by the equation:

This equation suggests that 1 g/day of dietary P intake would result in 0·50 g/day of dietary P excreted in faeces. It could be assumed from this result that approximately 0·5 of P ingested was available in the current study. Moreover, for zero P intake in Eqn (10), total P excretion in faeces would be 0·88 g/animal/day. This value probably represents excretion of endogenous P (F 01(e)) that is provided for microbial and host animal needs. However, Wu (Reference Wu2005) pointed out that caution should be taken when extrapolating faecal P output to zero intake because the relationship may not be linear if P intake is below requirement. On the other hand, endogenous P excreted by animals on T1 (0·68 g/animal/day), which had the lowest P intake, supports the assertion that minimum endogenous P loss is c. 0·88 g/animal/day as 0·68 is not far removed from 0·88. The value 0·68 g/animal/day corresponds to 30 mg/kg LW/day of endogenous P losses, which is higher than the 20 mg/kg LW/day suggested by the National Research Council (NRC) (1985) as total endogenous losses of P for maintenance, early gestation, and growth. However, there are other factors such as physical form of the diet, dietary crude fibre content, DM intake and ingested P that have to be considered when calculating endogenous P loss (Bravo et al. Reference Bravo, Sauvant, Bogaert and Meschy2003).
Phosphorus measurements and calculations

* Linear and quadratic contrasts. Values are probabilities of significant effect.
† Determined as (SRA faeces/SRA plasma)×faecal P (Lofgreen & Kleiber Reference Lofgreen and Kleiber1953).
Dietary P excreted in faeces (F 01(d)) was similar for all treatments apart from T4, which showed the highest value (Table 3). The proportions of F 01(d) relative to F 10 were 0·78, 0·33, 0·32 and 0·40 for T1, T2, T3 and T4, respectively, leading to the lowest P digestibility for T1, and statistically the same for T2, T3 and T4 (Table 3).
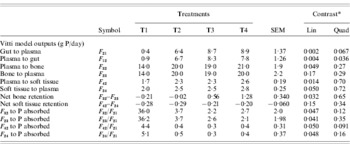
Total P excreted in faeces (F 01) showed the highest value progressively for T4 although endogenous P in faeces was similar for T2, T3 and T4 and lowest for T1 (Table 3). Since F 01 is the sum of F 01(e) and F 01(d), the highest value of F 01 for T4 is a result of highest values of F 01(e) and F 01(d) for this latter treatment.
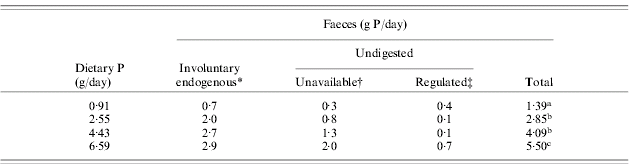
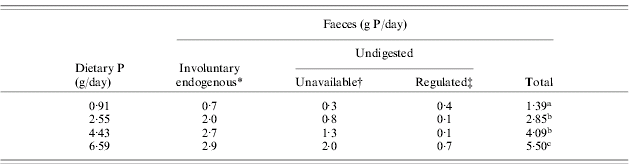
According to Spiekers et al. (Reference Spiekers, Brintup, Balmelli and Pfeffer1993), P excreted in faeces can be divided into three fractions: (1) unavailable dietary P that cannot be absorbed under any conditions, (2) the involuntary loss that has to be excreted under normal physiological and nutritional conditions, and (3) the regulated portion that can range from zero to a large amount, depending on P intake. The faeces distribution proposed by Spiekers et al. (Reference Spiekers, Brintup, Balmelli and Pfeffer1993) was considered and the results are shown in Table 4 with some adaptation regarding involuntary loss which in the present work is represented by endogenous P loss (F 01(e)). Based on Ekelund et al. (Reference Ekelund, Sporndly, Valk and Murphy2003) and NRC (2001), a value of 0·70 for the true absorption coefficient was used for calculating unavailable P and thereafter regulated P. All treatments indicated statistically similar values for regulated P, probably due to a high SEM (0·27). However, animals on T4 gave the highest value for regulated P followed by T1, whereas T2 and T3 gave very low values. If regulated P represents surplus P excreted in faeces when P ingested meets animal needs, then it could be argued that animals on T4 and T1 received P beyond their requirements. This assertion might be valid for T4, where animals received the highest level of P and conceivably more than necessary, but for T1 this assertion does not seem realistic, as T1 provided the lowest P level. It can be inferred that since P from T1 is mainly present in the organic form (the unsupplemented diet), the true absorption coefficient used for this treatment should be lower. Therefore, unavailable P would be higher and consequently regulated P would be lower, giving a more reasonable result.
Phosphorus distribution in faeces based on Spiekers et al. (Reference Spiekers, Brintup, Balmelli and Pfeffer1993)
* Endogenous P excreted in faeces.
† Unavailable P (g/day)=P intake (g/day)×0·30 unavailability.
‡ Regulated P determined as faecal P – unavailable P – endogenous P in faeces.
Within a column, means with different superscript differ (P<0·05).
Although T3 gave a lower value than T4, it is difficult to draw any conclusion based on regulated P because animals on T4 showed the highest value for retained P, similar for P accreted to bone (F 32), suggesting that the surplus P given to the animals was partly used for bone formation. Unlike T3 and T4, the values of retained P were negative for T1 and T2 (Table 3).
With regard to P absorption, P was truly absorbed at 0·23 efficiency for T1, whereas for the other treatments the efficiency was statistically similar at around 0·65. Vitti et al. (Reference Vitti, Kebreab, Lopes, Abdalla, de Carvalho, de Resende, Crompton and France2000) working with goats found 0·10, 0·57 and 0·69 for these low, medium and high P diets, respectively. Despite the different species studied, assessment of both works suggests that the different levels of P provided by T1, T2, T3 and T4 can be considered highly deficient, deficient, slightly deficient and adequate, respectively.
Faecal specific activity (Table 3) reflects the amount of dietary P present in faeces (F 01(d)) since higher values of dietary P dilute radioactive P thereby decreasing specific activity (Kleiber et al. Reference Kleiber, Smith, Ralston and Black1951). The same principle can be applied to plasma specific activity where the tendency for higher values of plasma P (Table 3) probably led to a reduction in plasma specific activity values. There was a significant quadratic effect because the plasma specific activity did not change at high P intakes. However the correlation between specific activities in faeces and plasma and the respective inorganic P present in faeces and plasma was not high. Vitti et al. (Reference Vitti, Kebreab, Lopes, Abdalla, de Carvalho, de Resende, Crompton and France2000) observed greater values for specific activities in plasma and tissue with animals receiving the lowest P level, which also gave lower values for P content in plasma and soft tissue. Thus the work of Vitti et al. (Reference Vitti, Kebreab, Lopes, Abdalla, de Carvalho, de Resende, Crompton and France2000), as was found in the present work, supports the assertion that higher non-radioactive P contents in plasma, bone and soft tissue reduce specific activity and vice versa.
Total P present in plasma, bone and soft tissue were similar for all treatments, possibly due to the short experimental period (Table 3). However, the flows between plasma and soft tissue and between plasma and bone showed differences among treatments. Phosphorus accreted in tissue (F 42) increased with increasing P levels in the diet (Table 5); however, this increase did not have an effect on net tissue retention (Table 5). On the other hand, P accreted in bone (F 32) increased with increasing P levels and probably contributed to the increase in the net bone P retention (Table 5). Despite the lowest values of F 32, F 23, F 42 and F 24 on T1, when these flows are assessed relative to total P absorbed (F 21), the greatest values were obtained for T1 (Table 5) (P<0·005). This suggests that animals on this latter treatment were P deficient, mobilizing P to address body P demands. According to Wu et al. (Reference Wu, Satter, Blohowiak, Stauffacher and Wilson2001), animals deplete their bone reserves to support animal function and bone restores calcium (Ca) and P when surplus minerals are present. Braithwaite (Reference Braithwaite1975) reported that young sheep fed a Ca deficient diet increased their rates of Ca re-absorption from bone, resulting in the release of large amounts of P as a consequence of the link between Ca and P metabolism. The animals used in the current research were growing and it appears that soft tissue turnover increased as P supply increased, which might explain why net P retention in soft tissue was negative for all treatments (Table 5). The lack of difference among net retentions suggests that P level in soft tissue is maintained to meet its minimum metabolic and growth requirements and thereafter any P supplied to these tissues would be diverted to bone. Alternatively, the P content of soft tissue could be changing as the animals age, hence the negative tissue P retention observed in the current study.
Phosphorus outputs from the Vitti-Dias model for sheep fed different P levels

* Linear and quadratic contrasts. Values are probabilities of significant effect.
The role of P from tissue in the maintenance of P metabolism has been observed by some researchers. Ternouth & Budhi (Reference Ternouth and Budhi1996) reported a highly significant increase in the rate of re-absorption of P from the bone and soft tissue in ewes on low P intake in both pregnancy and lactation, supporting the claim that animals are capable of mobilizing P from soft tissue to meet their requirements. Braithwaite (Reference Braithwaite1983) also observed a higher rate of P re-absorption relative to accretion from bone and soft tissue even when the ewes were fed a plentiful supply of dietary P in late pregnancy and early lactation. Phosphorus retention became negative and thereafter positive in mid to late lactation when P was replenished in bone and soft tissue stores. Valk et al. (Reference Valk, Sebek and Beynen2002), studying the influence of P intake on P excretion and blood plasma and saliva concentrations of P in dairy cows, claimed that P could have been mobilized from soft organs and tissues to compensate for its excretion in milk and faeces.
It is worth noting that, in spite of the negative P retention in soft tissue observed in the current study, the values of total P present in soft tissue (between 11·8 and 13·3 g P, Table 3) are close to the value 13·6 g P reported by Ternouth & Sevilla (Reference Ternouth and Sevilla1984) for lambs fed adequate amounts of P.
It might be suggested, therefore, that growing animals mobilize small amounts of P from soft tissue to address bone development until the end of a growth phase, when P in soft tissue is replenished in order to meet their requirements for further development. However, since there are only a few studies that provide information about P flow from soft tissue in growing sheep, this hypothesis requires further investigation.
Phosphorus accreted in bone (F 32) was correlated to: P mobilized from bone (F 23) (Eqn 11), P accreted in soft tissue (F 42) (Eqn 12), and P mobilized from soft tissue (F 24) (Eqn 13), as shown:



These correlations suggest that the signals regulating bone synthesis also regulate bone resorption and soft tissue deposition and resorption. Net bone retention appears to increase linearly as P supply increases while net soft tissue retention remains constant.
Despite differences in F 32 between treatments, F 23 was similar. Ekelund et al. (Reference Ekelund, Sporndly and Holtenius2006) reported that reduced dietary P supply during early lactation did not induce increased bone re-absorption, although reduction in P excreted in faeces and increased apparent P digestibility were observed. The low endogenous P excretion for T1 also suggests a regulation to maintain P for metabolic needs. According to Grace (Reference Grace1981), when ruminants ingest low P levels, the re-absorption of secreted P is an important mechanism in conserving P.
Since higher P intakes provoked higher net bone P retention but also caused higher P excretion, the threshold between providing P to give better performance without causing higher P excretion has to be achieved with caution.
Based on the relationship between P retained (P r) and P intake (F 10) represented by the equation:

the value of F 10 obtained when P r is zero is equal to 3·18 g/animal/day. This value is considered the minimum P requirement for a sheep of body weight 22·6 kg and compares well with the value recommended by Agricultural and Food Research Council (1991) of 3·1 g P/day but is higher than the 2·3 g P/day advocated by NRC (1985) for 20 kg growing sheep. Moreover, extrapolating the equation to zero P intake, retention becomes negative at −0·89 g/day. This latter value is almost identical to the value obtained from Eqn (10), where 0·88 g/day is the amount of P excreted in faeces when intake is zero. Thereby both equations suggest 0·88 g/day as being the involuntary endogenous P loss for growing lambs which draw upon body stores to supply their requirements.
Based on internal P flows as well as the P excretions, specific activities, net retentions, and minimum P requirements obtained, it is concluded that for growing sheep of about 20 kg in body weight, 3·18 g P/animal/day must be supplied at a minimum. This value is higher than P intake on T2 but lower than T3 in the current experiment.
The authors thank Fundacao de Amparo a Pesquisa do Estado de Sao Paulo, Brazil (FAPESP Proc. 03/04792-7) for financial support.
This research was undertaken, in part, thanks to funding from the Canada Research Chairs Program.