Implications
These results quantify the negative effects of diet NDF and body condition score on feed intake of dry cows. They confirm results using different diets in a similar analysis of results from US studies. Reducing diet NDF led to higher dry matter intakes at all stages of the dry period. While physical restriction plays a part in regulating intake at this time, declining feed intake in the final weeks of gestation is at least partly related to a reduced drive to gain body reserves. One reason why feeding strategies designed to avoid this decline in feed intake may not be successful is because they are working against metabolic priorities at this time.
Introduction
Despite a considerable research effort over the last 15 years, there remains some uncertainty in explaining the effects of dry period energy and protein supplements on feed intake, milk production and milk composition in the next lactation (Bell et al., Reference Bell, Burhans and Overton2000; Stockdale and Roche, Reference Stockdale and Roche2002; Friggens et al., Reference Friggens, Andersen, Larsen, Aaes and Dewhurst2004). The immediate effects of dry period feeding on body reserves and feed intake are often central to residual effects on milk yield and composition (Bell et al., Reference Bell, Burhans and Overton2000; Stockdale and Roche, Reference Stockdale and Roche2002; Friggens et al., Reference Friggens, Andersen, Larsen, Aaes and Dewhurst2004). The drive to accumulate body fat in pregnant animals is linked to the need to produce enough milk fat to support the offspring (Pond, Reference Pond1984). Friggens et al. (Reference Friggens, Andersen, Larsen, Aaes and Dewhurst2004) showed that residual effects of dry period feeding on milk protein percentage are correlated with residual effects on feed intake.
The decline in feed intake in late gestation is an area of particular interest, because it is difficult to understand in the context of increasing requirements for the developing conceptus and other tissues at this time (Agricultural Research Council, 1980). The decline in feed intake over the last 3 to 4 weeks of the dry period ranged from 0% to 30% when the 1- to 2-day period immediately before parturition was ignored in the literature review presented by Stockdale and Roche (Reference Stockdale and Roche2002). There are two main explanations proposed for the decline in feed intake at this time – increased physical restriction associated with the mass of the developing conceptus and metabolic regulation associated with the transition to lactation. It seems likely that both factors are involved, possibly in an additive way (Forbes, Reference Forbes1987).
Ingvartsen et al. (Reference Ingvartsen, Friggens and Faverdin1999) discussed evidence for a cycle of body condition targets at different stages of the lactation/ reproduction cycle. They suggested that there are metabolic targets for moderate loss of body reserves in late gestation and early lactation, even when cows are well fed. The transition to targeting loss of body reserves appears to occur over the final weeks before parturition and may explain some of the variation in intake declines at this time. Ingvartsen et al. (Reference Ingvartsen, Dewhurst and Friggens2003) further provided examples of the health and productivity losses associated with abnormal body mobilisation, particularly in early lactation.
The aim of this study is to use a regression modelling approach to understand the effect of diet and animal factors on forage intake in the dry period. The series of dry period feeding experiments conducted at Aberystwyth provides a data set to investigate relationships further. A similar analysis was conducted using results from several US research centres (Hayirli et al., Reference Hayirli, Grummer, Nordheim and Crump2003). Almost all of the US studies used diets based on maize or lucerne forages with concentrates. In contrast, the studies included in this analysis were based on grass silage-based forages (grass silages or mixtures of grass silage with barley straw) without concentrates.
Material and methods
Results were taken from six experiments conducted with a total of 160 multiparous autumn-calving cows over consecutive years. Details of experimental procedures and results of individual experiments have been reported previously (Dewhurst et al., Reference Dewhurst, Moorby, Dhanoa, Evans and Fisher2000a, Reference Dewhurst, Davies and Fisher2000b, Reference Dewhurst, Davies and Fisher2001, Reference Dewhurst, Moorby, Dhanoa and Fisher2002 and Reference Dewhurst, Davies and Fisher2009; Moorby et al., Reference Moorby, Dewhurst, Evans and Fisher2002).
Animals and dry period diets
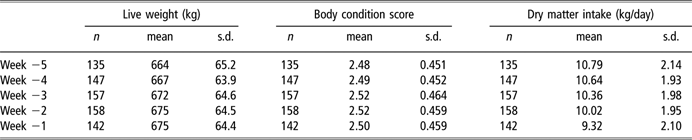
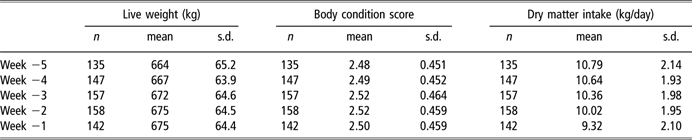
All experiments involved Holstein–Friesian cows, approaching their second or subsequent calving. A summary of the live weight, body condition score (BCS) and forage intake results is presented, according to weeks before calving, in Table 1. This analysis used treatment groups that received the same forage-only diet for at least the final 5 weeks of the dry period. Treatment groups that were fed concentrates or changed forage during the dry period were excluded.
Live weight, body condition score and dry matter intake values used in the regression analysis
Recordings
A new research dairy unit was built during the course of this work; both units had cubicle housing. The first three experiments (Dewhurst et al., Reference Dewhurst, Moorby, Dhanoa, Evans and Fisher2000a and Reference Dewhurst, Moorby, Dhanoa and Fisher2002; Moorby et al., Reference Moorby, Dewhurst, Evans and Fisher2002) used the old unit with feed intakes recorded through Calan gates with fresh feed offered daily and refusals collected three times weekly. The new unit was used for the final three experiments, and feed intakes were recorded automatically using the roughage intake control system of Insentec BV (Marknesse, The Netherlands). Cows were moved to calving pens approximately 1 day before calving, and feed intake was not recorded in this period. Average intakes for each of the 5 weeks before calving were calculated retrospectively, working back in 7-day blocks from the actual calving date. The average time spent in the calving pens before calving was less than 1 day. Forage intakes are expressed on an oven dry matter (DM) basis (drying at 100°C until constant weight) to be consistent with the analysis of Hayirli et al. (Reference Hayirli, Grummer, Nordheim and Crump2003).
Cow weights were recorded weekly at the same time of day (starting at 1030 h) using an electronic scale, and weekly BCS was the average of values recorded at the tail and loin sites using the 0 to 5 scale of Mulvany (Reference Mulvany1977). Forage sampling and analysis procedures are described in the papers related to individual experiments (Dewhurst et al., Reference Dewhurst, Moorby, Dhanoa, Evans and Fisher2000a, Reference Dewhurst, Davies and Fisher2000b, Reference Dewhurst, Davies and Fisher2001, Reference Dewhurst, Moorby, Dhanoa and Fisher2002 and Reference Dewhurst, Davies and Fisher2009; Moorby et al., Reference Moorby, Dewhurst, Evans and Fisher2002). Feed analysis is expressed on an oven DM basis (drying at 100°C until constant weight).
Statistical analysis
A preliminary analysis of correlations between DM intake (expressed as a percentage of current live weight), BCS and forage composition (NDF and crude protein (CP)) was conducted to identify variables (BCS and NDF) to use in further single and multiple regression analysis. Regression analyses were conducted separately for each of the 5 weeks before parturition, as well as for the average DM intake recorded for each cow over this period. All of the regression analysis used values from individual cows and the models did not include ‘Experiment’ as a predictor. The statistical analysis was all conducted using the Genstat 10 statistical package (Lawes Agricultural Trust, 2007).
Results
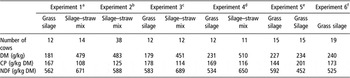
On average, the cows in these studies gained 11 kg live weight over the final 4 weeks of gestation, whilst showing no change from an average BCS of 2.5. Forage DM intake declined by 13.5% over this same period, with around half of the decline occurring in the final week, even excluding the period in calving pens (Table 1). The small increase in live weight meant that the decline in DM intake expressed as a percentage of live weight was 15%. A summary of the DM, CP and NDF content of forages, expressed on an oven DM basis (100°C), is provided in Table 2. The wide range of diet NDF concentrations, from 452 to 689 g/kg DM is evident. Additional analysis, including fermentation products is provided in the individual papers describing these experiments.
Number of cows receiving each of the forages, as well as dry matter, CP and NDF content of the grass silages and grass silage/barley straw mixtures used in this study

DM = dry matter.
aDewhurst et al. (Reference Dewhurst, Moorby, Dhanoa, Evans and Fisher2000a).
bDewhurst et al. (Reference Dewhurst, Moorby, Dhanoa and Fisher2002).
cMoorby et al. (Reference Moorby, Dewhurst, Evans and Fisher2002).
dDewhurst et al. (Reference Dewhurst, Davies and Fisher2000b).
eDewhurst et al. (2009).
fDewhurst et al. (Reference Dewhurst, Davies and Fisher2001).
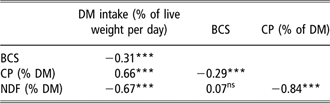
The correlations between DM intake, BCS and diet composition (CP and NDF) in week −5 are shown in Table 3. The individual relationships between DM intake and BCS and forage NDF are shown in Tables 4 and 5, respectively. The negative relationship between BCS and DM intake from weeks −5 to −2 was weak, but nonetheless significant given the number of individual measurements included in the analysis. This effect disappeared during week −1. There was a highly significant negative relationship between forage NDF and forage CP, so only forage NDF was used in the subsequent multiple regression analysis (Table 6). The fit for the multiple regression equation predicting DM intake from BCS and forage NDF for each cow, over the final 5 weeks of the dry period (R 2 = 0.61) is shown in Figure 1.
Simple correlation between chemical composition of feeds and dry matter intake (as a percentage of live weight) at week −5 (n = 135)
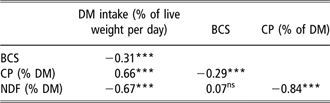
DM = dry matter; BCS = body condition score; ns = not significant; ***P < 0.001.
Coefficients (with s.e. in parentheses) from least-squares linear regression equations for prediction of forage dry matter (DM) intake (percentage of current live weight) from forage NDF (g/kg DM); DM intake (percentage of live weight per day) = a + b NDF

***P < 0.001.
Coefficients (with s.e. in parentheses) from least-squares linear regression equations for prediction of forage dry matter (DM) intake (percentage of current live weight) from body condition score (BCS); DM intake (percentage of live weight per day) = a + b BCS

ns = not significant; ***P < 0.001.
Coefficients (with s.e. in parentheses) from least-squares multiple linear regression equations for prediction of forage dry matter (DM) intake (percentage of current live weight) from body condition score (BCS) and forage NDF (g/kg DM); DM intake (percentage of live weight per day) = a + b BCS + c NDF

**P < 0.01; ***P < 0.001.
Prediction of individual DM intake (percentage of live weight) from BCS and forage NDF, over the final 5 weeks of the dry period (n = 160; R 2 = 0.61; further details of the relationship are given in Table 6).

There was little effect on the coefficients and significance levels when the regressions were conducted using either a fixed live weight (at week −3) for each cow (as was used in the analysis by Hayirli et al., Reference Hayirli, Grummer, Nordheim and Crump2003) or using only the 119 cows that had no missing values for live weight, BCS or forage intake.
Discussion
The average live weight gain of these cows over the final month of gestation was 390 g/day, with no change in BCS. This compares with Agricultural Research Council (1980) estimate of 675 g/day increase in the gravid uterus over this period, suggesting that on average there was some mobilisation of maternal reserves in support of the developing conceptus. The average decline in DM intake over this period was in the middle of the range reported previously, with the steeper decline close to calving also consistent with other studies (Stockdale and Roche, Reference Stockdale and Roche2002).
Effect of diet NDF on intake
The negative correlation between forage NDF and CP was the result of both the changing composition of grass with advancing maturity (increased NDF and decreased CP), as well as the effect of including barley straw (high NDF; low CP) in forage mixtures. The grass silages and mixtures of grass silage with barley straw had NDF concentrations ranging from 452 to 689 g/kg DM, which overlaps with the top half of the range in the experiments included by Hayirli et al. (Reference Hayirli, Grummer, Nordheim and Crump2003). Their diets were based mainly on lucerne and maize forages with NDF ranging from 280 to 622 g/kg DM. There were highly significant effects of both forage NDF content and cow BCS, confirming both physical and metabolic control of DM intake. The overall effects of BCS and forage NDF on DM intake were very similar to those observed in the US studies modelled by Hayirli et al. (Reference Hayirli, Grummer, Nordheim and Crump2003). The magnitude of the effect of forage NDF on DM intake did not change over the period from weeks −5 to −1. This does not provide any evidence for the involvement of physical fill in the large decline in feed intake at this time. The negative effect of diet NDF on DM intake was larger in these studies (coefficients averaged −0.00292) than in the work of Hayirli et al. (Reference Hayirli, Grummer, Nordheim and Crump2003) (coefficient −0.002). This may reflect the greater rumen filling effect of NDF from grass in comparison with legume NDF (Dewhurst et al., Reference Dewhurst, Fisher, Tweed and Wilkins2003).
Effect of BCS on intake
During the period from 2 to 5 weeks before calving, the coefficients relating intake to BCS were remarkably similar to the value reported by Hayirli et al. (Reference Hayirli, Grummer, Nordheim and Crump2003). The coefficients relating DM intake as a percentage of live weight to BCS suggest that an increase of 1 unit BCS was equivalent to 74, 70, 95 and 86 kg of live weight in weeks −5 to −2, respectively. Estimates of the live weight equivalent of 1 unit BCS vary widely, partly because of problems with handling variation in both BCS and live weight in regression analysis. Fox et al. (Reference Fox, Van Amburgh and Tylutki1999) used a grouping approach to reduce this problem, and estimated that 1 unit BCS is equivalent to 85 kg live weight, which is close to the values calculated above. The implication of this is that DM intakes in weeks −5 to −2 were approximately proportional to the fat-free mass of cows. There remains considerable uncertainty around these estimates and they do not preclude a lipostatic effect in addition to that, which would be predicted by working on the basis of fat-free mass.
The cause of the decline in feed intake over this period has been related to the change in priorities of the cows from gaining to mobilising body reserves (Ingvartsen et al., Reference Ingvartsen, Friggens and Faverdin1999). Increasing levels of oestrogens in late gestation may be hormonal mediators of this effect (Forbes, Reference Forbes1987). It is interesting that the effect of BCS on DM intake was greatly reduced in the week before calving and this may be due to these hormonal changes overriding the lipostatic mechanisms. There are a number of potential interactions between intake level, body reserves and steroid hormones, including the dilution of fat-soluble steroid hormones among increased amounts of body fat (Burke et al., Reference Burke, Hampton, Staples and Thatcher1998) and the effects of intake on hepatic blood flow and clearance of steroid hormones (Sangsritavong et al., Reference Sangsritavong, Combs, Sartori, Armentano and Wiltbank2002).
Conclusion
Overall, these results provide strong support for the effects of diet NDF and BCS on dry period intakes established by Hayirli et al. (Reference Hayirli, Grummer, Nordheim and Crump2003). The similarity of the relationships across quite different feeding systems is reassuring, whereas the different extent of the effect of NDF may reflect the different types of NDF. Although physical factors clearly affect feed intake, with lower intakes of bulky feeds, there was no evidence for any increase in such restriction as calving approached. The decline in feed intake in late gestation probably was not a result of physical constraints, but may have resulted from a change in metabolic priorities away from increasing body reserves.
Acknowledgements
The financial support of DEFRA and the Milk Development Council for this work is gratefully acknowledged.