1 Introduction
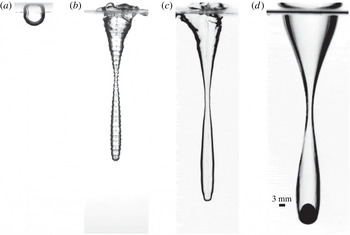
The water entry of solid bodies and liquid entering liquid, in the form of droplets or continuous jets, has been studied extensively (Worthington & Cole Reference Worthington and Cole1900; May & Woodhull Reference May and Woodhull1948; Engel Reference Engel1966; Duclaux et al. Reference Duclaux, Caillé, Duez, Ybert, Bocquet and Clanet2007; Aristoff & Bush Reference Aristoff and Bush2009; Truscott, Epps & Techet Reference Truscott, Epps and Techet2012; Mansoor et al. Reference Mansoor, Marston, Vakarelski and Thoroddsen2014; Truscott, Epps & Belden Reference Truscott, Epps and Belden2014). In some cases, the subsurface air cavities formed by liquid jets and solid bodies (e.g. spheres) are remarkably similar (figure 1 c,d). While a single liquid droplet forms a much shallower cavity (figure 1 a), a stream of multiple millimetre-sized droplets impacting in rapid succession can form deep, narrow cavities resembling those formed by solid spheres and continuous jets (figure 1 b). In this paper, we investigate the water entry of such multiple droplet streams, characterizing the cavity physics and drawing comparisons with jet and sphere water entry.
Images of several cavity shapes created by various impacting bodies. (a) The maximum cavity size from a single droplet impacting a pool of water (
 $d=3.39~\text{mm}$
,
 $U=2.14~\text{m}~\text{s}^{-1}$
). (b–d) Cavity shape just prior to pinch-off for cavities created by: (b) a multi-droplet stream (
 $d=1.53~\text{mm}$
,
 $f=2500~\text{Hz}$
,
 $U_{s}=6.17~\text{m}~\text{s}^{-1}$
); (c) a jet (
 $d=1.17~\text{mm}$
,
 $U_{s}=6.07~\text{m}~\text{s}^{-1}$
); and (d) a hydrophobic sphere (
 $d=9.53~\text{mm}$
,
 $U=2.43~\text{m}~\text{s}^{-1}$
). Scale bar applies to all images.

Prior research on liquid and solid-body water entry has shown that cavity dynamics may be influenced by inertial, gravitational, viscous and/or surface tension effects depending on the scales involved in the problem (Truscott et al.
Reference Truscott, Epps and Belden2014). The relative importance of these effects is characterized by the Bond number (
 $Bo=\unicode[STIX]{x1D70C}gL^{2}/\unicode[STIX]{x1D70E}$
), the Weber number (
 $We=\unicode[STIX]{x1D70C}U^{2}L/\unicode[STIX]{x1D70E}$
), the Froude number (
 $Fr=U^{2}/gL$
) and the Reynolds number (
 $Re=\unicode[STIX]{x1D70C}UL/\unicode[STIX]{x1D707}$
), where
 $\unicode[STIX]{x1D70C}$
is the fluid density,
 $g$
is the acceleration of gravity,
 $\unicode[STIX]{x1D70E}$
is the surface tension,
 $L$
is a length scale (specified for our study in § 3),
 $U$
is the impact velocity and
 $\unicode[STIX]{x1D707}$
is the fluid dynamic viscosity.
Previous studies on single-droplet impact inform our study on multi-droplet cavity formation. Research on single droplets impacting a deep pool has found several areas of focus, with the objective to understand the underwater sound of rain (Franz Reference Franz1959; Oguz & Prosperetti Reference Oguz and Prosperetti1990), spray creation (Yarin Reference Yarin2006) and near-surface air entrainment (Thoroddsen, Etoh & Takehara Reference Thoroddsen, Etoh and Takehara2003). Engel (Reference Engel1966, Reference Engel1967) studied the cavity formation of large droplets (droplet diameter
 $d_{d}=4.5~\text{mm}$
) impacting at high velocities (above
 $9~\text{m}~\text{s}^{-1}$
) and predicted the cavity depth by equating the kinetic energy of the droplet to the potential energy of the cavity formed. Rodriguez & Mesler (Reference Rodriguez and Mesler1988) found that the fall height and shape of the droplet at impact affect the cavity shape. Leng (Reference Leng2001), Morton, Rudman & Jong-Leng (Reference Morton, Rudman and Jong-Leng2000), Cole (Reference Cole2007) and Ray, Biswas & Sharma (Reference Ray, Biswas and Sharma2015) characterized a range of cavity behaviours, including jet formation, vortex ring formation, coalescence, bubble entertainment and splash dome-over, using
 $We$
and
 $Fr$
to classify the physics.
The cavity physics associated with liquid jets impacting liquid pools is quite different from single-droplet impact. When a continuous jet of water impacts normal to an initially quiescent free surface, the impact forms a cavity that is driven deeper into the pool by the jet. The evolution of this cavity can include many features of rigid-body impact as indicated in figure 1(c,d). The current study focuses on the initial impact of a jet onto a quiescent free surface up until the cavity collapses. Several common topics persist in studies on cavity-forming jet impacts. Cavity dimensions, including the final depth of the cavity, the depth of pinch-off and the cavity radius, are most prominently discussed by Oguz, Prosperetti & Kolaini (Reference Oguz, Prosperetti and Kolaini1995) and Zhu, Oğuz & Prosperetti (Reference Zhu, Oğuz and Prosperetti2000). They find that the final cavity depth and the pinch-off depth are functions of the Froude number and that the cavity radius is approximately twice the jet radius. Most studies agree that the downward cavity velocity is equal to one-half the jet velocity (Birkhoff & Zarantonello Reference Birkhoff and Zarantonello1957; Oguz, Prosperetti & Lezzi Reference Oguz, Prosperetti and Lezzi1992; Oguz et al. Reference Oguz, Prosperetti and Kolaini1995; Zhu et al. Reference Zhu, Oğuz and Prosperetti2000; Qu et al. Reference Qu, Goharzadeh, Khezzar and Molki2013) but Kersten, Ohl & Prosperetti (Reference Kersten, Ohl and Prosperetti2003) and Soh, Khoo & Yuen (Reference Soh, Khoo and Yuen2005) argue to the contrary. A few studies also discuss the motion and deformation of the jet fluid after impact, showing that it coats the surface of the cavity (Oguz et al. Reference Oguz, Prosperetti and Kolaini1995; Zhu et al. Reference Zhu, Oğuz and Prosperetti2000; Kersten et al. Reference Kersten, Ohl and Prosperetti2003; Soh et al. Reference Soh, Khoo and Yuen2005). It is worth noting that, following the transients associated with jet impact onto a quiescent pool, steady-state air entrainment may occur at later times if the jet is allowed to continuously flow into the pool (Lorenceau, Quéré & Eggers Reference Lorenceau, Quéré and Eggers2004; Kiger & Duncan Reference Kiger and Duncan2012).
Bick et al. (Reference Bick, Ristenpart, van Nierop and Stone2010) performed one of the first studies on multi-droplet impact in which they examined the bubble entrainment caused by the impact of the first two droplets created from a jet undergoing breakup. They found that bubble entrainment is affected by droplet diameter, impact velocity and timing between impacts. Hurd et al. (Reference Hurd, Fanning, Pan, Mabey, Bodily, Hacking, Speirs and Truscott2015) were among the first to show that, if the temporal frequency of the multi-droplet stream is high enough, sequential droplets hitting the free surface in the same place create nested cavities, with each successive droplet forming a cavity at the base of the preceding cavity. They named this a ‘matryoshka’ cavity, after the Russian nesting dolls. We will also refer to the nested cavities created by multi-droplet impacts as matryoshka cavities. Bouwhuis et al. (Reference Bouwhuis, Huang, Chan, Frommhold, Ohl, Lohse, Snoeijer and van der Meer2016) studied the same event for micrometre-sized droplets impacting with frequencies in the range of 10–30 kHz using boundary integral simulations with some experimental data for validation. In the regime studied, they showed that the expansion of the cavity is driven by inertia, but the collapse of the cavity is governed by surface tension (i.e. low
 $Bo$
). They also showed that the downward cavity velocity approaches jet-like behaviour as the spacing between the droplets decreases. Finally, they suggested that the maximum cavity radius and cavity depth at pinch-off scale with a modified
 $We$
. We show that their scaling only applies to one type of cavity seal (shallow seal) and does not generalize to our extensive experimental dataset (appendix A).
The existing body of work on rigid-body impact has shown a variety of cavity shapes depending on the parameter space (Truscott et al.
Reference Truscott, Epps and Belden2014). The depth of the cavity at pinch-off and the pinch-off time have been found to be functions of
 $We$
and
 $Bo$
(Duclaux et al.
Reference Duclaux, Caillé, Duez, Ybert, Bocquet and Clanet2007; Aristoff & Bush Reference Aristoff and Bush2009). Aristoff & Bush (Reference Aristoff and Bush2009) found four pinch-off types, which all fall into distinct locations on a
 $Bo$
–
 $We$
plot. At the lowest
 $We$
, they describe quasi-static seal, in which pinch-off occurs on or very near the sphere surface. As
 $We$
increases, shallow seal is seen, in which a much larger cavity forms that collapses near the pool surface under the influence of surface tension. Increasing
 $We$
results in deep seal, where the cavity pinches off approximately halfway between the surface and the sphere due to hydrostatic pressure. At the highest
 $We$
, a surface seal occurs, wherein the splash created upon impact collapses due to air pressure and surface tension (Marston et al.
Reference Marston, Truscott, Speirs, Mansoor and Thoroddsen2016), sealing off the cavity from further air entrainment and separating the cavity from the pool surface. Bouwhuis et al. (Reference Bouwhuis, Huang, Chan, Frommhold, Ohl, Lohse, Snoeijer and van der Meer2016) revealed a shallow seal cavity type formed by successive micro-droplets similar to that formed by rigid-sphere impact (Aristoff & Bush Reference Aristoff and Bush2009). On the other hand, prior work on impacting liquid jets has observed only deep seal closure modes (Oguz et al.
Reference Oguz, Prosperetti and Lezzi1992, Reference Oguz, Prosperetti and Kolaini1995; Zhu et al.
Reference Zhu, Oğuz and Prosperetti2000; Kersten et al.
Reference Kersten, Ohl and Prosperetti2003; Soh et al.
Reference Soh, Khoo and Yuen2005; Qu et al.
Reference Qu, Goharzadeh, Khezzar and Molki2013). However, one might ask if impacting jets and multi-droplet streams can produce all of the cavity seal types observed for rigid-sphere entry. Further, we suggest that other types of cavity seal exist that are unique to multi-droplet streams.
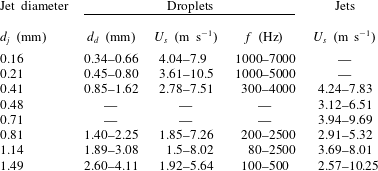
The aim of this experimental study is to investigate the dynamics of cavities created from multi-droplet streams and jets of water impacting on a deep pool. We explore multi-droplet and jet impacts over a much larger parameter space than has previously been investigated. The parameter ranges of multi-droplets and jets (table 1) span the dimensionless numbers
 $Bo\sim O(10^{-2}{-}10^{0})$
,
 $We\sim O(10{-}10^{3})$
,
 $Fr\sim O(10^{2}{-}10^{4})$
and
 $Re\sim O(10^{3}{-}10^{4})$
. These ranges suggest that for our experiments surface tension, gravitational and inertial forces are important, but viscous effects are negligible. The experiments reveal that
 $We$
and
 $Bo$
scaling separate the cavity regimes and show that multi-droplet stream cavities are consistent with those formed by continuous jets. These cavity types encompass those seen previously for solid-sphere entry, with three additional types for multi-droplet streams.
Experimental parameter ranges for each jet diameter
 $d_{j}$
(figure 2
a).

2 Experimental set-up and description
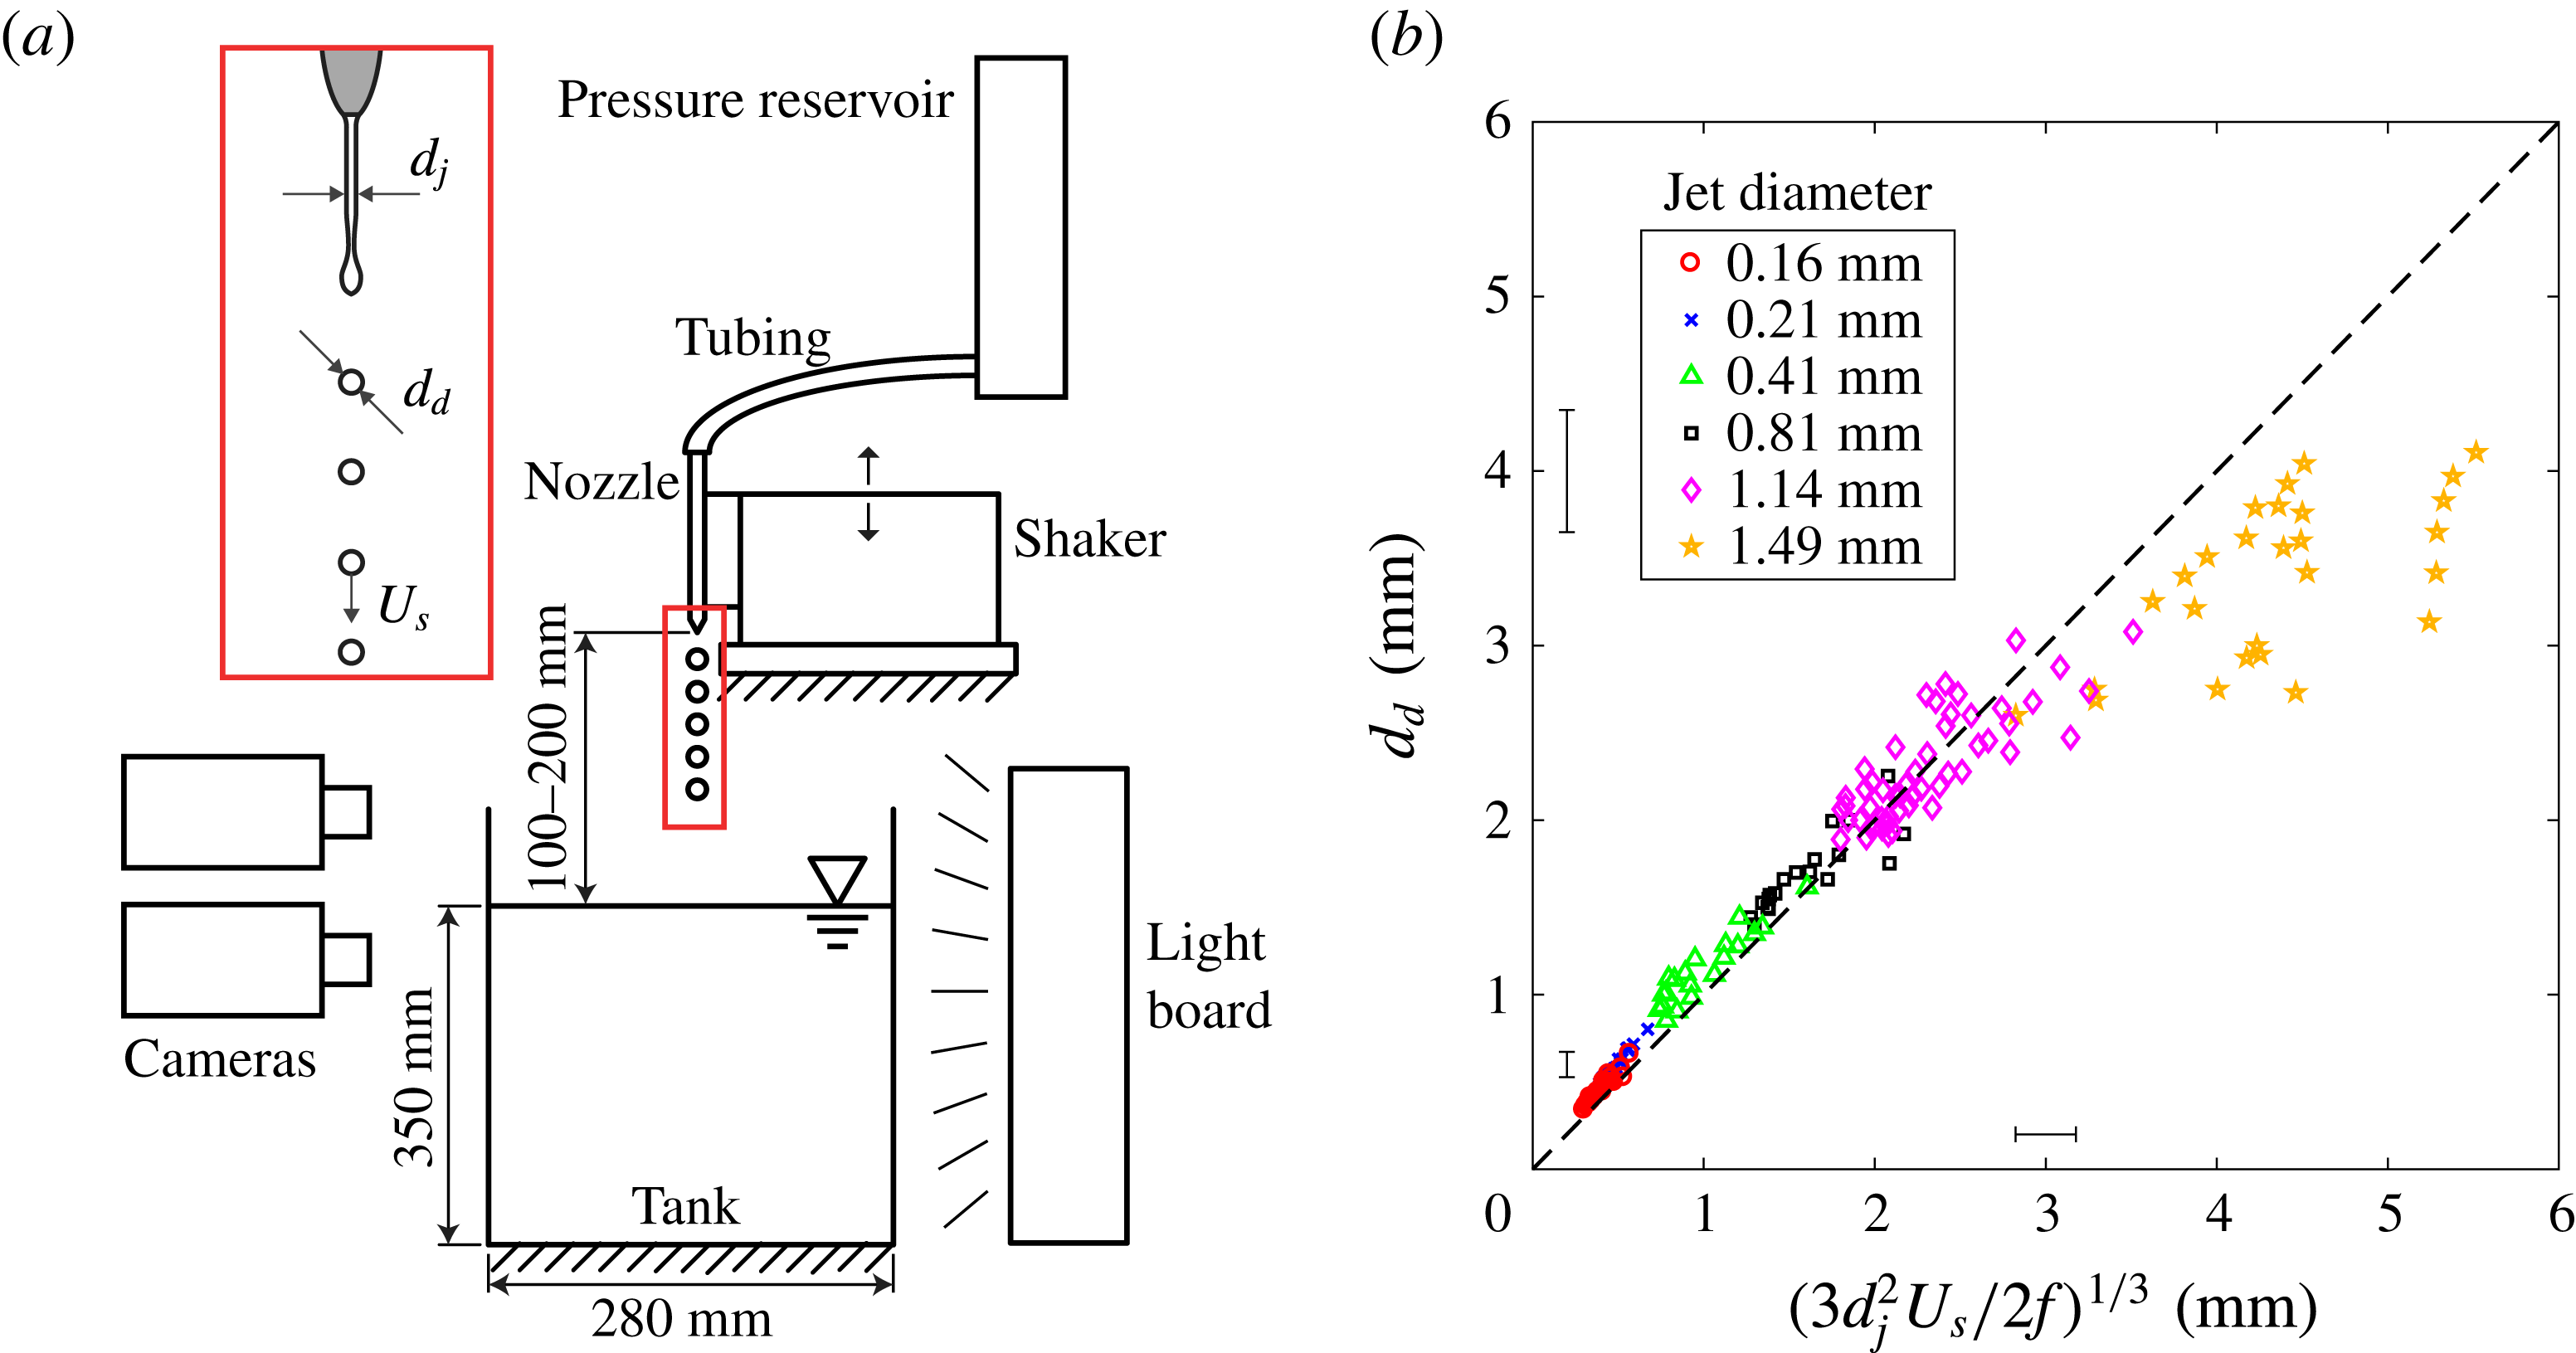
Figure 2(a) shows the experimental set-up used for this study. A nozzle is placed
 $100{-}200~\text{mm}$
above a tank of water that is
 $730~\text{mm}\times 280~\text{mm}\times 350~\text{mm}$
. Water flows to the nozzle through tubing that connects to a pressure reservoir that controls the velocity of the water exiting the nozzle. The nozzle forms a continuous stream, which is captured in a reservoir to prevent it from hitting the surface of the bath. We then remove the reservoir and allow the stream to fall continuously throughout the experiment. This method cannot control the length of the stream nor the final number of droplets. The diameter of the water jet
 $d_{j}$
(figure 2
a) is varied by changing the nozzle diameter. The velocity of the jet exiting the nozzle (
 $U_{s}$
) is measured by imaging
 $50~\unicode[STIX]{x03BC}\text{m}$
tracer particles that are mixed with the water; the average velocity across the jet profile is reported herein. The cavity velocity (
 $U_{c}$
) is measured by tracking the bottom of the cavity over time and fitting a line to the data;
 $U_{c}$
is taken as the slope of this line. In order to create multi-droplet streams with droplet diameter
 $d_{d}$
, the nozzle is attached to a large shaker with adjustable frequency
 $f$
and amplitude to induce jet breakup as shown in figure 2(a). The impact of the jet and droplet streams is viewed at 6000 frames per second using two high-speed cameras. One images below the surface to capture characteristics of the air cavity. The other views above the surface, from which diameters, velocities and frequencies of droplets are measured. These measurements reveal that the velocity of jets or droplets just prior to impact with the free surface are equal for a given nozzle diameter and water flow rate; this impact velocity is referred to as
 $U_{s}$
.
The achievable output parameters for multi-droplet streams (i.e. frequency, droplet diameter and velocity) are interrelated. Figure 2(b) and table 1 show the range of combinations of
 $f$
,
 $d_{d}$
and
 $U_{s}$
that can be produced for each nozzle diameter. The relationship of these variables can be derived from conservation of mass, yielding
 $$\begin{eqnarray}d_{d}=\left(\frac{3d_{j}^{2}U_{s}}{2f}\right)^{1/3}.\end{eqnarray}$$
This relationship is shown by the dashed line in figure 2(b). The data follow this prediction very well except for the largest jet diameter (
 $d_{j}=1.49~\text{mm}$
), for which satellite droplets are formed but often land away from the stream impact location, thus reducing the average volume of the main droplets in the stream. Note that, owing to limitations of the set-up, not all combinations of
 $d_{d}$
,
 $f$
and
 $U_{s}$
can be achieved.
(a) Schematic of the experimental set-up, with the inset indicating the mechanism for producing multi-droplet streams via jet breakup. The velocity of droplets
 $U_{s}$
has been observed experimentally to be largely constant over the fall height, and is equal to the jet velocity. (b) The diameter of droplets (
 $d_{d}$
) in the multi-droplet streams is controlled by the nozzle diameter (
 $d_{j}$
), stream velocity (
 $U_{s}$
) and shaker frequency (
 $f$
) (2.1). For a given nozzle diameter, the droplet diameter increases with decreasing
 $f$
and increasing
 $U_{s}$
.

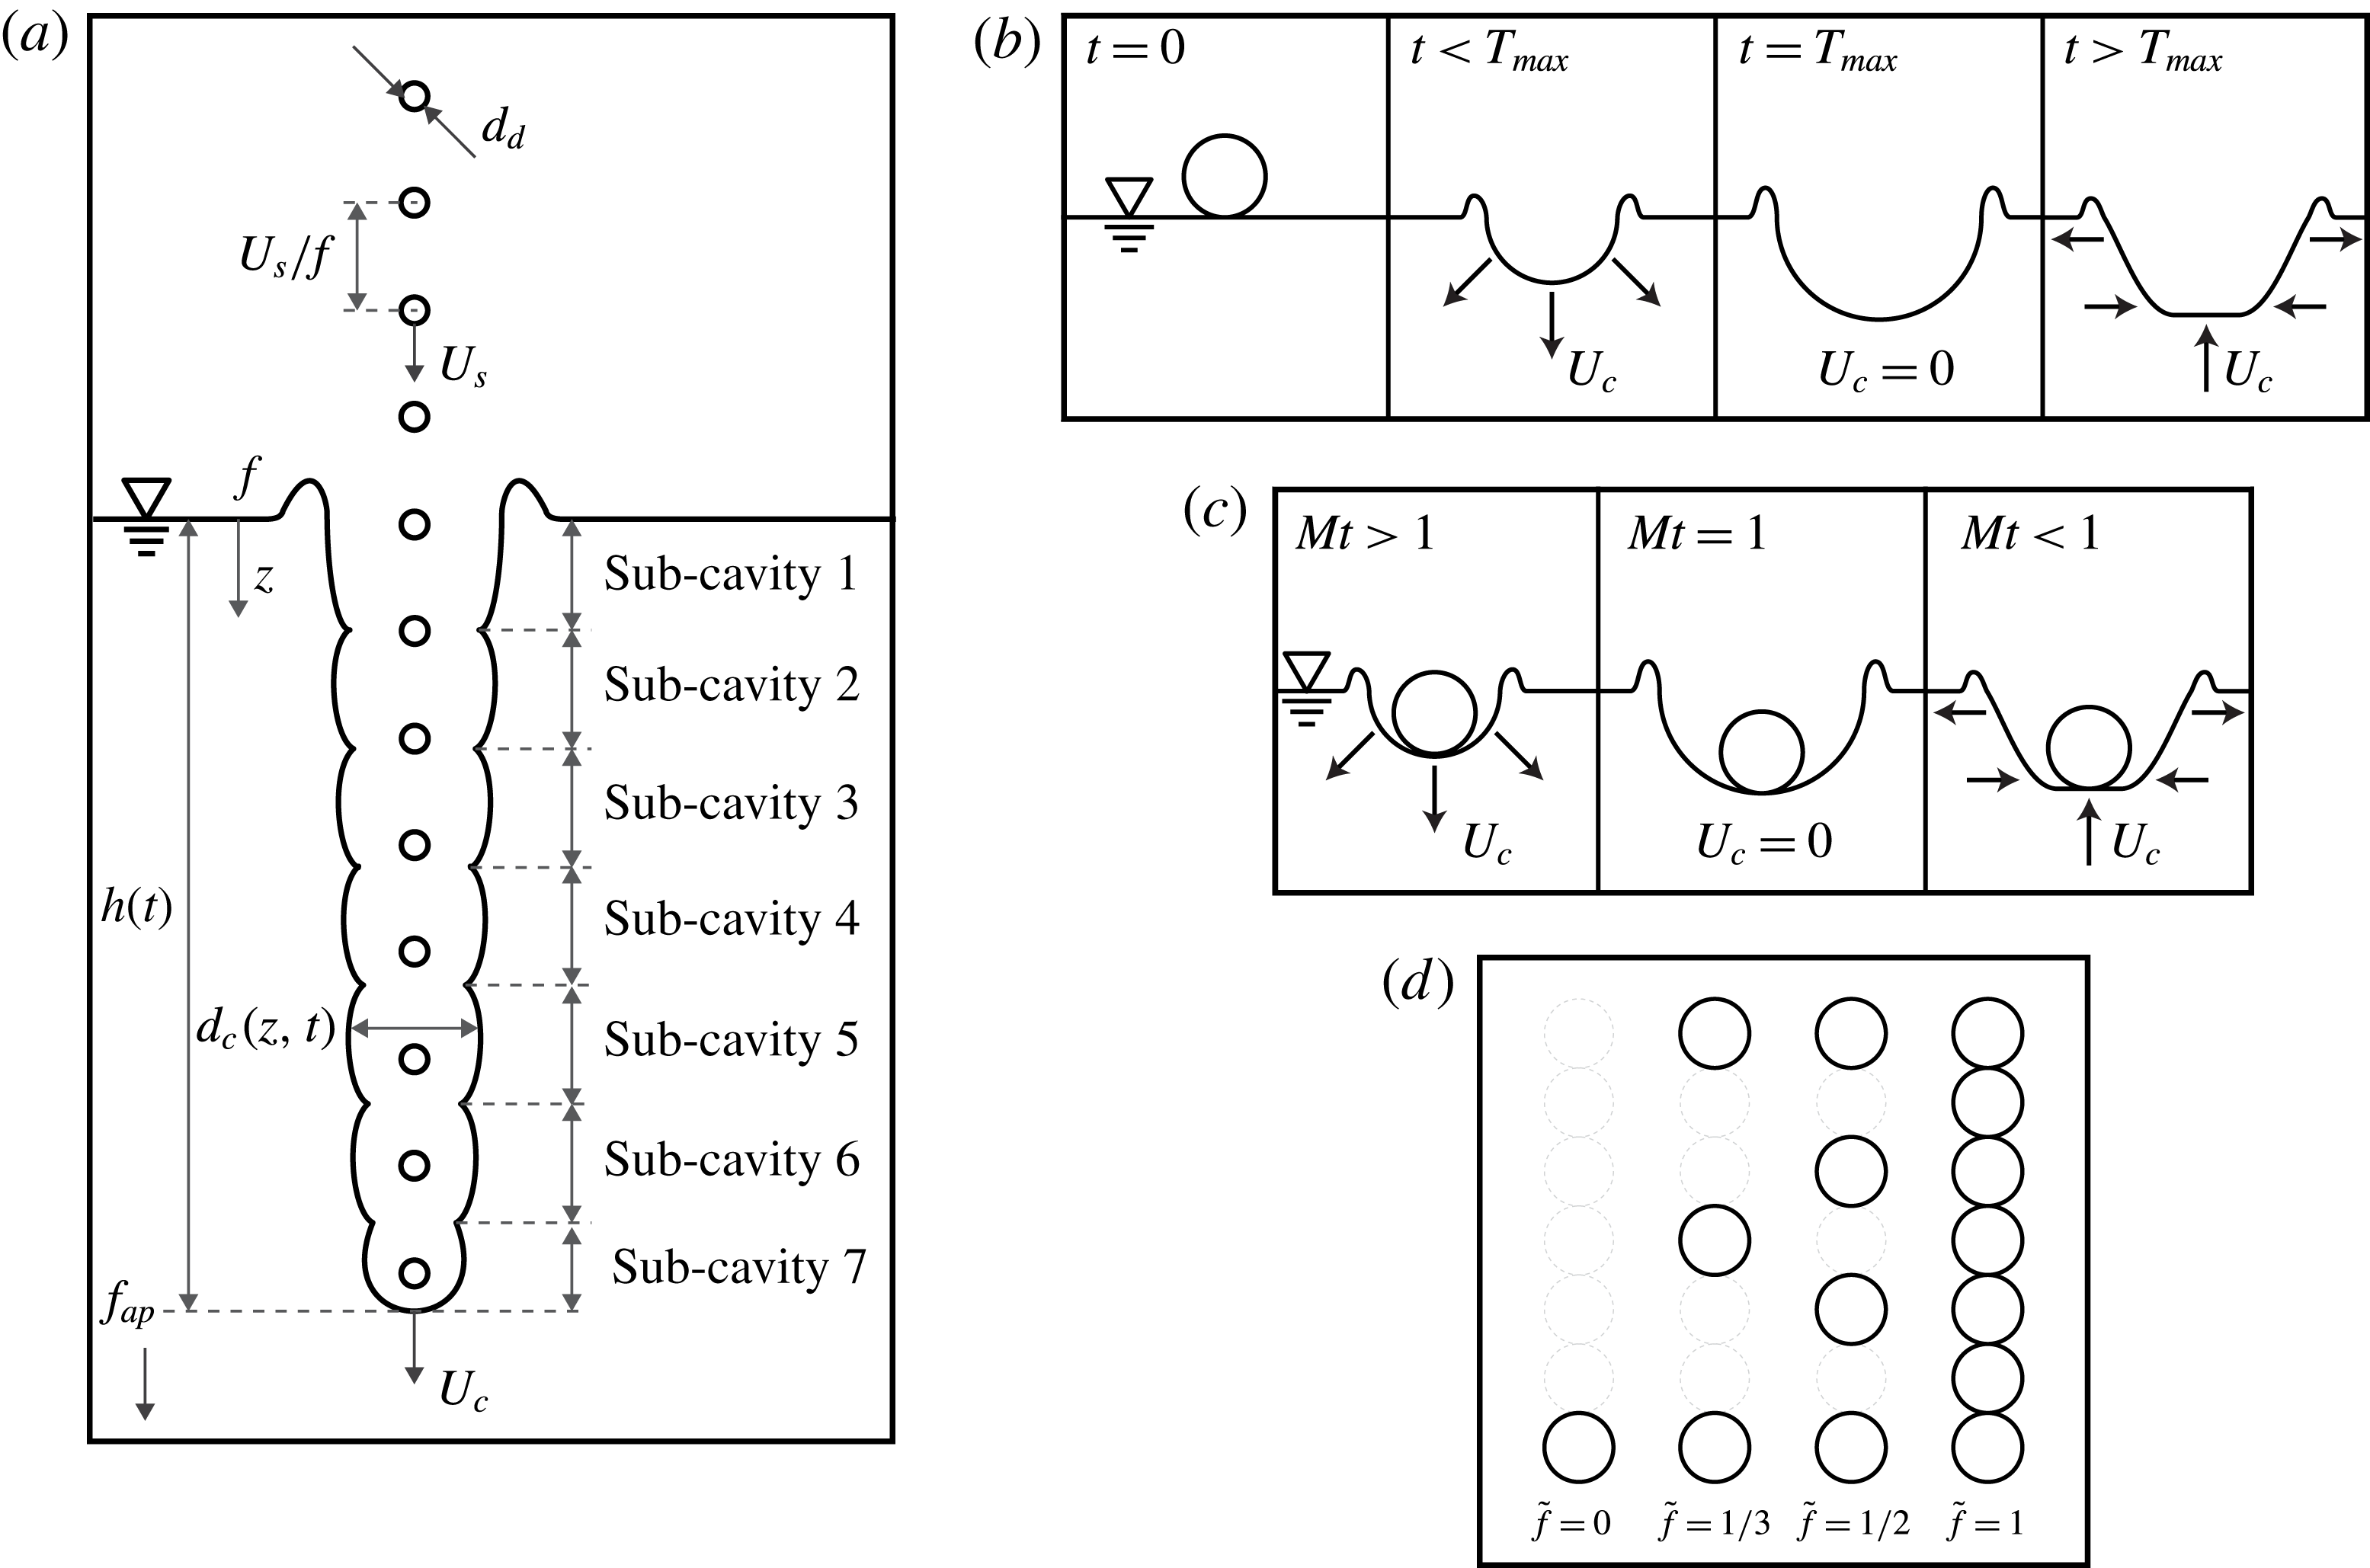
(a) An idealized cavity created by a multi-droplet stream consists of several sub-cavities. (b) A single-droplet impact causes the cavity to expand at velocity
 $U_{c}$
. The time of maximum cavity size (
 $T_{max}$
) corresponds to
 $U_{c}=0$
; for
 $t>T_{max}$
the cavity is collapsing. (c) The matryoshka number (
 $Mt$
) is defined by the timing of the impact of the second droplet with respect to the maximum cavity size of the first. For example, for
 $Mt=1$
the second droplet impacts the cavity at
 $T_{max}$
. (d) The dimensionless frequency
 $\tilde{f}=fd_{d}/U_{s}$
defines the ratio of droplet diameter to spacing between droplets.

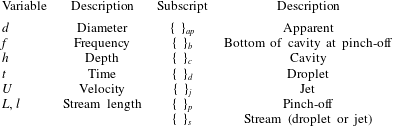
List of variables and their description.
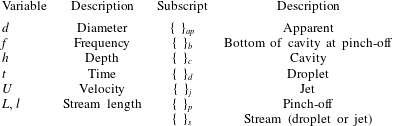
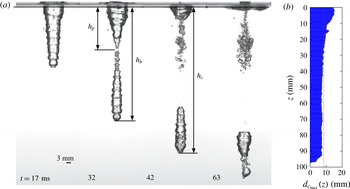
Figure 3(a) shows an ideal matryoshka cavity created by a multi-droplet stream with relevant parameters given in table 2. The droplet spacing can be defined as
 $U_{s}/f$
, where
 $f$
is the frequency of the droplet stream in the laboratory reference frame and is equivalent to the shaker frequency. The cavity geometry is defined by the depth from the undisturbed free surface
 $h(t)$
and the cavity diameter
 $d_{c}(z,t)$
. Additionally, there are three important cavity depths associated with relevant events. The first two can be seen in figure 4(a) at time 32.0 ms when pinch-off occurs. The depth at which cavity seal or pinch-off occurs is denoted
 $h_{p}$
. The depth of the bottom of the cavity at this time will be denoted as
 $h_{b}$
. After all of the droplets from the stream have impacted and expanded the bottom of the cavity, a new cavity depth is reached,
 $h_{c}$
(figure 4 at
 $t=42.0~\text{ms}$
).
(a) Four images from the impact of a multi-droplet water stream onto a pool of water. The pinch-off frame is shown at
 $t=32~\text{ms}$
, with
 $h_{p}$
indicating the depth of the pinch-off point and
 $h_{b}$
indicating the depth of the cavity at this time. At
 $t=42~\text{ms}$
all of the droplets from the multi-droplet stream have impacted the cavity base, creating a depth of
 $h_{c}$
. At
 $t=63~\text{ms}$
all of the droplets from the downward jet created at pinch-off have impacted the cavity. (b) The maximum cavity diameter over time is measured at discrete depths, yielding
 $d_{c_{max}}(z)$
. The average of these maximum diameters over all depths defines
 $d_{c}$
(red dotted line).

For droplet streams impacting with low frequency,
 $f$
, we will show that there is a dependent non-dimensional number that can help define the cavity regimes discussed more in § 3.1. We coin this useful non-dimensional parameter the ‘matryoshka number’ and define it as
 $$\begin{eqnarray}Mt=f_{ap}T_{max},\end{eqnarray}$$
where
 $f_{ap}$
is the apparent frequency between droplet impacts and
 $T_{max}$
is the time it takes for a cavity from a single droplet to reach maximum size. The apparent frequency experienced by the droplets impacting the bottom of the cavity is
 $f_{ap}=(1-U_{c}/U_{s})f<f$
, where
 $U_{c}$
and
 $U_{s}$
are depicted in figure 3(a). Measured values of
 $U_{c}$
and
 $U_{s}$
from image-based tracking methods are used to calculate
 $f_{ap}$
directly from experiments. When a single-droplet impacts a pool of water, it creates a cavity, which expands radially outwards from the point of impact. Time
 $T_{max}$
occurs when the maximum cavity size is reached (figure 3
b). Leng (Reference Leng2001) studied single-droplet cavity formation and provided equations for estimating
 $T_{max}$
(
 $T_{max}=0.524(d_{d}/U_{s})Fr^{0.625}$
), which we use for all cases where
 $Mt>10$
. When
 $Mt<10$
our own single-droplet impact data were taken and the measured value of
 $T_{max}$
used to calculate
 $Mt$
. More accurate values of
 $T_{max}$
are required at low
 $Mt$
since the measured versus predicted values of
 $T_{max}$
can vary by up to a factor of two or three. Given the equations for
 $T_{max}$
and
 $f_{ap}$
above, it is important to note that
 $Mt$
is a dependent non-dimensional parameter, as
 $f_{ap}$
and
 $T_{max}$
are functions of
 $Fr$
,
 $\unicode[STIX]{x1D70C}^{\prime }$
,
 $\tilde{f}$
(defined below),
 $d_{d}$
,
 $U_{s}$
and
 $f$
. Nevertheless,
 $Mt$
is useful for classifying certain cavity types, especially cavities that occur when
 $Mt<4$
, as will be shown (§ 3.1).
To give more physical intuition to the significance of
 $Mt$
, consider the phenomena depicted in figure 3. The individual impacts of successive droplets divide the cavity into multiple sub-cavities. As the first droplet impacts the pool, it creates a portion of the matryoshka cavity labelled sub-cavity 1. The second droplet creates sub-cavity 2, the third creates sub-cavity 3, and so on (figure 3
a). If droplets in a multi-droplet stream impact the bottom of the matryoshka cavity while the lowest sub-cavity is expanding, then
 $Mt>1$
(figure 3
c). If droplets impact exactly at the time of momentum reversal of the lowest sub-cavity, then
 $Mt=1$
; and if droplets impact after the momentum of the sub-cavity has already reversed, then
 $Mt<1$
. The matryoshka number can be thought of as the number of droplets that impact the bottom of the matryoshka cavity before the cavity from a single-droplet impact has reached its maximum size.
A second important dimensionless frequency, denoted
 $\tilde{f}$
by Bouwhuis et al. (Reference Bouwhuis, Huang, Chan, Frommhold, Ohl, Lohse, Snoeijer and van der Meer2016), is the ratio of droplet diameter to the centre-to-centre spacing between droplets,
 $\tilde{f}=fd_{d}/U_{s}$
, taking the same form as the Strouhal number. As explained by Bouwhuis et al. (Reference Bouwhuis, Huang, Chan, Frommhold, Ohl, Lohse, Snoeijer and van der Meer2016) and shown in figure 3(d), if
 $\tilde{f}=1$
droplets touch end to end, and the stream is reminiscent of a jet. If
 $\tilde{f}=1/3$
, a third of the droplets remain in the stream. As
 $\tilde{f}$
approaches zero, the droplets in the stream become separated by such a large distance that by the time the second droplet impacts the cavity has already become a flat surface again.
2.1 Uncertainty
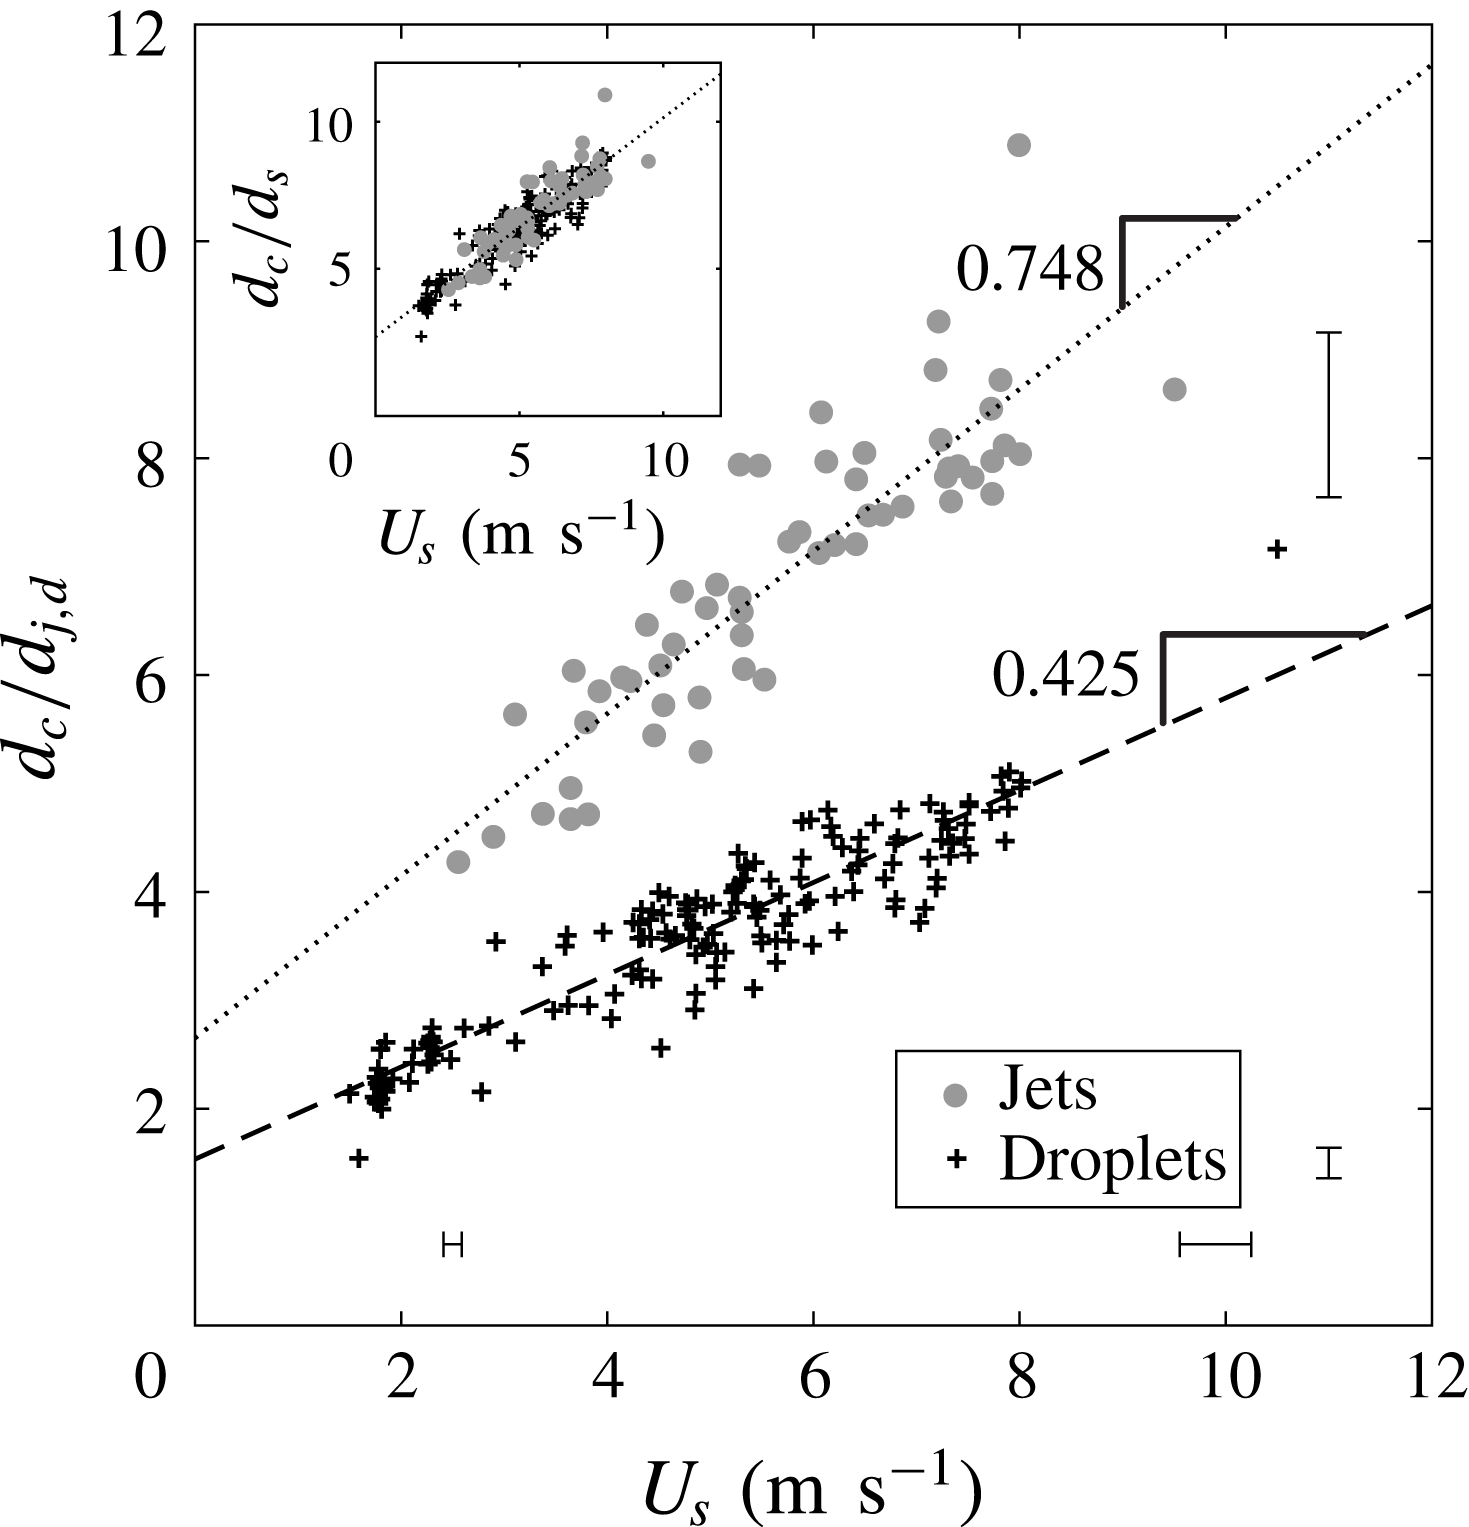
Uncertainty in all image-based measurements are calculated and the uncertainty bands in the figures represent the 95 % confidence interval of the measurement (Coleman & Steele Reference Coleman and Steele2009). The uncertainty in calculated variables was often found to increase linearly with the variable. Where applicable, two bands are placed on the extremes of the axes of a figure to show that the error is linearly increasing (e.g. figure 5); when only one band is present, the mean uncertainty is shown.
Normalizing cavity diameter (
 $d_{c}$
) by jet diameter (
 $d_{j}$
) collapses the jet data onto a line that is a function of impact velocity (
 $U_{s}$
). A line with different slope and intercept is found for multi-droplet cases. We define a modified droplet diameter
 $d_{d}^{\ast }=d_{d}/1.75$
, which collapses the normalized cavity diameter data onto a single line for multi-droplet and jet streams (inset).

3 Cavity formation
The basic sequence of events involved in a multi-droplet stream impact can be seen in figure 4(a) and supplementary movie 1 (available at https://doi.org/10.1017/jfm.2018.204). As the first droplet hits the free surface, a hemispherical cavity is formed. The next droplet impacts the base of the first cavity, causing it to expand downwards. This process continues until the cavity pinches together on the droplet stream, sealing it off from more incoming droplets. Even after this pinch-off event occurs, droplets in the lower portion of the cavity continue impacting the bottom, pushing it deeper into the pool while maintaining roughly the same volume since pinch-off. Once all of the droplet stream has impacted, droplets formed from the downward jet created at pinch-off will continue to impact the cavity bottom, pushing it even deeper into the pool. These droplets created from the downward jet are usually much less consistent in diameter and trajectory and thus cause the cavity to evolve in a much more chaotic manner. Our experimental observations conclude that the downward jet does not affect the droplet stream as it forms after the stream has passed the pinch-off point and has a velocity less than or approximately equal to the stream velocity (e.g. supplementary movies 1 and 7). This sequence of events is similar for the impact of a jet (supplementary movie 2).
Figure 5 shows that the ratio of the cavity diameter to jet or droplet diameter increases linearly with impact velocity. Oguz et al. (Reference Oguz, Prosperetti and Kolaini1995) and Zhu et al. (Reference Zhu, Oğuz and Prosperetti2000) claim that
 $d_{c}/d_{j}$
is constant around 2.41 for jets, irrespective of impact velocity. This finding is inconsistent with the data presented here, but could be explained by the small velocity ranges studied in those works,
 $0.88{-}2.64~\text{m}~\text{s}^{-1}$
and
 $0.96{-}1.87~\text{m}~\text{s}^{-1}$
, respectively.
The cavity diameter produced by jets is always larger than the cavity diameter formed by multi-droplet streams at the same velocity (figure 5). We find a common factor of approximately 1.75 by taking the ratio of the least-squares regressions of the jet data to the multi-droplet data. Because the cavity diameter affects other cavity dynamics, such as the relative magnitude of the gravitational, inertial and surface tension forces, we will include this scaling factor by defining a modified droplet diameter of
 $d_{d}^{\ast }=d_{d}/1.75$
. The inset of figure 5 shows that this rescaling collapses the multi-droplet data onto the curve for jets, where
 $d_{s}=d_{d}^{\ast }$
for droplets and
 $d_{s}=d_{j}$
for jets. Based on this empirical finding, we redefine the Bond, Weber and Froude numbers of the multi-droplet streams as
 $Bo^{\ast }=\unicode[STIX]{x1D70C}gd_{s}^{2}/\unicode[STIX]{x1D70E}$
,
 $We^{\ast }=\unicode[STIX]{x1D70C}U_{d}^{2}d_{s}/\unicode[STIX]{x1D70E}$
and
 $Fr^{\ast }=U_{d}^{2}/gd_{s}$
, respectively. For the remainder of the paper, we may use the
 $^{\ast }$
symbol for jets and droplets for ease of discussion, but when used for jets the
 $d_{j}$
is not modified. While we are currently unable to offer an analytic explanation for the factor of 1.75, the empirical evidence shows self-consistency within our wide-ranged experimental dataset.
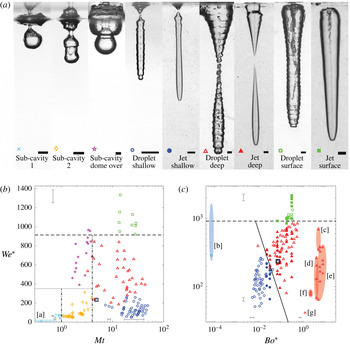
Given previous work on the water impact of spheres (Aristoff & Bush Reference Aristoff and Bush2009), one might expect different classes of cavities to form for multi-droplet impact, depending on the parameter regime. Indeed, Bouwhuis et al. (Reference Bouwhuis, Huang, Chan, Frommhold, Ohl, Lohse, Snoeijer and van der Meer2016) observed cavities formed by micro-droplet streams that are best described as shallow seal. Here we observe six distinct cavity types, three occurring for multi-droplet streams at low matryoshka number, and three more that occur for both droplet streams and jets (figure 6
a). The first three occur only when droplets impact close to the maximum cavity size of the preceding sub-cavity (i.e. when
 $Mt\sim O(1)$
). In these cases, sub-cavities maintain some independence from the matryoshka cavity as a whole and their independent behaviour determines when and where cavity seal will occur. Thus, we call them sub-cavity seals. The other three occur for both droplet streams and jets and are the same type of cavity seals or pinch-offs as observed by Aristoff & Bush (Reference Aristoff and Bush2009) for hydrophobic spheres at low Bond number. We will discuss each of these in turn.
(a) Multi-droplet streams produce six cavity seal types, three of which – shallow seal, deep seal and surface seal – are common to jet streams and rigid-sphere impact. Scale bars at the bottom of each image are 3 mm. (b) The six cavity seal types for multi-droplet streams can be separated by an
 $Mt$
–
 $We^{\ast }$
regime diagram. The horizontal dashed line represents the lowest
 $We$
found by Franz (Reference Franz1959) for which dome-over occurs for a single droplet (line also shown in panel (c); note that
 $We$
from Franz (Reference Franz1959) has been modified using
 $d_{d}^{\ast }$
). Sub-cavity 1 collapse occurs only for
 $Mt<1$
, while sub-cavity 2 collapse occurs only between
 $1<Mt<4$
. Sub-cavity dome-over occurs for
 $We^{\ast }\gtrsim 350$
and
 $Mt<4$
; the horizontal dotted line is to guide the eye. (c) Shallow seal, deep seal and surface seal are better sorted on a
 $Bo^{\ast }$
–
 $We^{\ast }$
plot. The solid line is found by equating the dimensionless pinch-off times for deep and shallow seal (3.1). Using the modified diameter
 $d_{d}^{\ast }$
causes the cavity seal regime boundaries to align for multi-droplet and jet streams. Data from previous studies are plotted and match the expected cavity seal regimes: [a] Bick et al. (Reference Bick, Ristenpart, van Nierop and Stone2010), [b] Bouwhuis et al. (Reference Bouwhuis, Huang, Chan, Frommhold, Ohl, Lohse, Snoeijer and van der Meer2016), [c] Qu et al. (Reference Qu, Goharzadeh, Khezzar and Molki2013), [d] Zhu et al. (Reference Zhu, Oğuz and Prosperetti2000), [e] Soh et al. (Reference Soh, Khoo and Yuen2005), [f] Kersten et al. (Reference Kersten, Ohl and Prosperetti2003) and [g] Oguz et al. (Reference Oguz, Prosperetti and Lezzi1992). Symbols and data are the same for all figures throughout the paper.

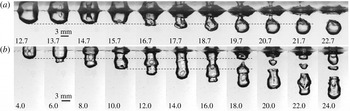
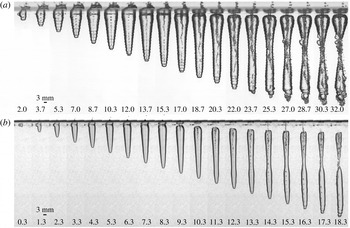
Two types of sub-cavity collapse: (a) sub-cavity 1 collapse and (b) sub-cavity 2 collapse. (a) For
 $Mt<1$
, the second droplet impacts the cavity at
 $t=14.7~\text{ms}$
after sub-cavity 1 has begun to collapse (
 $f=80~\text{Hz}$
,
 $U_{s}=1.77~\text{m}~\text{s}^{-1}$
,
 $d_{d}=3.08~\text{mm}$
,
 $We^{\ast }=77$
,
 $Bo^{\ast }=0.4$
,
 $Mt=0.88$
and
 $\tilde{f}=0.14$
). The dashed line indicates the location of the bottom of sub-cavity 1 at its maximum depth. (b) For
 $1<Mt<4$
, the second droplet impacts the first sub-cavity at
 $t=4.0~\text{ms}$
, the third droplet impacts at
 $t=10.0~\text{ms}$
and so on. The overall cavity is still expanding when each successive droplet impacts the cavity, thus enabling the cavity to grow larger in the vertical direction (
 $f=300~\text{Hz}$
,
 $U_{s}=1.80~\text{m}~\text{s}^{-1}$
,
 $d_{d}=2.18~\text{mm}$
,
 $We^{\ast }=56$
,
 $Bo^{\ast }=0.21$
,
 $Mt=1.55$
and
 $\tilde{f}=0.36$
). The cavity collapse occurs just below the bottom of sub-cavity 1 but above the bottom of sub-cavity 2. Dashed lines indicate the bottoms of sub-cavities 1 and 2 just prior to impact by the subsequent droplet. Numbers at the bottom of each frame indicate the time after initial impact in milliseconds. Corresponding positions in the regime diagrams can be seen in figure 6(b). Movies for (a) and (b) are shown in supplementary movies 3 and 4, respectively.

3.1 Sub-cavity collapse
As shown in figure 3(b), as a single droplet impacts the water surface it creates a cavity that expands downwards and radially outwards from the point of impact (Engel Reference Engel1966). After reaching its maximum size, the bottom of the cavity collapses radially inwards and upwards while the top widens under the flattening influence of surface tension. When
 $Mt<1$
, the momentum of the first sub-cavity has already reversed and is in the upward direction by the time the second droplet impacts its base (figure 7
a,
 $t=14.7~\text{ms}$
). Upon impact the second droplet spreads and transfers downward momentum to the cavity but only over the small area that it impacts. The rest of the first sub-cavity is not impacted by the second droplet and continues its upward collapse while the second sub-cavity expands downwards (figure 7
a,
 $t=16.7{-}20.7~\text{ms}$
). These opposing velocities cause sub-cavities 1 and 2 to separate from each other (figure 7
a,
 $t=21.7~\text{ms}$
). In this case cavity seal always occurs between the undisturbed free surface and the bottom of sub-cavity 1 and hence we will call this type of cavity seal sub-cavity 1 collapse.
If we maintain
 $We^{\ast }\lesssim 350$
and increase the matryoshka number,
 $1<Mt<4$
, each successive droplet impacts while the preceding sub-cavity is still expanding downwards (figure 7
b,
 $t=4~\text{ms}$
). This gives the droplet more time to spread over the base of the sub-cavity, transferring the momentum to a larger area and counteracting the impending momentum reversal in the vertical direction, in contrast to
 $Mt<1$
. Although this transfers downward momentum it does not counteract the impending momentum reversal in the radial direction. The pinch-off location is determined by which sub-cavity is first to collapse (1 or 2). The difference between sub-cavities 1 and 2 is in the boundary conditions. The top of sub-cavity 1 resides on the free surface, which allows it to widen for a longer time. The widening of the top of sub-cavity 1 combined with the expansion of the bottom due to the impact of the second droplet delays the collapse of sub-cavity 1. On the other hand, the top of sub-cavity 2 is driven radially inwards by surface tension and hydrostatic pressure, resulting in a collapse time that is sufficiently small to pinch off before sub-cavity 1 (figure 7
b,
 $t=18~\text{ms}$
). In this regime (
 $1<Mt<4$
,
 $We^{\ast }\lesssim 350$
) pinch-off always occurs between the bottoms of sub-cavity 1 and 2. Hence, we call this pinch-off type sub-cavity 2 collapse.
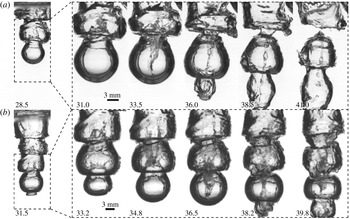
Two cases of sub-cavity dome-over. When
 $Mt<4$
and
 $We^{\ast }\gtrsim 350$
splash crowns form at the base of each sub-cavity and sometimes dome over. (a) When
 $Mt$
is at the lower end of this range, the cavity fully pinches off at the dome-over positions detaining further droplets from entering into the lower portion of the cavity (
 $f=100~\text{Hz}$
,
 $U_{s}=4.41~\text{m}~\text{s}^{-1}$
,
 $d_{d}=3.42~\text{mm}$
,
 $We^{\ast }=527$
,
 $Bo^{\ast }=0.52$
,
 $Mt=1.84$
and
 $\tilde{f}=0.08$
). (b) As
 $Mt\rightarrow 4$
, droplets break through the sub-cavity dome-overs, reopening the cavity and preventing a full pinch-off (
 $f=200~\text{Hz}$
,
 $U_{s}=5.45~\text{m}~\text{s}^{-1}$
,
 $d_{d}=3.76~\text{mm}$
,
 $We^{\ast }=886$
,
 $Bo^{\ast }=0.63$
,
 $Mt=3.27$
and
 $\tilde{f}=0.14$
). Numbers at the bottom of each frame indicate the time after impact in milliseconds. The first image in each sequence shows a zoomed-out view of the cavity and each following image shows a zoomed-in view of the cavity of the area indicated by the dashed box. Corresponding positions in the regime diagrams can be seen in figure 6(b). Movies for (a) and (b) are shown in supplementary movies 5 and 6, respectively.

Increasing
 $We^{\ast }$
above 350 while maintaining
 $Mt<4$
, we see in figure 8 that a splash crown forms at the bottom of each sub-cavity upon impact by the subsequent droplet. When conditions are right, the splash crown of each sub-cavity will collapse inwards on itself and dome over, sealing off air flow between sub-cavities. We call this event sub-cavity dome-over. In figure 8(a) we examine a cavity with
 $Mt=1.84$
and
 $We^{\ast }=527$
. At
 $t=31~\text{ms}$
the splash crown at the base of the second sub-cavity is about to dome over. At 33.5 ms a droplet has impacted this dome-over event, morphing into a downward-moving splash. Meanwhile the bottom of sub-cavity 2 continues its upward motion and the cavity collapses inwards near the dome-over event, eventually leading to a full pinch-off that detains further droplets from entering into the lower portion of the cavity
 $(t=36{-}41~\text{ms})$
.
We see different behaviour looking at a case with a slightly higher
 $Mt$
, but still below 4. In figure 8(b) at 33.2 ms the splash crown at the base of the third sub-cavity domes over. As the next droplet continues downwards, it breaks through this domed-over splash crown and morphs into a downward-moving splash
 $(t=34.8~\text{ms})$
, which then impacts the dome-over event at the base of the next sub-cavity, sub-cavity 4
 $(t=34.8{-}36.5~\text{ms})$
. Because
 $Mt$
is higher than the previous case, the sub-cavities have insufficient time to collapse. Hence, incoming droplets continue to break through each sub-cavity dome-over event and the cavity eventually pinches off with a deep seal, as discussed below in § 3.2, and seen in supplementary movie 6. The division between these three sub-cavity regimes can be seen on the
 $Mt$
versus
 $We^{\ast }$
plot shown in figure 6(b). Note that for
 $Mt<4$
and
 $We^{\ast }>914$
, it is unclear if the sub-cavity dome-over regime persists; however, based on the work of Franz (Reference Franz1959), we suspect that sub-cavity 1 would begin to dome over in this region, effectively producing a surface seal.
3.2 Sphere-like cavity collapse
When
 $Mt>4$
, the cavity velocity becomes more stable (§ 4) and the matryoshka cavity assumes a more continuous form as droplets impact in rapid succession on newly formed sub-cavities. In this regime the three different types of cavity seals, seen for both multi-droplet streams and jets, are best shown on a
 $Bo^{\ast }$
–
 $We^{\ast }$
plot in figure 6(c). These three cavity seal types are also seen in the water entry of hydrophobic spheres (Aristoff & Bush Reference Aristoff and Bush2009) and thus we call them sphere-like cavity seals.
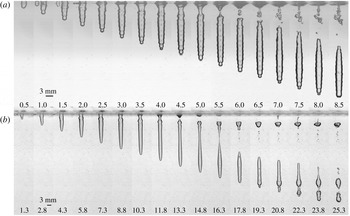
Shallow seal shown for two stream types. A capillary wave forms near the surface and travels downwards until pinch-off occurs at a depth of the order of the capillary length. (a) A cavity created by a multi-droplet stream pinches off with a shallow seal for small
 $Bo^{\ast }$
(
 $f=6000~\text{Hz}$
,
 $U_{s}=6.39~\text{m}~\text{s}^{-1}$
,
 $d_{d}=0.39~\text{mm}$
,
 $We^{\ast }=128$
,
 $Bo^{\ast }=0.0069$
,
 $Mt=39.7$
and
 $\tilde{f}=0.37$
). (b) A cavity created by a jet experiences first shallow and then deep seal (
 $U_{s}=5.78~\text{m}~\text{s}^{-1}$
,
 $d_{j}=0.41~\text{mm}$
,
 $We^{\ast }=190$
and
 $Bo^{\ast }=0.023$
). After shallow seal pinch-off, the jet is perturbed and begins to break up into a droplet stream from the Rayleigh–Plateau instability (
 $t\geqslant 14.8~\text{ms}$
). Numbers at the bottom of each frame indicate the time after impact in milliseconds. Corresponding positions in the regime diagrams can be seen in figure 6(b,c). Movies for (a) and (b) are shown in supplementary movies 7 and 8, respectively.

The first of the sphere-like cavities occurs at the lowest
 $We^{\ast }$
and
 $Bo^{\ast }$
and is called shallow seal. Figure 9 shows an image sequence of this event for a multi-droplet stream and a jet. As the droplet stream or jet impacts, a long narrow cylindrical cavity forms. A capillary wave forms near the surface, which travels down the cavity walls, eventually causing it to pinch together at a depth of the order of the capillary length, as shown at 5.5 ms in figure 9(a) for a droplet stream and at 13.3 ms in figure 9(b) for a jet. This is the same sequence of events as described by Aristoff & Bush (Reference Aristoff and Bush2009) for shallow seal of cavities created by small spheres. This event is dominated by capillary forces, as described by the small
 $Bo^{\ast }$
for which it occurs. Although not specifically called shallow seal in their paper, this is the experimental regime that Bouwhuis et al. (Reference Bouwhuis, Huang, Chan, Frommhold, Ohl, Lohse, Snoeijer and van der Meer2016) studied. Following the shallow seal event, the cavity may experience a deep seal pinch-off as shown in figure 9(b) at 16.3 ms.
An interesting phenomenon that can occur for jets in the shallow seal regime is the breakup of the jet after pinch-off due to disturbances that grow from the Rayleigh–Plateau instability (Lin & Reitz Reference Lin and Reitz1998). When the cavity walls pinch off and impact the sides of a small-diameter jet, the disturbance can be sufficiently large to cause the jet to break up into an uneven droplet stream more quickly than normal. This breakup is seen in figure 9(b) at 14.8 ms and explains why the smooth cavity created by the jet becomes irregular after pinch-off.
Deep seal shown for two stream types. Pinch-off occurs approximately halfway between the free surface and cavity bottom. (a) A cavity formed by a multi-droplet stream with higher
 $Bo^{\ast }$
and
 $We^{\ast }$
pinches off in a deep seal (
 $f=1500~\text{Hz}$
,
 $U_{s}=6.59~\text{m}~\text{s}^{-1}$
,
 $d_{d}=2.17~\text{mm}$
,
 $We^{\ast }=748$
,
 $Bo^{\ast }=0.21$
,
 $Mt=16.9$
and
 $\tilde{f}=0.49$
). (b) A cavity formed by a jet at a moderate
 $Bo^{\ast }$
pinches off in a deep seal (
 $U_{s}=7.09~\text{m}~\text{s}^{-1}$
,
 $d_{j}=0.71~\text{mm}$
,
 $We^{\ast }=527$
and
 $Bo^{\ast }=0.068$
). Because
 $Bo^{\ast }$
is relatively small for this jet impact, we still observe the downward-moving capillary wave near the surface seen for shallow seal. Numbers at the bottom of each frame indicate the time after impact in milliseconds. Corresponding positions in the regime diagrams can be seen in figure 6(b,c). Movies for (a) and (b) are shown in supplementary movies 1 and 2, respectively.

As
 $We^{\ast }$
and
 $Bo^{\ast }$
increase, inertial and pressure forces become more important and cavities enter the deep seal regime. Unlike the shallow seal event, the cavity walls pinch together approximately halfway between the surface and the bottom of the cavity at the time of pinch-off (figure 10). The predominant force driving this event is hydrostatic pressure, as described by the higher
 $Bo^{\ast }$
. While the jet literature cited in the introduction does not specify the type of cavity seal, the images and range of
 $Bo$
and
 $We$
reported in these references indicate deep seal cavities (Oguz et al.
Reference Oguz, Prosperetti and Lezzi1992; Zhu et al.
Reference Zhu, Oğuz and Prosperetti2000; Kersten et al.
Reference Kersten, Ohl and Prosperetti2003; Soh et al.
Reference Soh, Khoo and Yuen2005; Qu et al.
Reference Qu, Goharzadeh, Khezzar and Molki2013). As shown in figure 6(c), these prior studies fall in the deep seal regime on the
 $Bo^{\ast }$
–
 $We^{\ast }$
diagram.
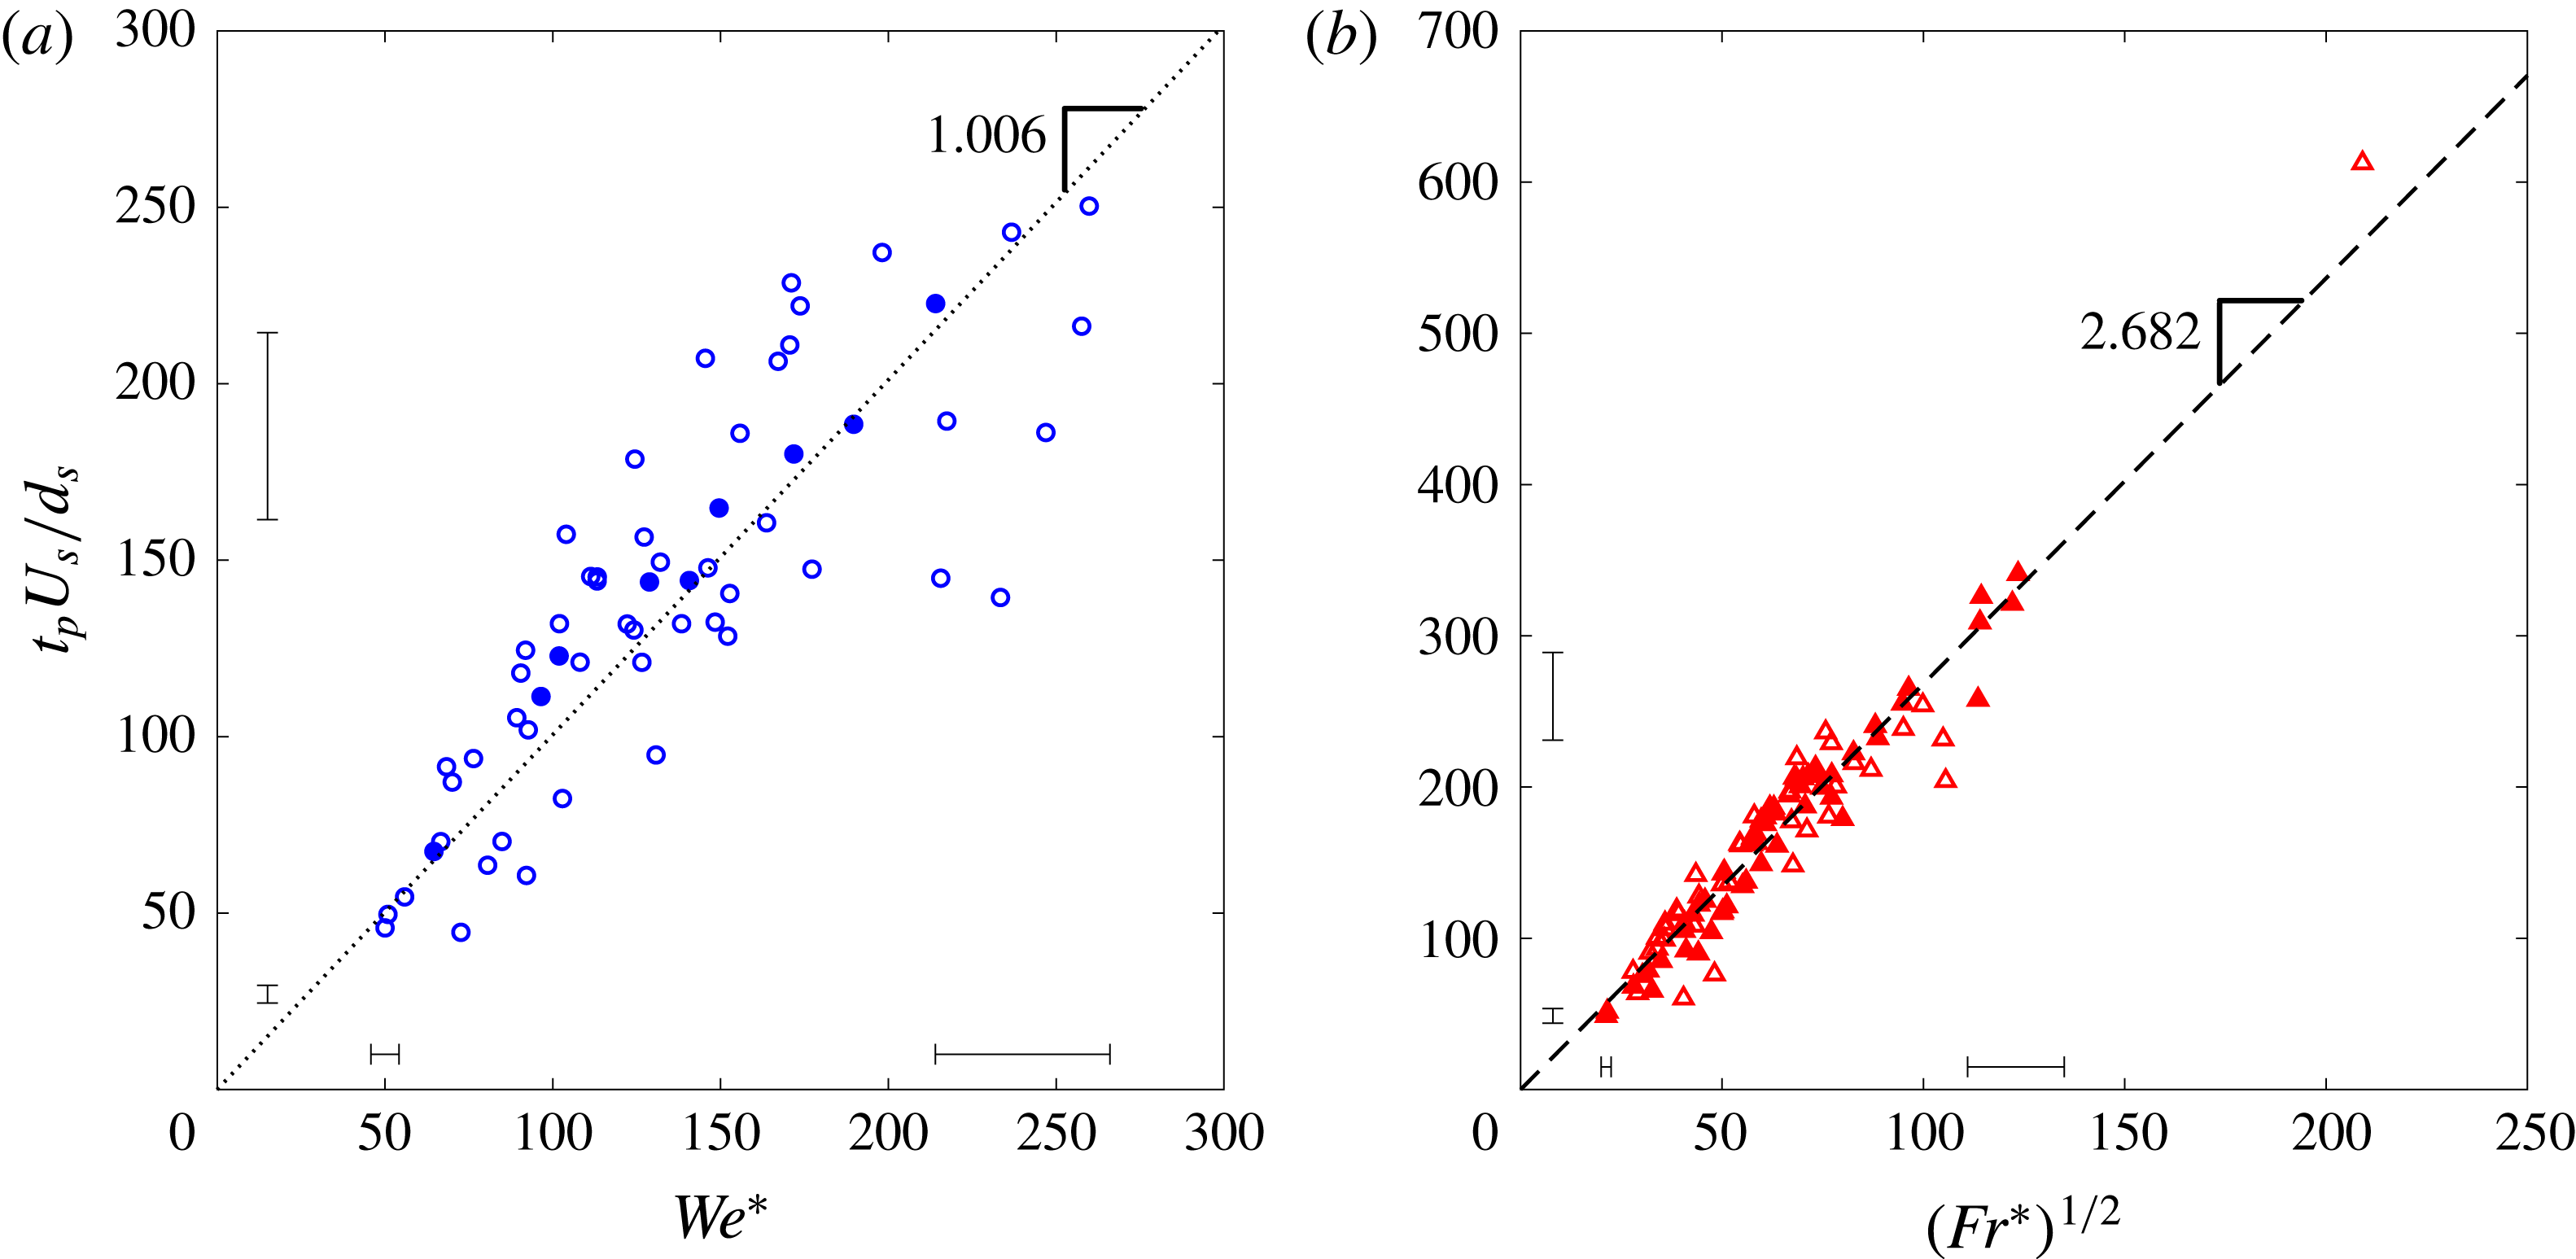
The division between the shallow and deep seal regimes shown by the solid line in figure 6(c) is found by equating the dimensionless pinch-off times for shallow and deep seal (Aristoff & Bush Reference Aristoff and Bush2009). Pinch-off time is non-dimensionalized as
 $t_{p}U_{s}/d_{s}$
in figure 11. Shallow seal is driven by surface tension, and thus the dimensionless pinch-off time can be predicted using
 $We^{\ast }$
(figure 11
a), whereas deep seal is driven by hydrostatic pressure and thus pinch-off time scales with
 $Fr^{\ast }$
(figure 11
b). Equating the shallow and deep non-dimensional pinch-off times gives the equation for the solid black line in figure 6(c) separating the shallow and deep seal regimes as
 $$\begin{eqnarray}We^{\ast }=\frac{m_{deep}^{2}}{m_{shal}^{2}}(Bo^{\ast })^{-1},\end{eqnarray}$$
with
 $m_{shal}$
equal to the slope of the pinch-off time fit for shallow seal and
 $m_{deep}$
equal to the slope of the fit for deep seal, as shown in figure 11. It is worth noting that modifying the droplet diameter as discussed in § 3 causes the dimensionless pinch-off times to fall on a common line for both jets and droplet streams. This again indicates that the cavity diameter governs the pinch-off characteristics.

An interesting phenomenon can occur for multi-droplet impacts that border on three cavity seal regimes. For example, on figure 6(c), the blue circle inside the black square corresponds to a shallow seal event with
 $Bo^{\ast }=0.073$
and
 $We^{\ast }=234$
, yet the location of the symbol falls in the deep seal regime. Furthermore, for this case,
 $Mt=4.84$
, which places the case close to the sub-cavity 2 collapse regime. Because the pinch-off for shallow seal and sub-cavity 2 collapse occurs at approximately the same depth below the surface, we suggest that the two mechanisms associated with these two types of cavity seal have an additive effect resulting in a shallow pinch-off. In this case shallow seal was closely followed by deep seal, reflecting the intersection of three regimes of cavity seal for this case.
As
 $We^{\ast }$
increases above that seen for deep seal, the low air pressure created by the velocity of the stream and surface tension forces cause the splash crown to collapse inwards on itself, or to dome over, sealing the cavity off from further air entrainment (Marston et al.
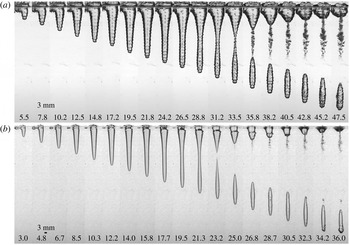
Reference Marston, Truscott, Speirs, Mansoor and Thoroddsen2016). This regime is called surface seal. The cavity then pulls away from the free surface, entering deeper into the pool. Deep seal often follows surface seal, splitting the cavity in two. This sequence of events can be seen in figure 12 with dome-over occurring at 12.0 ms in (a) for the multi-droplet stream and at 8.3 ms in (b) for the jet. Even after the dome-over has occurred, the stream of water continues to penetrate into the cavity, but has now been distorted by passing through the splash crown. The cutoff between the deep seal and surface seal regimes occurs at
 $We^{\ast }=914$
, which is the same
 $We^{\ast }$
(following modification of the droplet diameter) at which Franz (Reference Franz1959) saw dome-over beginning to occur for single-droplet impacts. This implies that the dome-over event is predominantly caused by the impact of the first droplet and thus can be thought of as either a sub-cavity 1 dome-over or a surface seal event from a sphere-like water entry.
Surface seal for two types of stream impacts. (a) The splash crown of a cavity created by a multi-droplet stream domes over at
 $t=12.0~\text{ms}$
, resulting in surface seal (
 $f=2500~\text{Hz}$
,
 $U_{s}=7.51~\text{m}~\text{s}^{-1}$
,
 $d_{d}=2.06~\text{mm}$
,
 $We^{\ast }=923$
,
 $Bo^{\ast }=0.19$
,
 $Mt=28$
and
 $\tilde{f}=0.69$
). (b) The same phenomenon is observed for a cavity created by a jet with dome-over occurring at
 $t=8.3~\text{ms}$
(
 $U_{s}=9.69~\text{m}~\text{s}^{-1}$
and
 $d_{j}=0.71~\text{mm}$
,
 $We^{\ast }=921$
and
 $Bo^{\ast }=0.068$
). Numbers at the bottom of each frame indicate the time after impact in milliseconds. Corresponding positions in the regime diagrams can be seen in figure 6(b,c). Movies for (a) and (b) are shown in supplementary movies 9 and 10, respectively.

4 Cavity velocity
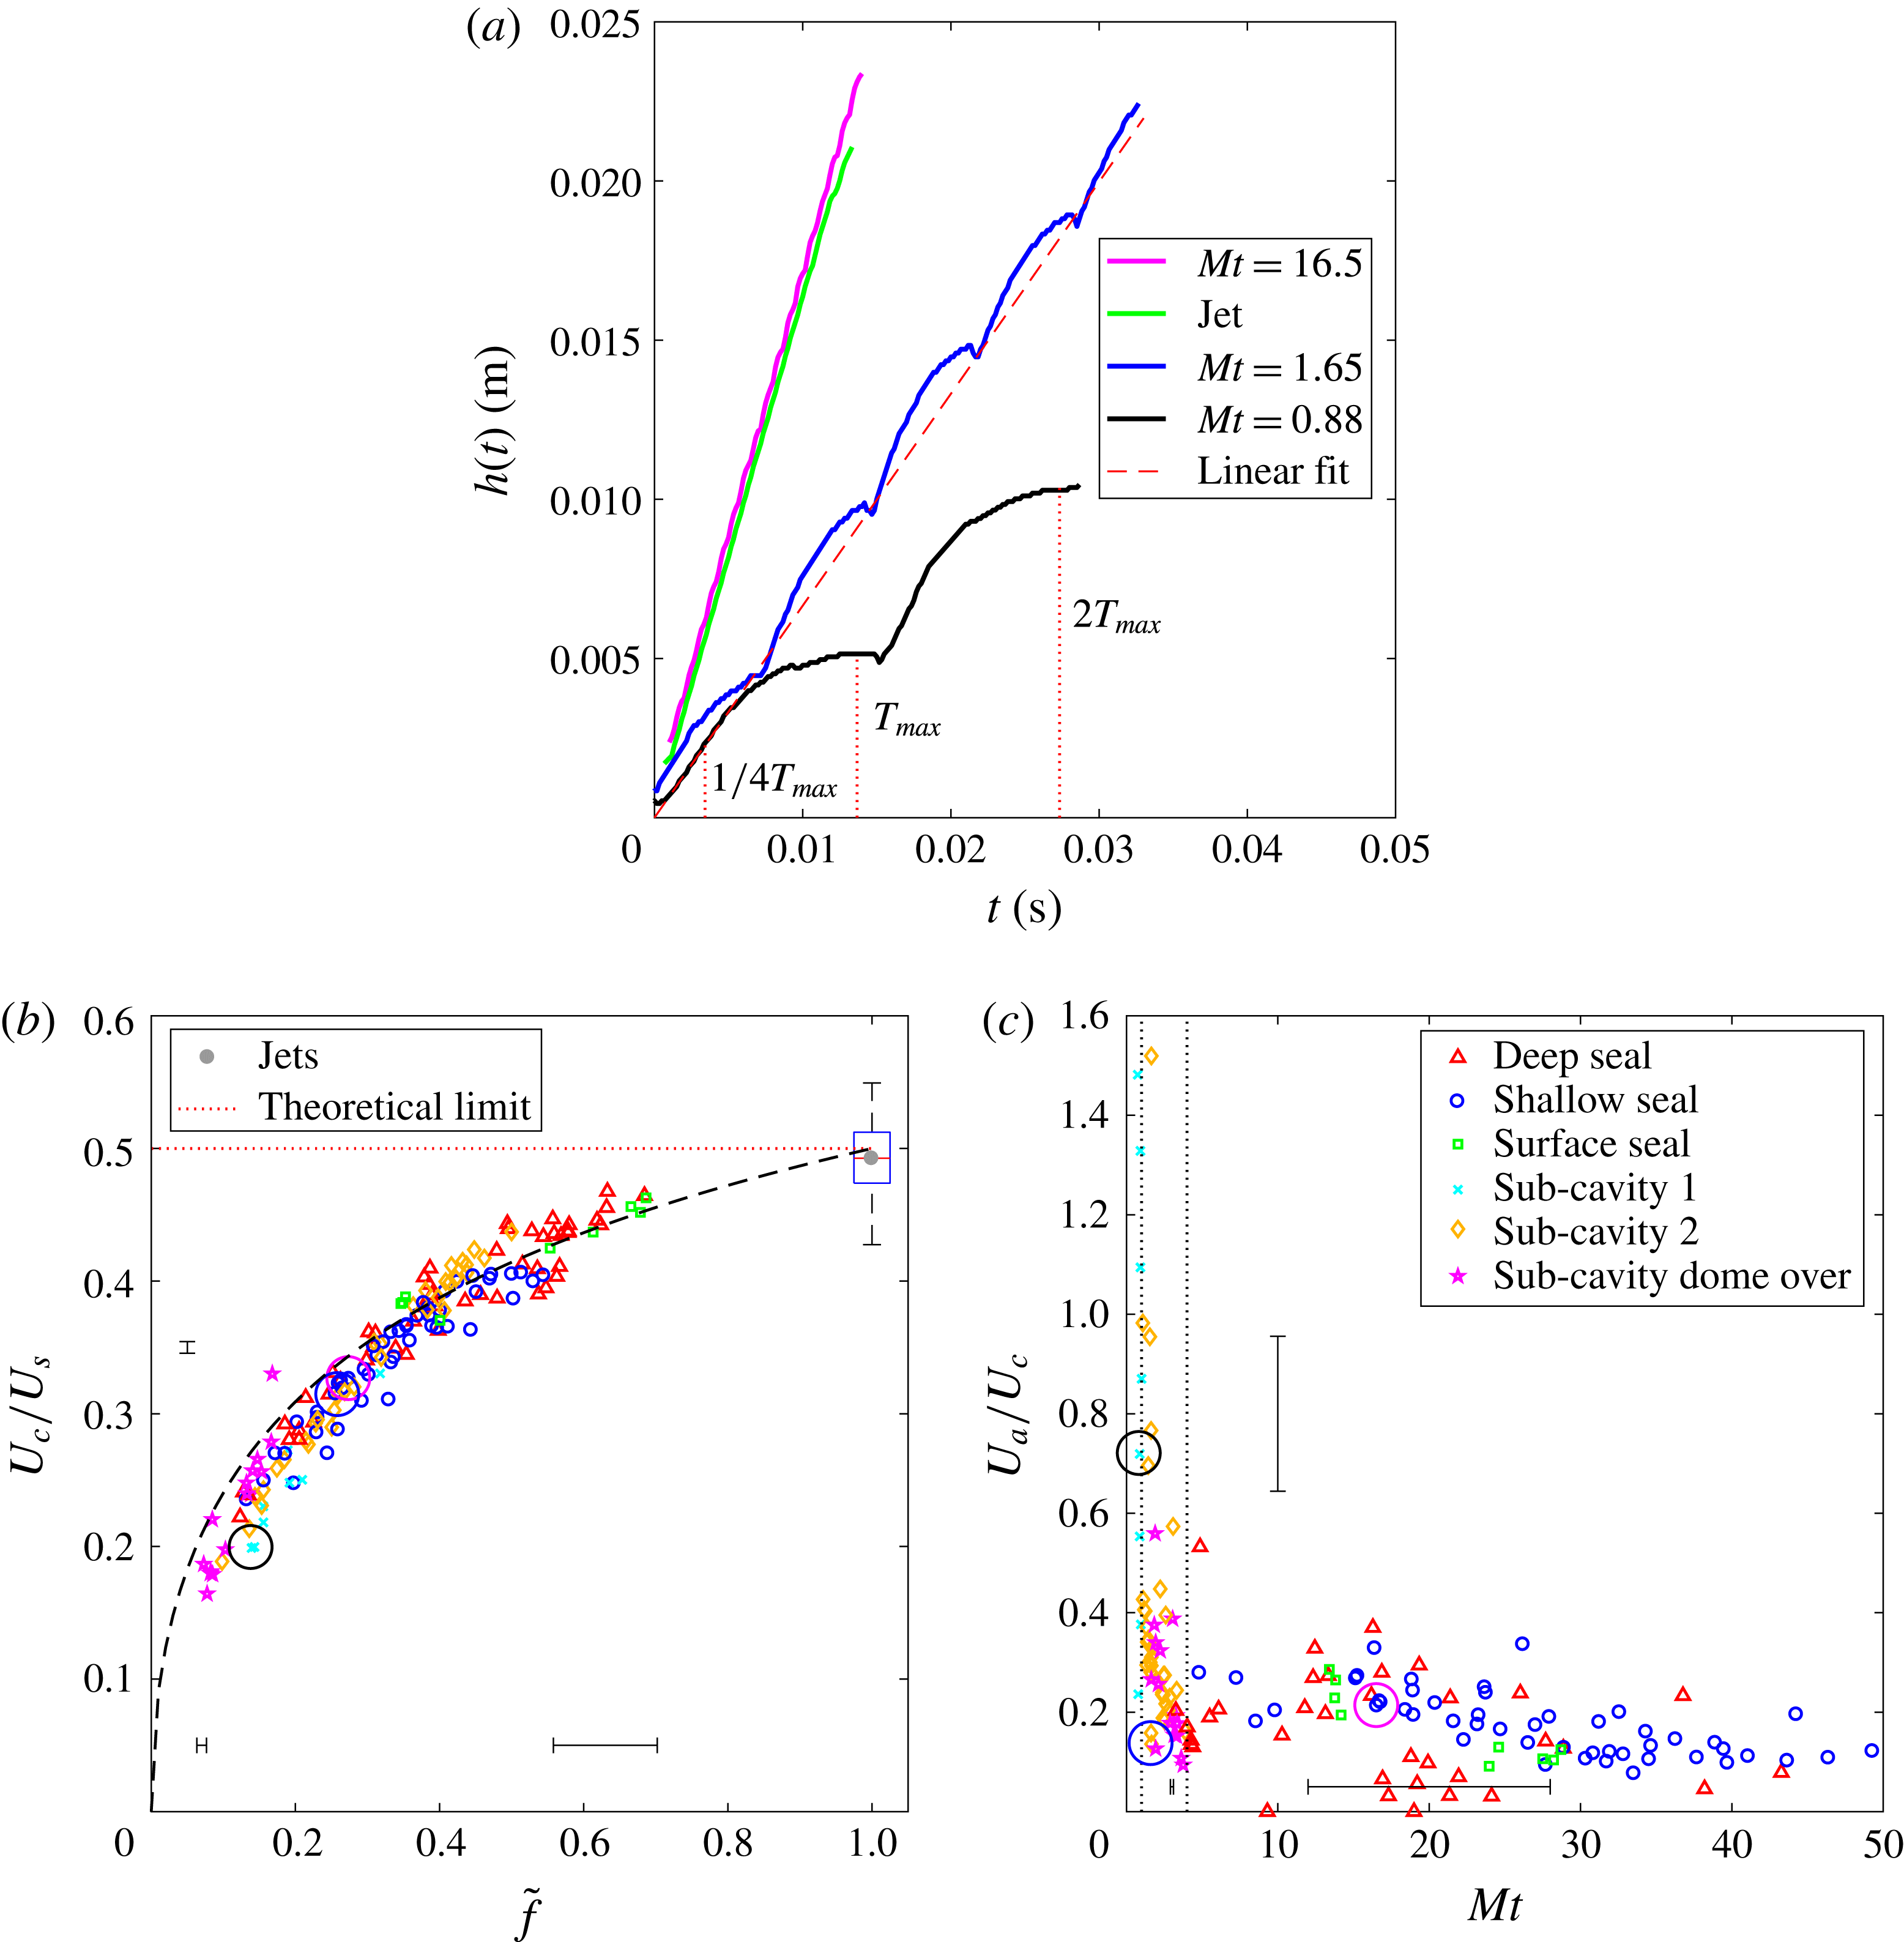
We will now examine the downward growth rate of the cavity. In figure 13(a) the unsteady growth of four different cavities in time is presented. The effect of each individual droplet impact can be seen in the cavity depth evolution, with the downward velocity varying over the period of expansion of each sub-cavity,
 $T_{max}$
. Thus, in describing the downward velocity of the cavity, we can discuss two parts: the average cavity velocity (captured by linear fits) and the oscillating cavity velocity.
Downward cavity velocity of multi-droplet streams and jets. (a) Depth of the cavity in time for four values of
 $Mt$
. The black line represents a multi-droplet stream with
 $\tilde{f}=0.14$
and for a case with sub-cavity 1 collapse. The blue curve represents a multi-droplet stream with sub-cavity 2 collapse and
 $\tilde{f}=0.26$
. A linear fit is applied to estimate the average cavity velocity (red dashed line). The magenta line represents a multi-droplet stream with
 $\tilde{f}=0.27$
, which displays shallow seal behaviour. Note that, as
 $Mt$
increases, the oscillations in the cavity velocity become less pronounced. A jet (green line) also forms a shallow seal cavity with velocity nearly identical to the
 $Mt=16.5$
multi-droplet case. (b) The average downward cavity velocity (
 $U_{c}$
) normalized by the stream velocity (
 $U_{s}$
) as a function of
 $\tilde{f}$
. The black dashed line represents (4.4) and the red dotted line represents the theoretical velocity ratio for a jet. The mean velocity ratio for all 65 jet cases is marked by the grey dot and a standard box-and-whisker plot (
 $\tilde{f}=1$
). (c) The amplitude of oscillation (
 $U_{a}$
) normalized by the average cavity velocity (
 $U_{c}$
) as a function of
 $Mt$
. The vertical dotted lines indicate transitional
 $Mt$
numbers of 1 and 4. The large circles in (b,c) outline data points represented by the corresponding colours of the lines in panel (a).

Based on the work of Birkhoff & Zarantonello (Reference Birkhoff and Zarantonello1957, p. 16), we can develop a model that predicts the cavity velocity,
 $U_{c}$
. To begin we neglect gravity during impact and consider the impact of a jet in a reference frame moving at the velocity of the cavity bottom. Noting that the pressures of the two media (jet and pool) at the stagnation point are balanced and applying the Bernoulli equation along the axial streamlines in both media, the unknown pressure at the stagnation point can be eliminated. This approach yields
 $$\begin{eqnarray}{\textstyle \frac{1}{2}}\unicode[STIX]{x1D70C}(U_{s}-U_{c})^{2}={\textstyle \frac{1}{2}}\unicode[STIX]{x1D70C}U_{c}^{2},\end{eqnarray}$$
and rearranging gives
 $$\begin{eqnarray}\frac{U_{c}}{U_{s}}=\frac{1}{2}.\end{eqnarray}$$
Bouwhuis et al. (Reference Bouwhuis, Huang, Chan, Frommhold, Ohl, Lohse, Snoeijer and van der Meer2016) used computation and experimental methods to show that for multi-droplet streams
 $U_{c}/U_{s}$
approaches
 $1/2$
as
 $\tilde{f}$
approaches unity. We can now modify the energy balance in (4.1) accounting for the intermittent droplet impact by multiplying the left-hand side by
 $\tilde{f}$
:
 $$\begin{eqnarray}{\textstyle \frac{1}{2}}\unicode[STIX]{x1D70C}(U_{s}-U_{c})^{2}\tilde{f}={\textstyle \frac{1}{2}}\unicode[STIX]{x1D70C}U_{c}^{2}.\end{eqnarray}$$
Now solving this for
 $U_{c}/U_{s}$
we get
 $$\begin{eqnarray}\frac{U_{c}}{U_{s}}=\frac{\sqrt{\tilde{f}}}{1+\sqrt{\tilde{f}}},\end{eqnarray}$$
where
 $\tilde{f}\in [0,1]$
(figure 3
d). As shown in figure 13(b), this modified theory accurately captures the experimentally measured cavity velocities. As
 $\tilde{f}$
approaches 1, the multi-droplet stream becomes more jet-like approaching the theoretical value of
 $1/2$
. Experimental values for all of the 65 jets studied have a mean value of 0.492 as marked. Most studies agree that the jet cavity velocity equals half of the jet velocity (Oguz et al.
Reference Oguz, Prosperetti and Lezzi1992, Reference Oguz, Prosperetti and Kolaini1995; Zhu et al.
Reference Zhu, Oğuz and Prosperetti2000; Qu et al.
Reference Qu, Goharzadeh, Khezzar and Molki2013).
To describe the oscillations in the cavity, we consider the black line in figure 13(a), which represents a cavity formed by the impact of a multi-droplet stream with
 $Mt=0.88$
. Taking the numeric derivative of this curve, we obtain the downward cavity velocity over time, which is found to be periodic over the time between impact of successive droplets (appearing similar to a sine wave). The oscillating amplitude of the cavity velocity is then averaged by finding the mean amplitudes of all periods (
 $U_{a}=(1/N)\sum _{n=1}^{N}(u_{n}^{max}-u_{n}^{min})/2$
, where
 $u_{n}^{max}$
and
 $u_{n}^{min}$
are the maximum and minimum velocities within the
 $n$
th period). Because
 $Mt<1$
we can see the first sub-cavity reach its maximum size at
 $T_{max}$
. The growth of a multi-droplet stream cavity can be modelled by constructing a superposition of curves from portions of
 $h(t)$
versus
 $t$
, where each curve represents the growth of a sub-cavity. When
 $Mt=1$
, the second droplet impacts just as the curve reaches its apex and the parabolic shaped growth is repeated (figure 13
a, black line). When
 $Mt=2$
, the second droplet impacts at
 $T_{max}/2$
and only this first part of the curve is repeated (not labelled). Thus, the portion of the parabola that is repeated is from
 $t=0$
to
 $t=T_{max}/Mt$
. When
 $Mt>4$
the portion of the curve that is repeated is nearly a straight line and hence oscillations in the cavity velocity are small (figure 13
a, magenta line). Not only can this be seen in figure 13(a) but it can also be seen by comparing the murals of the sphere-like cavities in figures 9(a), 10(a) and 12(a) against the uneven growth rate of cavities created by multi-droplet streams with low
 $Mt$
as seen in figures 7 and 8. Quantitatively this means that the average amplitude of oscillation of the cavity velocity,
 $U_{a}$
, normalized by the average cavity velocity,
 $U_{c}$
, depends on
 $Mt$
(figure 13
c). At
 $Mt<4$
the cavity velocity becomes very unsteady, and around
 $Mt=1$
the amplitude of oscillation is of the order of the average cavity velocity.
5 Cavity dimensions
In this section we will discuss the various cavity dimensions, including pinch-off depth
 $h_{p}$
, the depth of the cavity bottom at pinch-off
 $h_{b}$
, the cavity depth after the entire stream has impacted
 $h_{c}$
and the average cavity diameter
 $d_{c}$
, as shown in figure 4.
5.1 Pinch-off depth
The pinch-off depth (
 $h_{p}$
) is affected by the type of cavity closure, and thus depends on
 $Mt$
,
 $We^{\ast }$
and
 $Bo^{\ast }$
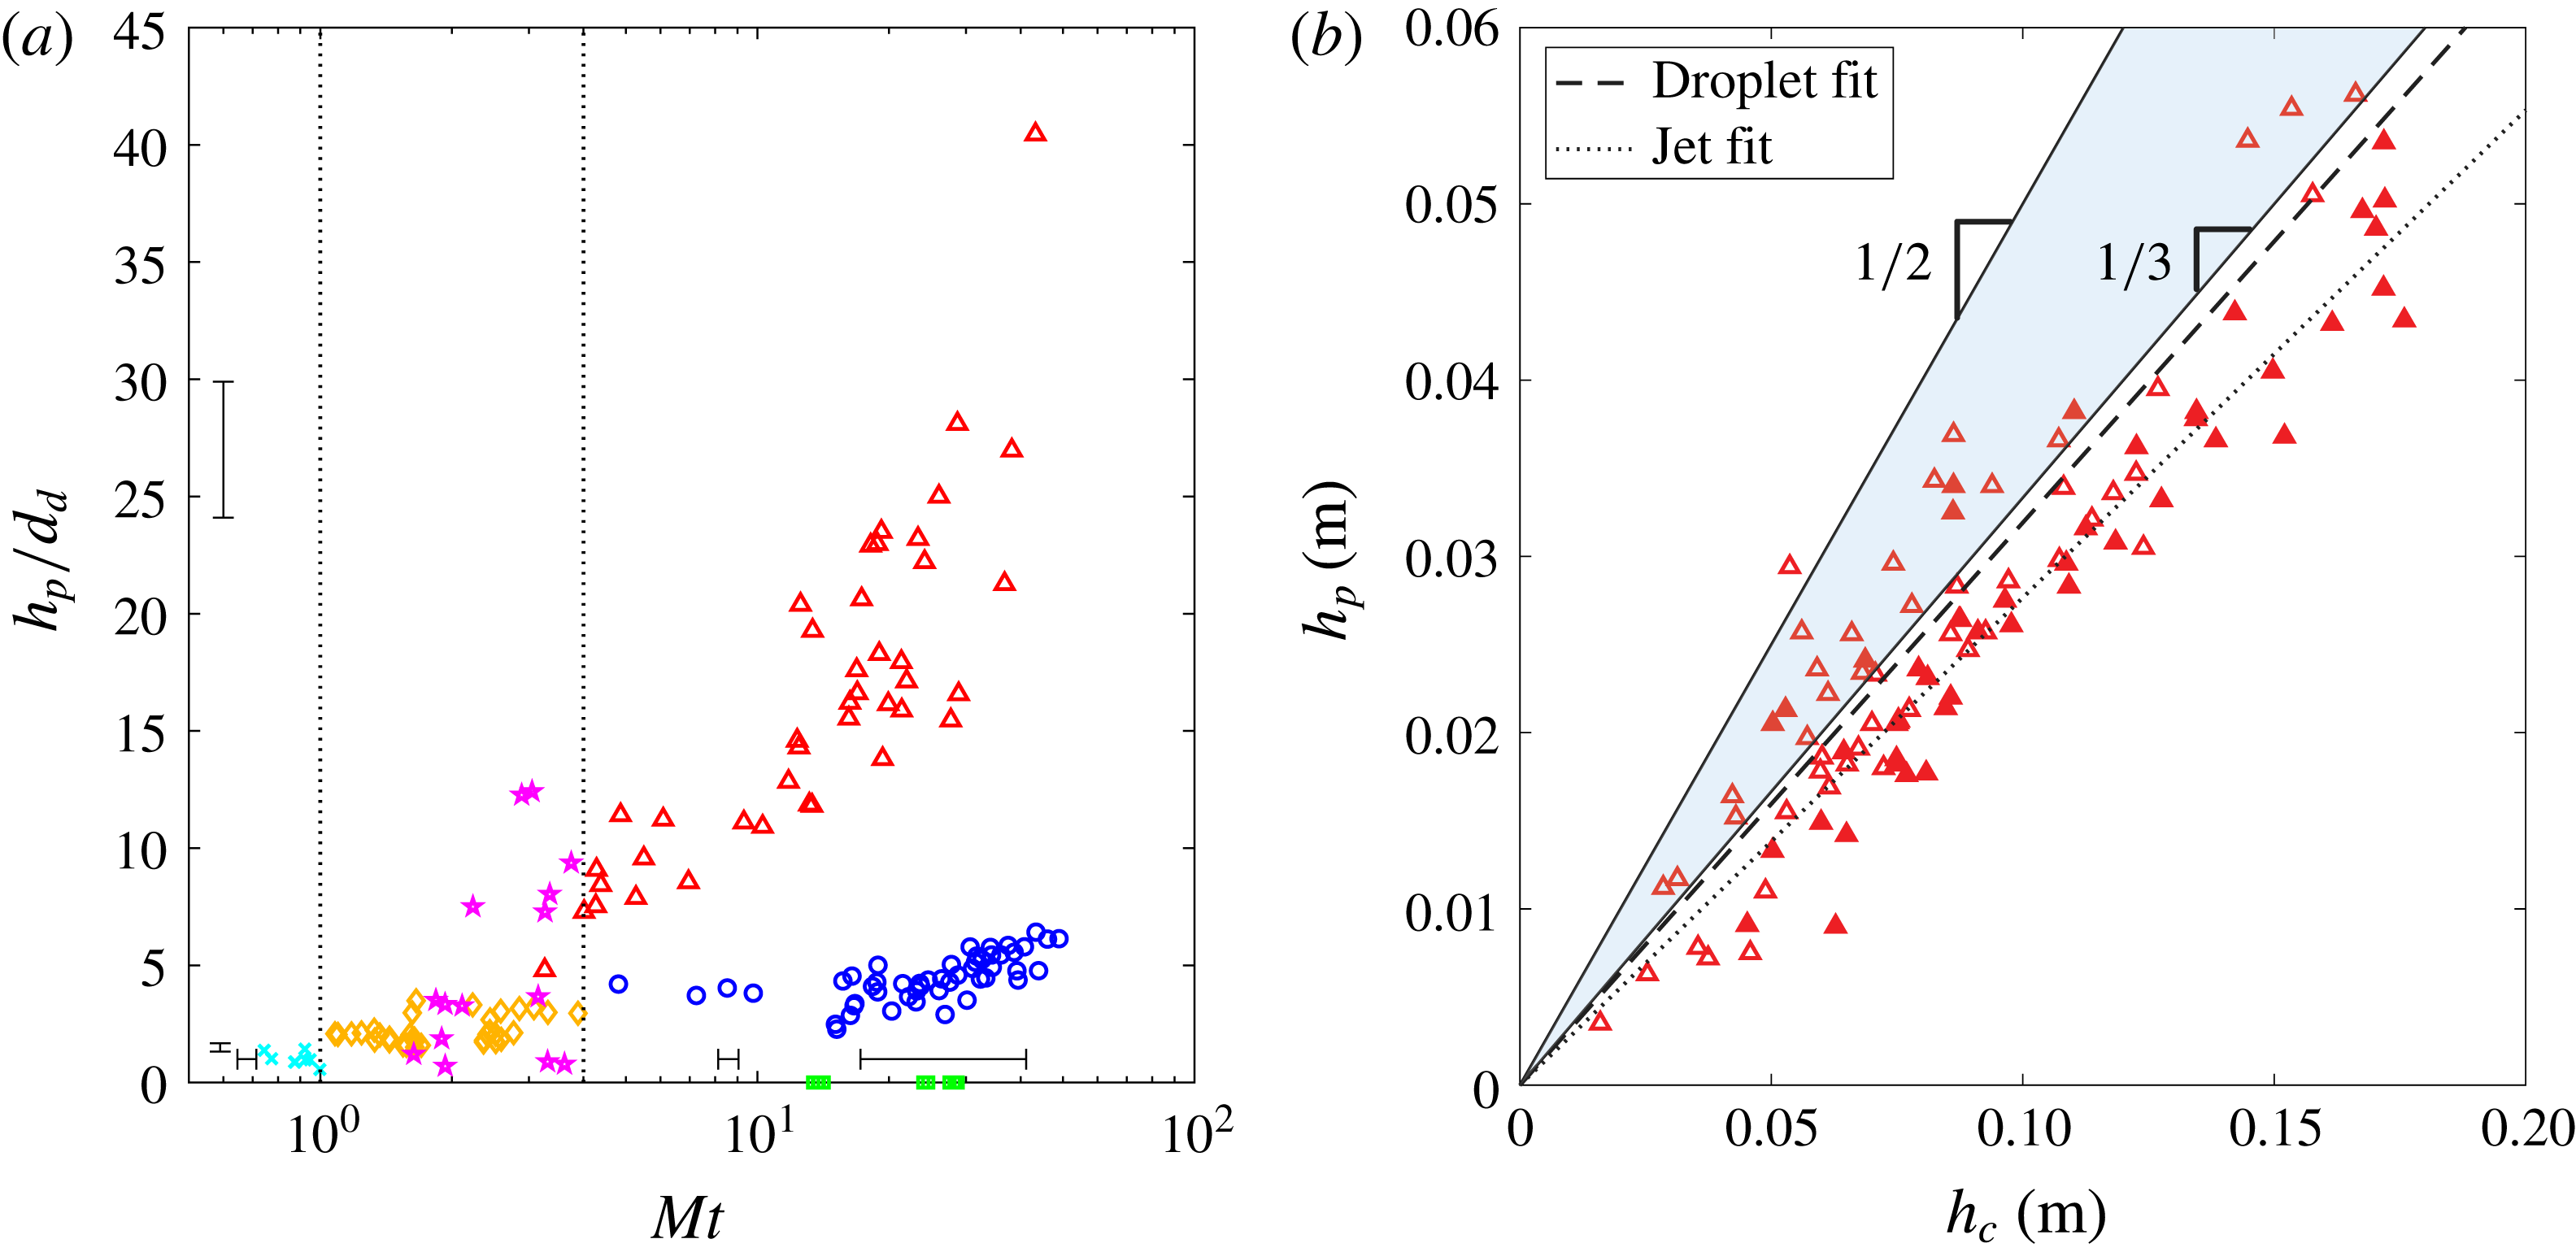
. Figure 14(a) plots the dimensionless pinch-off depth as a function of
 $Mt$
, illustrating this dependence on the closure regime. At
 $Mt<1$
, when sub-cavity 1 collapse occurs, the pinch-off depth is approximately equal to
 $d_{d}$
(non-modified droplet diameter). At
 $1<Mt<4$
sub-cavity 2 collapse occurs and the non-dimensional pinch-off depth doubles to approximately
 $2d_{d}$
. In this same matryoshka number range, but at
 $We^{\ast }>315$
, sub-cavity dome-over occurs. The depth of sub-cavity dome-over is unpredictable and multiple sub-cavities may dome over within one matryoshka cavity. At
 $Mt>4$
we see the three pinch-offs common to solid-sphere water entry (i.e. surface, shallow and deep seal). Surface seal occurs at the surface
 $h_{p}/h_{c}=0$
. Shallow seal is of the order of the capillary length, approximately three to six droplet diameters (
 $3<h_{p}/d_{d}<6$
) below the surface and increasing slightly as
 $Mt$
increases. Deep seal occurs approximately halfway between the surface and the bottom of the cavity (
 $h_{p}/h_{b}\approx 1/2$
).
In the case of deep seal, the ratio of pinch-off depth to cavity depth after the entire stream has impacted the cavity reveals a relatively constant ratio
 $h_{p}/h_{c}\approx 1/3$
(figure 14
b), which is the same as reported by Oguz et al. (Reference Oguz, Prosperetti and Kolaini1995) for jets. Birkhoff & Zarantonello (Reference Birkhoff and Zarantonello1957) showed theoretically that, when the density of the jet and pool are equal, the depth of the cavity equals the length of the jet used to form it (i.e.
 $h_{c}=L_{j}$
). We can use this to explain the ratio
 $h_{p}/h_{c}=1/3$
. The jet is cut off when pinch-off occurs and the lower portion of the cavity contains a portion of the jet that is
 $h_{b}/2$
long. This jet will add its remaining length to the depth of the cavity (
 $h_{c}=h_{b}+h_{b}/2$
), thus
 $h_{p}=h_{b}/2=h_{c}/3$
. A similar relationship between
 $h_{p}$
,
 $h_{b}$
and
 $h_{c}$
is derived for multi-droplet streams in § 5.3.
Pinch-off depth of multi-droplet streams. (a) Non-dimensional pinch-off depth for all multi-droplet streams as a function of
 $Mt$
. Pinch-off depth is normalized by the non-modified droplet diameter
 $d_{d}$
. (b) Pinch-off depth as a function of cavity depth for the deep seal regime only for multi-droplet streams and jets. The upper bound for the theoretical range is
 $h_{p}=h_{c}/2$
, as predicted in § 5.3. The lower bound predicted for droplets is set by the line
 $h_{p}=h_{c}/3$
, which is also the theoretically predicted pinch-off depth for jets. The least-squares fit to the droplet data has a slope of 0.319 and the fit to the jet data 0.277. Symbols and data are the same as in figure 6.

5.2 Predicting cavity depth and diameter using an energy balance
Cavity dimensions can be predicted by an energy analysis similar to that performed by Engel (Reference Engel1966). The kinetic energy of a multi-droplet stream of water can be expressed as
 $$\begin{eqnarray}KE_{d}=\frac{\unicode[STIX]{x03C0}}{12}\unicode[STIX]{x1D70C}d_{d}^{3}U_{s}^{2}N,\end{eqnarray}$$
where
 $N$
is the number of droplets that impact the cavity, and
 $U_{s}$
is the velocity of the stream. The jet kinetic energy can be expressed by
 $$\begin{eqnarray}KE_{j}=\frac{\unicode[STIX]{x03C0}}{8}\unicode[STIX]{x1D70C}d_{j}^{2}L_{j}U_{s}^{2}.\end{eqnarray}$$
In this study, the stream enters the cavity until the pinch-off event blocks further flow. Hence,
 $N$
can be calculated as
 $$\begin{eqnarray}N=ft_{p}-fh_{p}/U_{s},\end{eqnarray}$$
where
 $ft_{p}$
represents the number of droplets that pass the undisturbed free surface before
 $t_{p}$
and
 $fh_{p}/U_{s}$
represents the number of droplets that do not make it into the lower portion of the cavity. The jet length,
 $L_{j}$
, can be similarly calculated as
 $$\begin{eqnarray}L_{j}=U_{s}t_{p}-h_{p}.\end{eqnarray}$$
The potential energy of the cavity, which is equal to the work done on the pool by the stream, can be broken up into two portions, the energy due to the hydrostatic pressure surrounding the cavity,
 $PE_{pr}$
, and the energy due to the generated surface area,
 $PE_{\unicode[STIX]{x1D70E}}$
. We model the maximum cavity size described in § 2 as a long narrow cylinder of constant diameter
 $d_{c}$
and depth
 $h_{c}$
. The potential energy from pressure (
 $PE_{pr}=\int _{V}\unicode[STIX]{x1D70C}gz\,\text{d}V$
) simplifies to
 $$\begin{eqnarray}PE_{pr}=\frac{\unicode[STIX]{x03C0}}{8}\unicode[STIX]{x1D70C}gh_{c}^{2}d_{c}^{2}.\end{eqnarray}$$
The potential energy of the cavity due to generated surface area is
 $$\begin{eqnarray}PE_{\unicode[STIX]{x1D70E}}=\unicode[STIX]{x03C0}d_{c}h_{c}\unicode[STIX]{x1D70E}.\end{eqnarray}$$
Equating the kinetic energy (5.1) to the potential energies (5.5) and (5.6) for a multi-droplet stream and rearranging yields
 $$\begin{eqnarray}(d_{c}^{2}\unicode[STIX]{x1D70C}g)h_{c}^{2}+(8d_{c}\unicode[STIX]{x1D70E})h_{c}-{\textstyle \frac{2}{3}}\unicode[STIX]{x1D70C}d_{d}^{3}U_{s}^{2}N=0.\end{eqnarray}$$
Assuming a positive solution to the quadratic formula, non-dimensionalizing and simplifying, for droplets we find
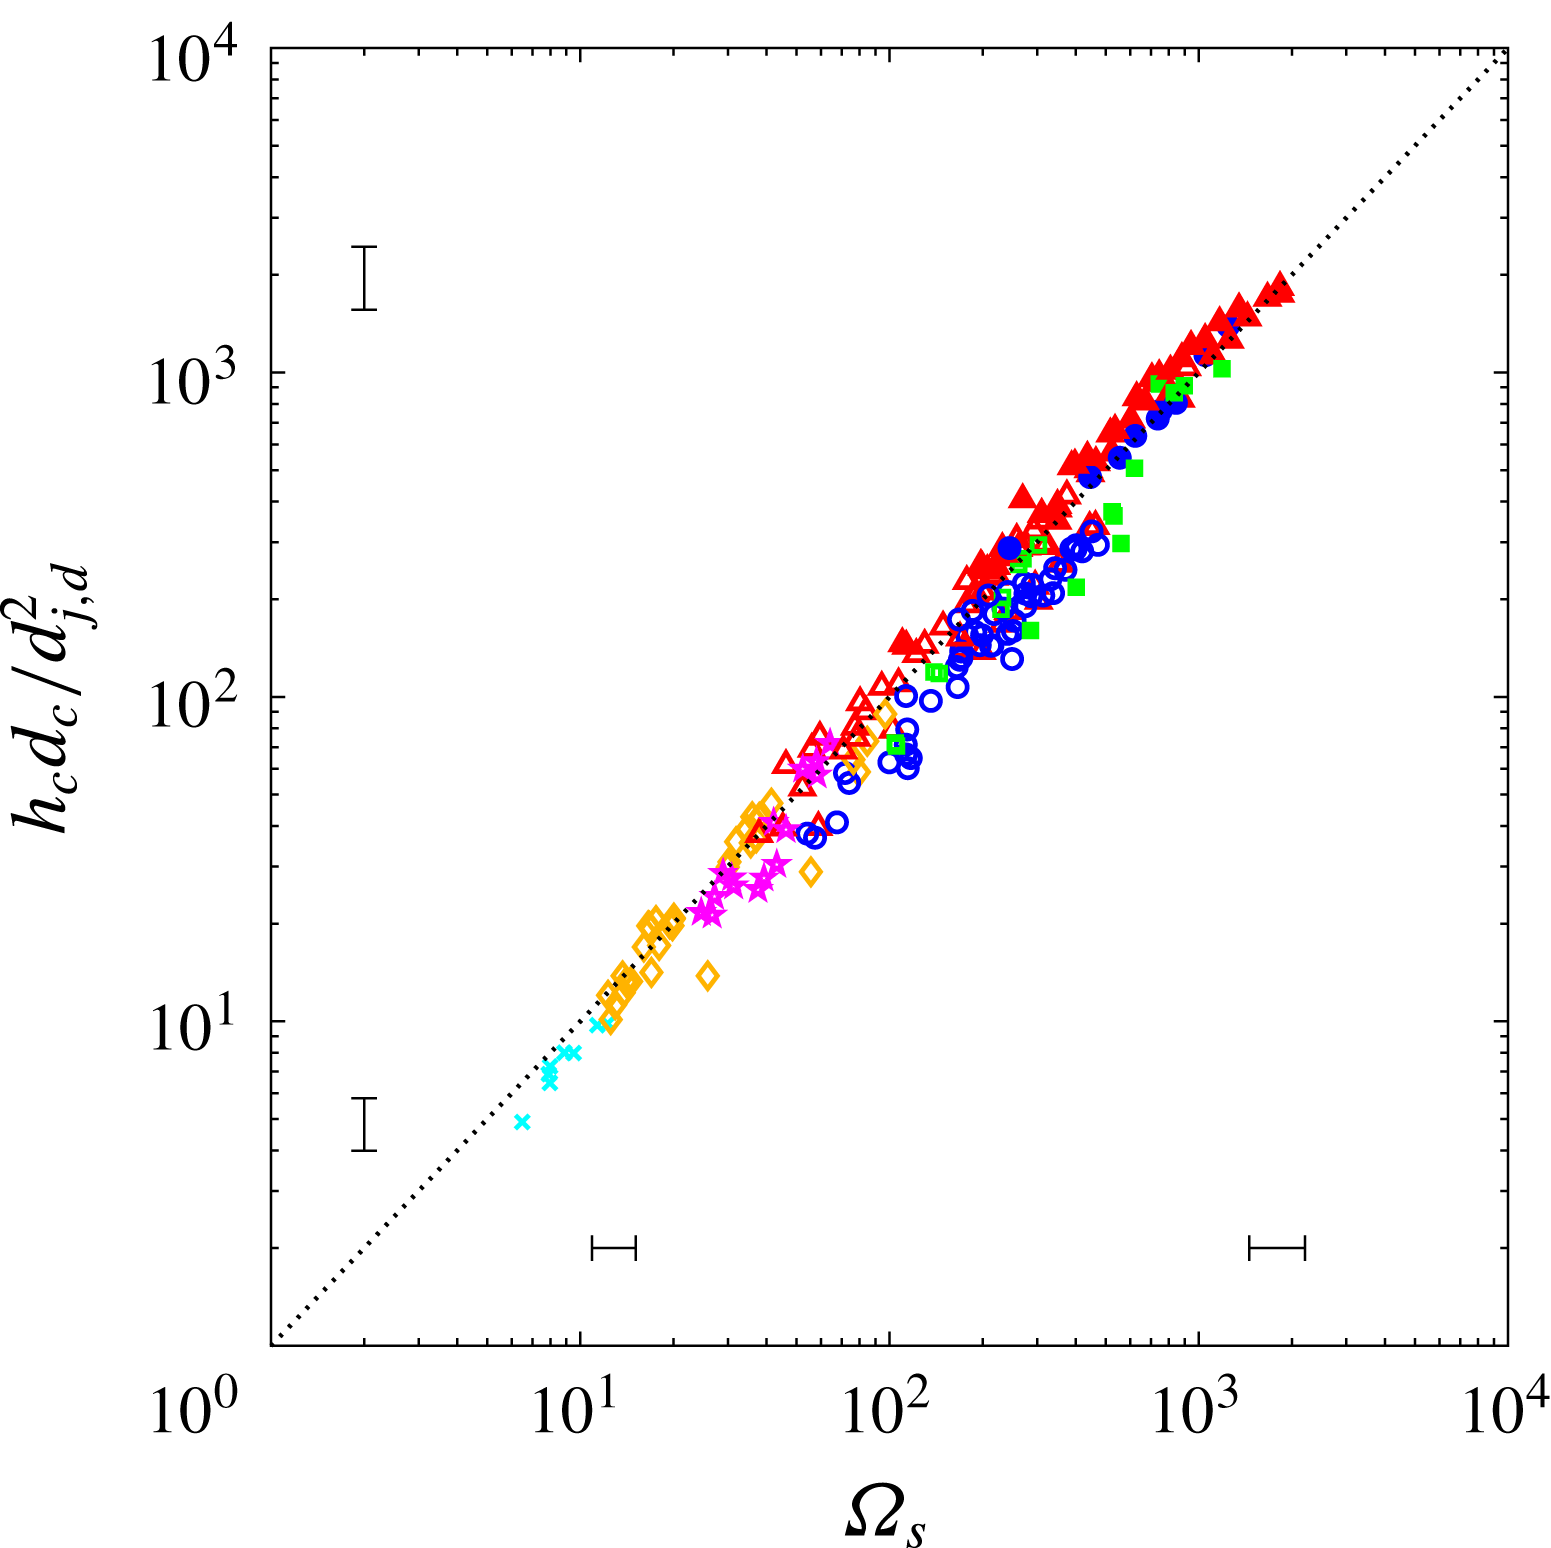
 $$\begin{eqnarray}\frac{h_{c}d_{c}}{d_{d}^{2}}=-\frac{4}{Bo}+\sqrt{\left(\frac{4}{Bo}\right)^{2}+\frac{2N}{3}Fr}\equiv \unicode[STIX]{x1D6FA}_{d}.\end{eqnarray}$$
Performing the same analysis for a jet yields
 $$\begin{eqnarray}\frac{h_{c}d_{c}}{d_{j}^{2}}=-\frac{4}{Bo}+\sqrt{\left(\frac{4}{Bo}\right)^{2}+\frac{L_{j}}{d_{j}}Fr}\equiv \unicode[STIX]{x1D6FA}_{j}.\end{eqnarray}$$
The left-hand sides of (5.8) and (5.9) can be thought of as a characteristic cavity size, which is a function of
 $Bo$
and
 $Fr$
. The experimental data in figure 15 show good agreement with this relationship. Equations (5.8) and (5.9) only tell us about the product of
 $h_{c}$
and
 $d_{c}$
. If we want to predict the cavity depth (
 $h_{c}$
) we must know the cavity diameter (
 $d_{c}$
). However, the ratio
 $d_{c}/d_{j,d}$
was empirically shown to be a linear function of impact velocity (figure 5).
The non-dimensional cavity size for both jets and multi-droplet streams is collapsed by a function of
 $Bo$
and
 $Fr$
computed from an energy balance. The theoretical predictions of (5.8) and (5.9) are shown by the dotted line, as both equations collapse to a single curve. Note that the droplet diameter used in this analysis is
 $d_{d}$
, the non-modified droplet diameter. Symbols and data are the same as in figure 6.

5.3 Predicting cavity depth using the Bernoulli equation
We will now discuss another way that the depth of the cavity,
 $h_{c}$
, can be predicted. Recall that Birkhoff & Zarantonello (Reference Birkhoff and Zarantonello1957) showed mathematically that when the density of the jet and the density of the pool are equal, then
 $h_{c}=L_{j}$
. The ratio of the cavity depth to the jet length for a given time can be expressed as
 $$\begin{eqnarray}\frac{h(t)}{l_{j}(t)}=\frac{U_{c}t}{(U_{s}-U_{c})t},\end{eqnarray}$$
where
 $l_{j}(t)$
is the length of jet that has impacted the cavity by time
 $t$
. By inserting
 $U_{c}=U_{s}/2$
from (4.2) and simplifying we get
 $$\begin{eqnarray}\frac{h(t)}{l_{j}(t)}=1.\end{eqnarray}$$
We can apply the same analysis to a multi-droplet stream by solving for
 $U_{c}$
in (4.4) and placing it into (5.10), yielding
 $$\begin{eqnarray}\frac{h(t)}{l_{d}(t)}=\sqrt{\tilde{f}},\end{eqnarray}$$
where
 $l_{d}(t)$
is approximately equal to the distance from the first droplet that impacts to the last droplet that has impacted by time
 $t$
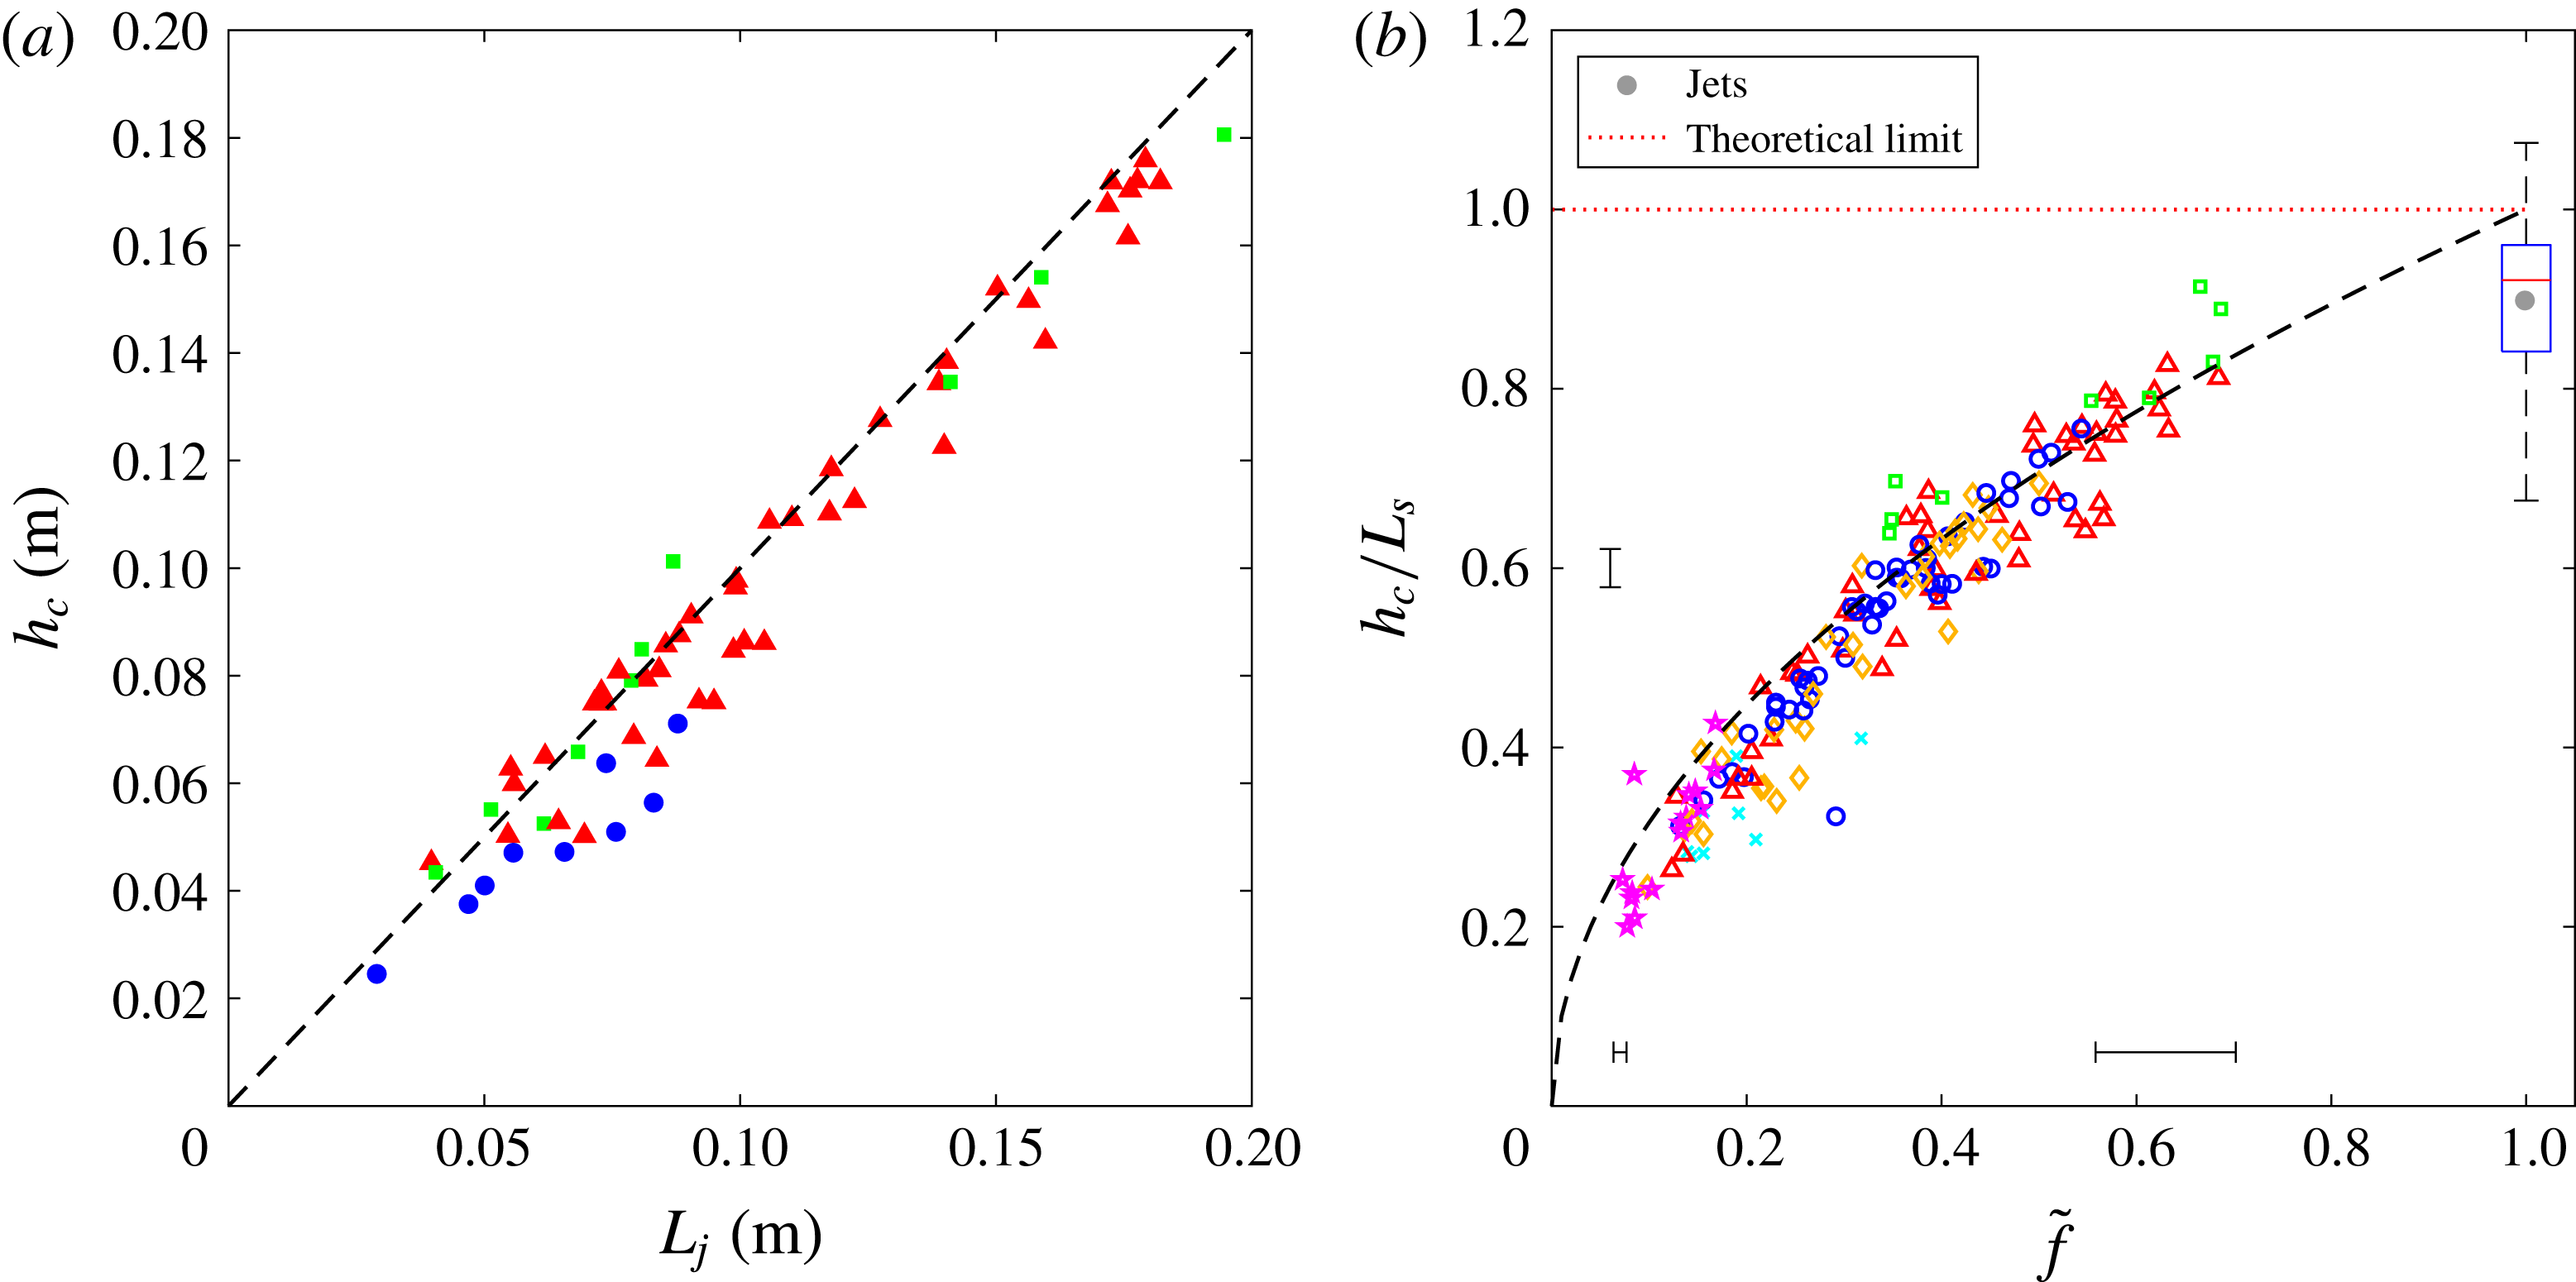
. These equations work well to predict the depth of the cavity,
 $h_{c}$
, for jets in figure 16(a) and droplets in figure 16(b). Equation (5.11) slightly overpredicts the depth of the cavity for jets. This can be explained by recalling that in (4.1) the effect of gravity was neglected. Thus, the hydrostatic pressure, which pushes against the impinging jet, is not taken into account; therefore, departure from (5.11) increases with increasing depth. One could modify these equations to include gravity but the overall conclusion remains the same.
We can now revisit the relationship between the cavity depths
 $h_{p}$
and
 $h_{c}$
. The total cavity depth for a multi-droplet stream can be written as
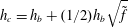 $h_{c}=h_{b}+(1/2)h_{b}\sqrt{\tilde{f}}$
, leading to
 $h_{p}=h_{b}/2=h_{c}/(\sqrt{\tilde{f}}+2)$
, where
 $h_{p}\in [h_{c}/3,h_{c}/2]$
, which is closely supported by the trends of figure 14(b). It is likely that the difference between the theoretical estimate and the experimental result is that in the experiment it is possible for a portion of the jet or a droplet to get ‘caught’ in the pinch-off event, and not descend downwards with the rest of the fluid, thus reducing the effective full stream cavity depth.
(a) The length of the jet that impacts the cavity bottom equals the depth of the cavity that it creates. (b) An equivalent expression for multi-droplet streams works to predict the depth of the cavity,
 $h_{c}$
. The dashed lines in (a) and (b) represent (5.11) and (5.12), respectively. In (b) the mean
 $h_{c}/L_{j}$
for all the jet cases is marked by the grey dot and a standard box-and-whisker plot (
 $\tilde{f}=1$
); where
 $L_{s}$
represents the length of either the multi-droplet stream or jet stream. Symbols and data are the same as in figure 6.

Finally, the depth of the cavity can be estimated using (5.4) by substituting
 $h_{c}$
for
 $L_{j}$
and assuming a semi-infinite jet that is cut short by the pinch-off event:
 $$\begin{eqnarray}h_{c}=U_{s}t_{p}-h_{p}.\end{eqnarray}$$
We can then replace
 $h_{p}$
depending on the cavity type: for deep seal we use
 $h_{p}=h_{c}/3$
, for shallow seal
 $h_{p}$
is approximately equal to the capillary length (
 $\unicode[STIX]{x1D706}$
), and for surface seal
 $h_{p}=0$
. Thus each of these cases becomes
 $$\begin{eqnarray}h_{c,jets}=\left\{\begin{array}{@{}ll@{}}\frac{3}{4}U_{s}t_{p} & \text{deep,}\\ U_{s}t_{p}-\unicode[STIX]{x1D706} & \text{shallow,}\\ U_{s}t_{p} & \text{surface.}\end{array}\right.\end{eqnarray}$$
Applying this same method to multi-droplet streams, but using
 $L_{d}=h_{c}/\sqrt{\tilde{f}}$
, the equations for deep, shallow and surface seal become
 $$\begin{eqnarray}h_{c,droplets}=\left\{\begin{array}{@{}ll@{}}\displaystyle \frac{U_{s}t_{p}\sqrt{\tilde{f}}}{1+\frac{1}{3}\sqrt{\tilde{f}}} & \text{deep,}\\ (U_{s}t_{p}-\unicode[STIX]{x1D706})\sqrt{\tilde{f}} & \text{shallow,}\\ U_{s}t_{p}\sqrt{\tilde{f}} & \text{surface.}\end{array}\right.\end{eqnarray}$$
These analyses show that the dimensions of the cavity for jets can be used to unravel the multi-droplet cavity dimensions and that the two different stream types are indeed related physically. For instance, if
 $\tilde{f}=1$
, which is the case for a jet, equations (5.15) simplify to the jet equations (5.14).
We emphasize the differences between the models presented in §§ 5.2 and 5.3. The energy-balance-based model in § 5.2 predicts the cavity size (a non-dimensional measurement, including both cavity depth
 $h_{c}$
and cavity diameter
 $d_{c}$
) by considering all of the kinetic energy of the incoming stream and comparing it to the potential energy of the entire cavity that it forms. In order to predict cavity size
 $h_{c}d_{c}/d_{s}^{2}$
and obtain some information on the cavity diameter
 $d_{c}$
, surface tension and gravity must be considered as both resisting the radial expansion of the cavity and contributing to the cavity’s potential energy. If one desires to obtain the cavity depth using this energy-balance-based model, the average cavity diameter
 $d_{c}$
must be known. On the other hand, the Bernoulli-based approach in § 5.3 predicts
 $h_{c}$
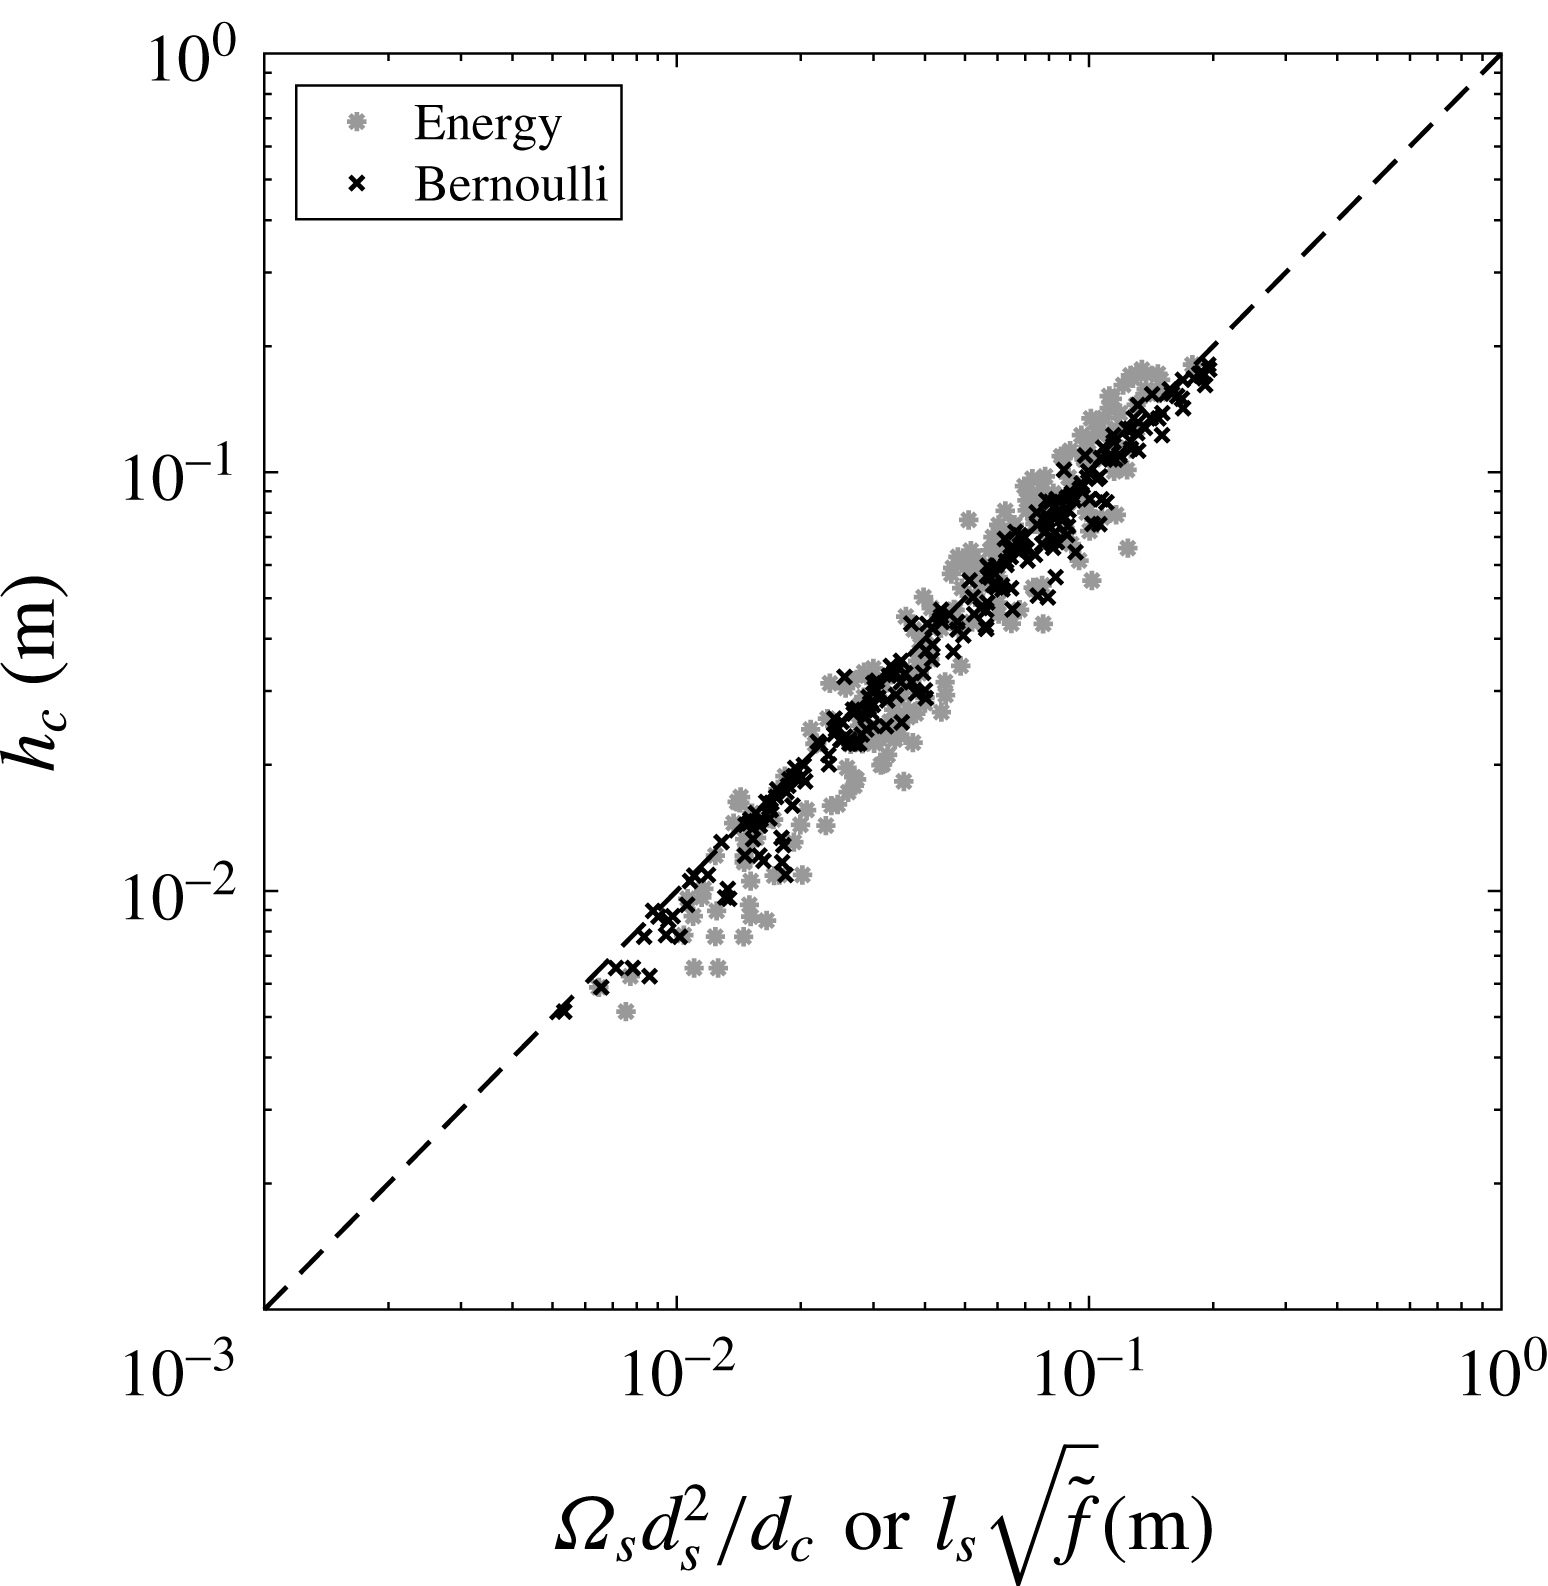
directly by using an energy balance solely at the cavity bottom. Surface tension and gravitational parameters are unnecessary in this method because the energy balance occurs on a short section of a single streamline (the axis of the flow), where the effect of these parameters is negligible. To compare the fidelity of these two methods in predicting cavity depth, we plot measured versus predicted values of
 $h_{c}$
in figure 17. The energy-based method predicts
 $h_{c}=\unicode[STIX]{x1D6FA}_{s}d_{s}^{2}/d_{c}$
((5.8) and (5.9) rearranged), where
 $d_{c}$
is evaluated from experimental measurements (figure 4
b). The Bernoulli method predicts
 $h_{c}=l_{s}\sqrt{\tilde{f}}$
((5.11) and (5.12) rearranged). The Bernoulli method results in a slightly more accurate prediction of
 $h_{c}$
without considering surface tension and gravity. In fact, introducing gravity and surface tension does not improve the model; implying that the surface tension and gravity may not be dominant contributors to the downward growth of the cavity. However, they are important when considering the radial growth and collapse of the cavity as outlined in § 3.
A comparison of the two methods for predicting cavity depth
 $h_{c}$
is shown. The
 $y$
-axis is the measured value of the cavity depth
 $h_{c}$
, while the
 $x$
-axis is the predicted value of
 $h_{c}$
based on two different approaches. The first term on the
 $x$
-axis comes from the energy-based method (
 $h_{c}=\unicode[STIX]{x1D6FA}_{s}d_{s}^{2}/d_{c}$
, (5.8) and (5.9) rearranged), while the second term is from the Bernoulli-based method (
 $h_{c}=l_{s}\sqrt{\tilde{f}}$
, (5.11) and (5.12) rearranged) as marked in the legend. An exact prediction is represented by the dashed line.

6 Conclusion
Many past water impact studies have focused separately on the initial impact of single droplets, jets or solids into a deep pool of liquid. Some groups have loosely connected multi-droplet stream impact to jet and solid-sphere impact (Hurd et al. Reference Hurd, Fanning, Pan, Mabey, Bodily, Hacking, Speirs and Truscott2015; Bouwhuis et al. Reference Bouwhuis, Huang, Chan, Frommhold, Ohl, Lohse, Snoeijer and van der Meer2016), yet have not necessarily studied an expansive range of parameters nor threaded the underlying physical scaling laws together quantitatively. Despite the fact that the initial impact of multi-droplet streams create different cavity aesthetics (rough ridges) when compared to the cavities made by jets, or solid hydrophobic spheres (figure 1), our experimental work shows that all initial impact types create intrinsically similar cavities that can be connected by physical arguments.
Empirically, we show that the diameter of a cavity made by a multi-droplet stream matches that made by a jet if the diameter of the droplets are 1.75 times the jet diameter. This modification in diameter is valid over a large range of impact parameters. The cavity types can be separated by introducing a new dimensionless number we coin the ‘matryoshka number’,
 $Mt$
. When
 $Mt<4$
sub-cavities behave independently from the cavity as a whole, forming cavities reminiscent of single-droplet impact. In this region we find three new cavity shapes: sub-cavity 1 collapse, sub-cavity 2 collapse and sub-cavity dome-over. When
 $Mt>4$
the multi-droplet streams act like jets, creating well-known cavities similar to ones created by hydrophobic spheres and distinguished by their pinch-off locations: deep seal, shallow seal and surface seal. Further, the cavities of multi-droplet streams become more smooth, jet-like and approach the jet cavity velocity and depth as the dimensionless droplet stream frequency
 $\tilde{f}\rightarrow 1$
. Each of the regimes can also be accurately predicted by the
 $Bo^{\ast }$
and
 $We^{\ast }$
numbers, as one might expect. Finally, the cavity dimensions (i.e. pinch-off depth, cavity depth and cavity diameter) can be predicted from a simple energy balance or by expanding the work of Birkhoff & Zarantonello (Reference Birkhoff and Zarantonello1957) on jets.
The scope of future work might include the effect of increasing jet and droplet sizes (if possible), predicting when each sub-cavity will dome over and finding a theoretical explanation for the scaling of the cavity diameter between multi-droplet streams and jets (e.g. 1.75 found in figure 5). There is also the question of continuous impact of the jet or multi-droplet stream, and how the underwater bubble field will interact with the incoming stream and whether similar cavities can be formed after the initial impact and collapse of the first cavity. One application of these findings might be the impact of multiple objects and object types in succession upon the water surface to influence the cavity shape and resultant forces.
Acknowledgements
N.B.S., T.T.T. and J.B. acknowledge funding from the Office of Naval Research, Navy Undersea Research Program (grant N0001414WX00811), monitored by Ms M. Medeiros. J.B. acknowledges funding from the Naval Undersea Warfare Center In-House Laboratory Independent Research Program, monitored by Mr N. Dubois. N.B.S and T.T.T. acknowledge funding from the Utah State University Research and Graduate Studies Development Grant Program. We gratefully acknowledge Randy Hurd as a helpful editor, reader and discussions starter and for coining the term ‘matryoshka number’.
Supplementary movies
Supplementary movies are available at https://doi.org/10.1017/jfm.2018.204.
Appendix. Alternative scaling
Bouwhuis et al. (Reference Bouwhuis, Huang, Chan, Frommhold, Ohl, Lohse, Snoeijer and van der Meer2016) studied multi-droplet stream impact on a pool using boundary integral simulations with some experimental data for validation. They studied the shallow seal regime for micrometre-sized droplets with
 $Bo\sim O(10^{-4})$
and developed scaling arguments using a modified Weber number defined by the cavity velocity,
 $We_{m}=\unicode[STIX]{x1D70C}U_{c}^{2}d_{d}/\unicode[STIX]{x1D70E}$
, to predict
 $d_{c}$
and
 $t_{p}$
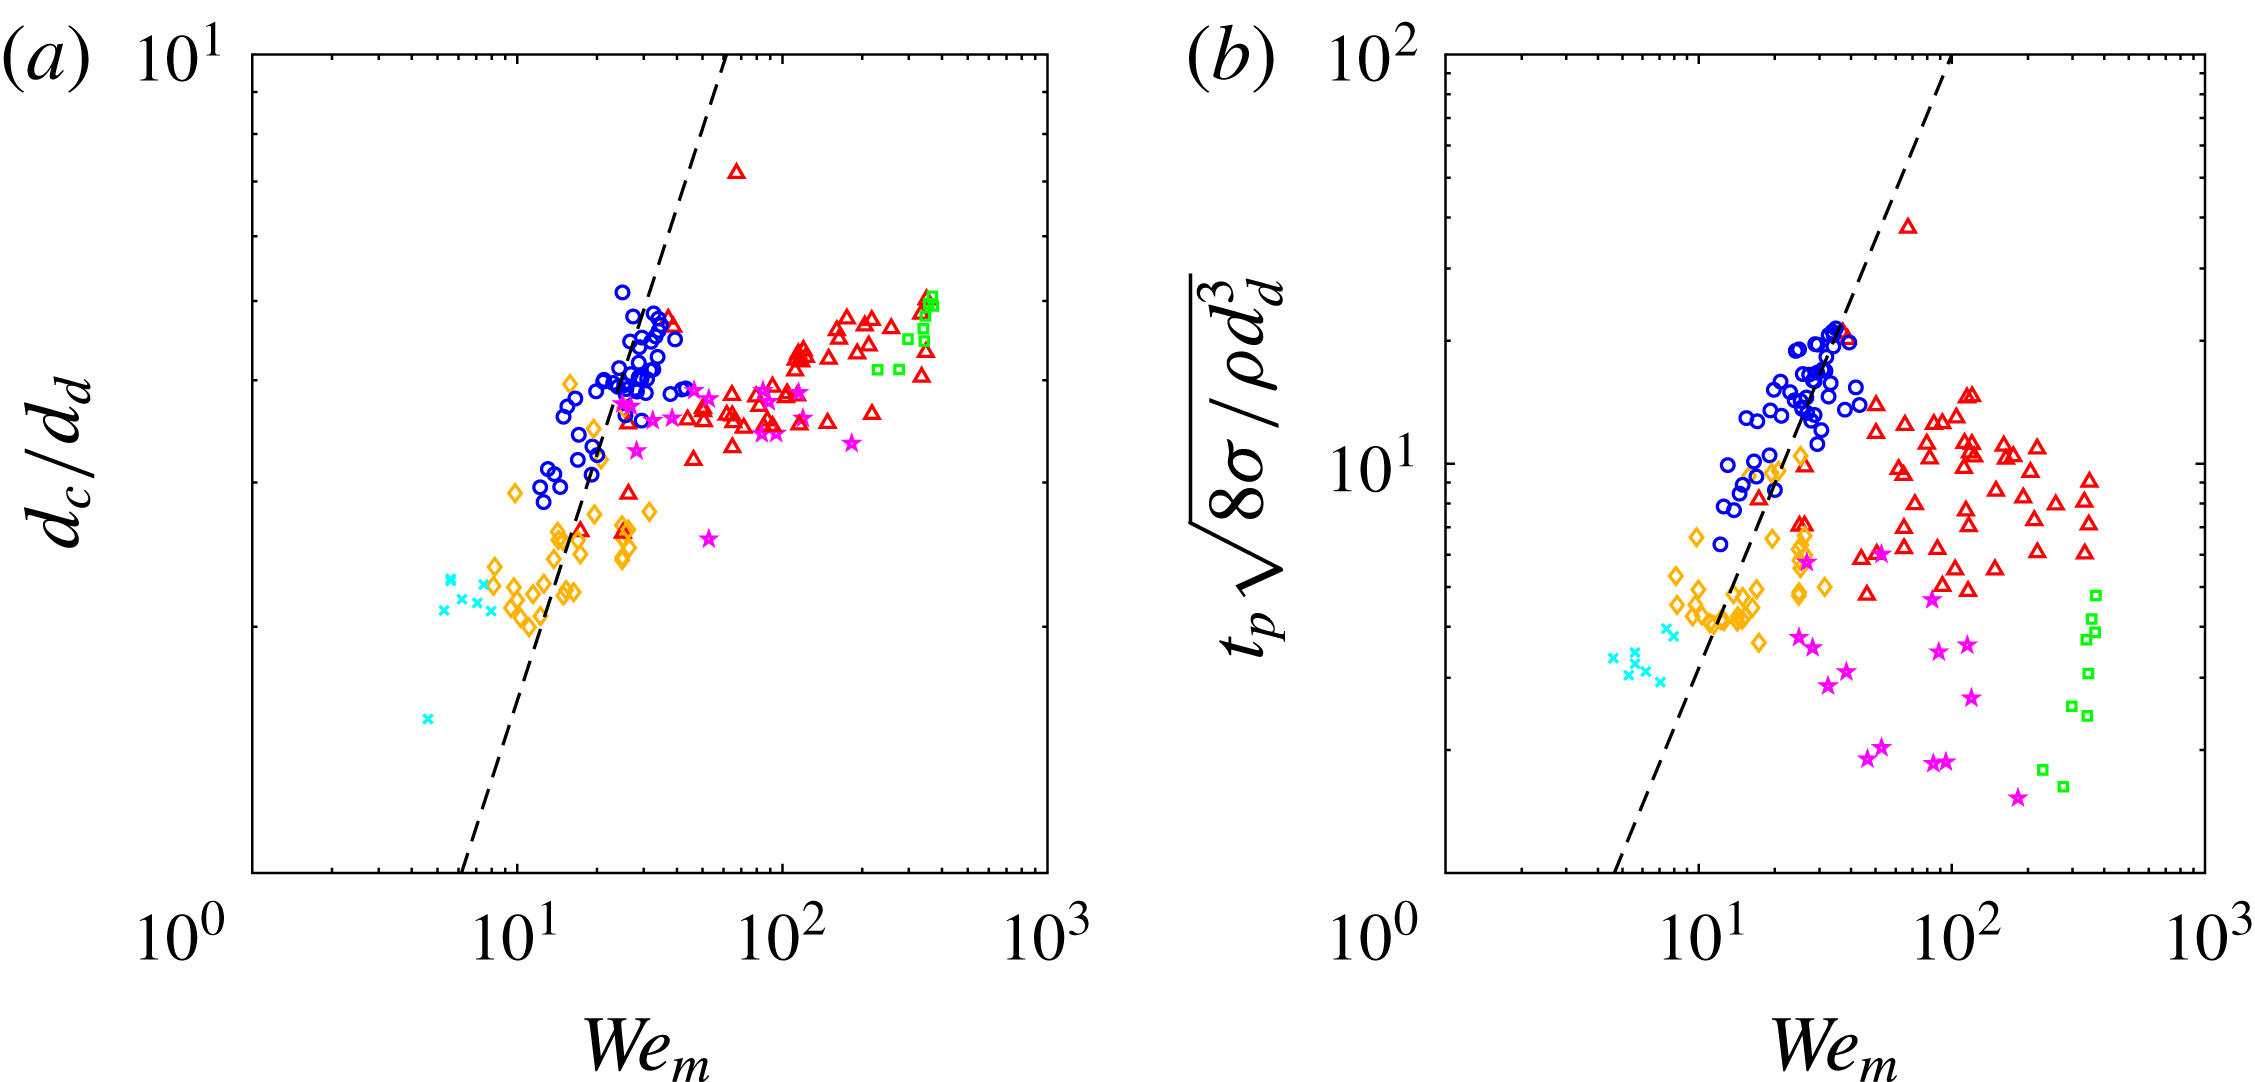
. To verify the validity of these trends over a more expansive parameter range, we plot our experimental data for their proposed scaling arguments. Figure 18 shows that the scaling of
 $d_{c}$
and
 $t_{p}$
works for the shallow seal data in each case, but does not work well for the other pinch-off regimes. The dimensionless cavity diameter was better predicted by plotting it against impact velocity as shown in figure 5 and the non-dimensional pinch-off time is better predicted with
 $We^{\ast }$
as shown in figure 11.
Prediction of
 $d_{c}$
and
 $t_{p}$
with a modified Weber number,
 $We_{m}=\unicode[STIX]{x1D70C}U_{c}^{2}d_{d}/\unicode[STIX]{x1D70E}$
, as discussed by Bouwhuis et al. (Reference Bouwhuis, Huang, Chan, Frommhold, Ohl, Lohse, Snoeijer and van der Meer2016). (a) The non-dimensional cavity diameter is said to scale as
 $d_{c}/d_{d}=0.1625We_{m}$
, shown by the dashed line. (b) The pinch-off time non-dimensionalized by a capillary time scale is said to scale with
 $We_{m}^{3/2}$
, with the dashed line showing
 $t_{p}\sqrt{8\unicode[STIX]{x1D70E}/\unicode[STIX]{x1D70C}d_{d}^{3}}=0.1We_{m}^{3/2}$
. Symbols are outlined in the legend of figure 6(a).