1. Introduction
Fisheries resources in many parts of the world are under threat of extinction due to high mortality rate and habitat destruction (Pauly et al., Reference Pauly, Christensen, Dalsgaard, Froese and Torres1998; FAO Fisheries Department, 2004, 2009). For example, a conservative estimation by Mullon et al. (Reference Mullon, Fréon and Curry2005) reveals that about 25 per cent of the 1,519 FAO world fisheries have collapsed over the last 50 years. With the expected increase in global temperature and human population, the future of wild fisheries remains uncertain and bleak.
Patterns have emerged in natural resource management due to biological differences in habitats, deliberate regulatory measures instituted to control access to these resources in different habitats, different management regimes and differences in harvesting technologies, among other factors. The differences in the abundance of fish stocks in habitats are important requirements for ecosystem resilience since a biomass collapse in one habitat could be revived by the inflow of biomass from an adjacent habitat. According to Elmqvist et al. (Reference Elmqvist, Folke, Nyström, Peterson, Bengtsson, Walker and Norberg2003), response diversity is a crucial requirement for ecosystem resilienceFootnote 1 and it is required to overcome the temporal and spatial variations in disturbances for continuous provision of ecosystem services and for reorganization. The management strategy that fails to recognize sub-stock diversity may as a consequence lead to overestimations of the stock levels and harvest potential and, subsequently, to the collapse of fisheries resources (Sterner, Reference Sterner2007; Akpalu, Reference Akpalu2009). Mills (Reference Mills1972) has also demonstrated that, when spatial externalities are involved, resource allocation that does not consider the spatial externality will be inefficient.
Despite seemingly adequate fisheries management policies in developed countries compared to developing countries, overfishing has been more pronounced in developed countries where improved technologies such as radar tracking devices, bottom trawling and acoustic fish finders are employed in fisheries. As indicated by Pauly et al. (Reference Pauly, Christensen, Guenette, Pitcher, Sumaila, Walters, Watson and Zeller2002), technological progress tends to increase the catchability coefficient and renders ineffective any attempt that seeks to control fishing mortality by limiting only effort. Modernization of fishing gears and vessels, and better knowledge of the spatial and temporal pattern of fish distribution have contributed to the depletion of fish stocks (Hilborn and Walters, Reference Hilborn and Walters1992; Freon and Misund, Reference Freon and Misund1999). Fisheries in developing countries are predominantly artisanal with simple technologies. The decline in global fish production through the introduction of new technologies enables many countries to view marine fisheries as a zero-sum game, a situation which has paved the way for intense competition among industrial countries for marine resources in developing countries (Iheduru, Reference Iheduru1995).
The ratification of the United Nations Convention on the Law of the Sea in 1982 established rules governing the management of the oceans and marine resources. The convention also encourages partnership among countries for the management of marine resources. Typically, the convention stipulates that if a country cannot fully utilize the fisheries resources in its exclusive economic zone (EEZ), the country must make this surplus available to fleets of other countries. Because of differences in fishing technologies, many developing countries have partnership agreements with developed countries to harvest the surplus marine fish stocks in the EEZs of the developing countries. However, access rights are restricted to areas (i.e., offshore) where artisanal fishers do not fish. Although the allocation of EEZs to coastal developing countries was potentially supposed to create significant wealth to improve the economies of such countries, paradoxically, the majority of such countries have drawn down their stocks and deepened poverty simultaneously (Alder and Sumaila, Reference Alder and Sumaila2004; Atta-Mills et al., Reference Atta-Mills, Alder and Sumaila2004; Hannesson, Reference Hannesson2008). This could partly be due to the nature of appropriation agreements between the resource-rich developing countries and the developed countries, and the inadequacy of policy instruments employed to regulate catch by the foreign fleets.
Different theoretical models have been developed to analyse the interactions between coastal developing countries and distant water fishing nations (DWFNs) in the management of fish stock in the former countries. For example, Clark and Munro (Reference Clark and Munro1987, Reference Clark and Munro1991) and Munro (Reference Munro, Basar and Haurie1994) provide a principal-agent analysis since coastal states do not exercise full control over the DWFNs. These studies focus on the terms and conditions of granting access but ignore the spatial interactions between offshore and inshore stocks. In addition, Bischi and Lamantia (Reference Bischi and Lamantia2007) provide a discrete dynamic model to assess time evolution of fish stocks in an ecosystem (environment) that is divided into two adjacent zones with different fishing policies. The steady-state stock levels and their stability properties are derived for the case where one of the patches is a protected area. Although these studies have addressed the strategic interactions involved in fisheries agreements between coastal states and DWFNs, they provide few policy measures that coastal states can use to better manage the marine resources and to regulate harvest in EEZs for optimum social welfare. Specifically, whereas the previous studies allude to the relevance of using policy instruments such as taxes to regulate offshore fishing in developing countries, the present study develops a spatial bio-economic model and derives an optimal landing tax. The theoretical results have been empirically investigated using data on artisanal and semi-industrial fishing in Ghana. Our results indicate that, to optimize economic rents, the social planner should impose a landing tax that should be increasing with intrinsic growth rate, the price of fish and the dispersion parameter, but decreasing with the cost per unit effort.
The remainder of the paper is organized as follows. Section 2 presents the theoretical model and derives some important results. The expression for the optimal tax is discussed in section 3. In section 4, we use data from Ghana to illustrate the interdependence of inshore and offshore fisheries and compute the value for the tax. The conclusion is presented in the final section 5.
2. The model
In the fishery under consideration, artisanal fishers use rudimentary technologies to catch fish inshore. We begin by presenting a basic framework for which the offshore serves as a natural reserve (i.e., a source). After the basic framework, which provides a benchmark, we extend the model to a situation where the social planner grants access right to fleets from DWFNs. We extend the model to further derive an expression for an optimal landing fee (tax) that regulates harvest offshore. Finally, we characterize and provide an empirical illustration of the optimal tax using data from artisanal and semi-industrial fishing in Ghana.
2.1. The basic framework
Suppose that a given EEZ of a developing coastal country is subdivided into inshore and offshore. The domestic fishing fleets catch fish from inshore while the offshore serves as a natural reserve. We assume that the social planner does not grant access rights to foreign fishing fleets and there are common species such as sardine, mackerel and tuna in both the inshore and offshore. Let x i denote the biomass density of fish in patch i (i = 1, 2), where x 1 is the density inshore (patch 1) and x 2 is the density offshore (patch 2).Footnote 2 For analytical tractability, we assume the biomass growth function is logistics. Thus

where r i is the intrinsic growth rate in patch i. Let the intrinsic growth rates in the two patches be equal, i.e., r 1 = r 2 = r. Furthermore, suppose the general cost function is

where h i is harvest in patch i, and the following partial derivatives hold:  and
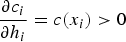 . Let the specific cost per unit harvest be:
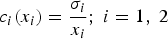
where  , c i is cost per unit effort, and αi is catchability coefficient in patch i. Following Tuck and Possingham (Reference Tuck and Possingham1994) and Sanchirico and Wilen (Reference Sanchirico and Wilen1999), we assume a sink–source relationship between the two patches where the fish stock from deep oceans replenishes the inshore. Let the sink–source (inshore–offshore) relationship be

where  represents the stock dynamics inshore,
 is the stock dynamics offshore and dx 2 is the net migration of the stock from offshore to inshore.Footnote 3 The assumption of sink–source stems from environmental gradient in the ecosystems, which allows for specialization in the patches in terms of spawning and recruitment. Furthermore, the variability in environmental and biological factors, e.g., sea surface temperature (SST) in the Gulf of Guinea Large Marine Ecosystem which influences the abundance of plankton as well as stocks, generates this natural specialization (see, for example, Perry and Sumaila, Reference Perry and Sumaila2007). Moreover, a coastward migratory pattern during the first half of the year is observed for round sardinella and other stocks (Brainerd, Reference Brainerd1991). This evidence is supported by data on fishing in Ghana presented in section 4 of this paper.
In addition, if there is no human predation in patch 2 (i.e., h 2 = 0) the stock dynamics will be in a steady state offshore (i.e.,  , so that equation (4) becomes

Using  , we can re-write equation (5) as

and the inshore stock dynamic equation becomes

where  . With harvest inshore, the social planner's instantaneous profit function is

where p is the price per unit measure, say kg, of fish. The instantaneous profit is the difference between total revenue from harvest (i.e., ph 1) and the total cost of harvest (i.e., c(x 1)h 1). In a dynamic setting, the social planner will maximize the discounted profit function over the planning horizon subject to the resource dynamics. The social planner's optimization program is:

subject to


where δ > 0 is social discount rate. The corresponding current value Hamiltonian is:

where  is a costate variable. This formulation will produce three possible solutions including the bang-bang solution. The possible solutions are:

Assuming an interior solution exists (i.e., h = h*), we have:

Equation (14) implies that the net marginal benefit from harvest (i.e., p − c(x 1)) reflects the user cost of the stock (i.e., λ).Footnote 4 The costate equation is:

where 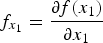 . From equation (15), in dynamic equilibrium, the sum of the capital gain (i.e.,
 and the stock effect (i.e.,
 resulting from preserving a unit of the stock must equate to the marginal benefit of harvesting the unit of the stock now and putting the proceeds in a bank. Following Sydsaeter et al. (Reference Sydsaeter, Strøm and Berck2005), the corresponding transversality condition is

where x* (t) is the value of the stock of fish that maximizes the value function (i.e., equation (9)). This condition must hold for h* and x* to maximize the value function. Moreover, it is assumed that the maximized Hamiltonian is concave in x (i.e., Arrow's weak sufficiency condition is satisfied). In the steady state  so that equation (15) becomes

Using equation (17), we can rewrite equation (14) as

where  , and
 in the steady state. Substituting these into equation (18) gives

with θ > 0; the current result (i.e., equation (19)) provides a different trajectory for the fisheries resource management compared to the conventional result where θ = 0. Thus, if there is no natural reserve (or source), the trajectory that generates the optimal stock is:

After substituting the specific functions, equation (19) can be restated as:

From equations (20) and (21), the stock levels with and without reserve will be equal if θ = 0. But we know that 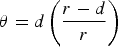 , implying r = d or d = 0 implies θ = 0. Thus, the optimum stock levels with and without the natural reserve (source) are equal if r = d or d = 0. Furthermore, the stock level with the reserve is higher (less) than without the reserve if r > d (r < d). In addition, all else being equal, the optimum steady state stock in patch 1 is maximized at
 . This derives from equating a partial derivative of equation (21) with respect to the dispersion parameter to zero and solving for d (i.e.,
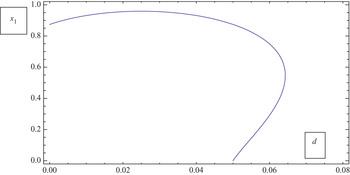
 ). The plot of the relationship between stock levels in patch 1 (x 1) at various levels of dispersion parameter is presented in figure 1. The parameter values conveniently chosen to illustrate the relationship between the stock level and the dispersion parameter are r = 0.05, δ = 0.03, σ = 0.8 and p = 1. The choice of the values is guided by the following assumptions: d < δ< r and σ ≤ p.
Steady-state stock level (x) at various dispersion levels (d).

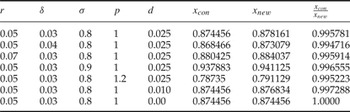
From figure 1, it is clear the stock level in patch 1 increases, reaches a maximum, and decreases thereafter as the dispersion parameter increases. This underscores the fact that the stock level reaches a maximum at a certain level of dispersion. The maximum stock size is realized when d = 0.025. Furthermore we investigate the impact on the equilibrium stock of changes in the chosen parameter values. The simulated results are presented in table 1.
Comparison of the conventional (i.e., θ = 0) and new results (i.e., θ > 0)

Results.All else being equal, the optimum steady state stock size in the sink (patch 1) is decreasing in social discount rate (δ ), the price of fish (p), and catchability coefficient but increasing in cost per unit harvest (c 1) and intrinsic growth rate.
The results obtained from the simulations have intuitive appeal. The negative relationship between discount rate and the stock level implies that the more uncertain society is about the future, all other things being equal, the more likely it is to draw down the fish stock. Secondly, the higher the price the society receives by selling the fish caught, the lower the optimum stock in the management area. Thirdly, if the cost per unit effort increases or the catchability coefficient decreases, the optimum stock level in the management area will increase. Furthermore, a higher intrinsic growth rate will increase the stock within the management area.
2.2. Extended model: human predation inshore and offshore
2.2.1. The offshore fisher's problem
In this section, we present the model for a representative offshore fleet. Suppose the government of the coastal developing country (i.e., social planner) licenses fleets to fish offshore at an ad valorem royalty tax (τ).Footnote 5 Many studies have also demonstrated that landing fees are superior to, for example, quotas, especially in the presence of uncertainties (Weitzman, Reference Weitzman2002; Jensen and Vestergaard, Reference Jensen and Vestergaard2003; Hannesson and Kennedy, Reference Hannesson and Kennedy2005). In addition, an ad valorem royalty tax is flexible enough for cases where there are temporary hikes in the price of fish. With the tax, the instantaneous profit is the difference between total revenue (i.e.,  and total cost of harvest (i.e., c(x 2)h 2). The profit function will be maximized subject to the resource dynamics offshore. The optimization program is

subject to

The current value Hamiltonian is given as

The maximum principle (i.e.,  generates the following possible solutions

Assuming an interior solution exists, we have


The costate equation is

In addition we assume the following transversality condition holds

Furthermore, in the steady state we have  and equation (28) becomes

Substituting equation (30) into equation (27) we have

Using the specific functions, and  in the steady state, we have

Equation (32) is a quadratic function with two possible solutions but only one is admissible (i.e.,  . The admissible solution is

The relationship between the equilibrium stock size and the tax rate cannot easily be signed without making assumptions about the parameter values. However if we assume that d < δ< r and σ ≤ p, a positive relationship exists between the tax rate and the stock size (i.e.,  .
An intuitive explanation of the relationship between the stock offshore and the tax rate is quite obvious: the offshore stock corresponding to a higher tax rate will be higher than that of a lower tax rate.
2.2.2. The social planner's problem
To account for the preceding extension, the instantaneous profit function is modified so that the social planner's optimization program is:

subject to equations (35) and (11), i.e.,


and equation (32), i.e.,  , and
 .
Since the foreign fleet must at least break even after paying the tax, we impose an additional constraint of an isoperimetric form. This constraint guarantees that the discounted net revenue from commercial fisheries is non-negative over the entire planning horizon. Examples of applications of the isoperimetric constraints can be found in, for example, Doherty and Posey (Reference Doherty and Posey1997), Caputo (Reference Caputo1998, Reference Caputo1999) and Akpalu and Parks (Reference Akpalu and Parks2007). The constraint is specified as:

Substituting x 2 (τ) and h 2 (τ) for x 2 and h 2 respectively, the current value Hamiltonian of the social planner's problem can be specified as:

The first order condition with respect to harvest inshore (i.e.,  is:

Furthermore,  , which gives

or

Note that ω is not a user cost but a Lagrangian multiplier of the isoperimetric constraint. The isoperimetric constraint is binding if it takes a positive value. In addition to equations (38) and (3) we have the following optimality condition:

Assuming an interior solution exists for the harvest, the first order condition can be restated as:

The costate equation is

In the steady state  , and equation (42) becomes

Substituting equation (43),  , and
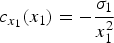 into equation (41) gives

Furthermore, substituting  into equation (44) gives

However, due to the functional forms of some of the terms in the two equations, closed form solutions are complex. Employing the preceding assumptions about the parameter values (i.e., d < δ< r and σ ≤ p) there exists a positive relationship between the stock in the source and the tax rate.
3. Seeking an equilibrium royalty tax rate
In this section, we present and characterize the expressions for the equilibrium tax rate that maximizes net benefits.
3.1. Policy options for maximizing net benefits
To obtain the expression for the tax which maximizes total surplus of the fisheries manager, we employ equation (40). From equation (39), ω > 0, hence  , implying

The comparative static analysis of τ with respect to the parameters are  (if r > d),
 and
 . Intuitively, in order to maximize total net benefit from the fishery, the tax rate must increase if the price of fish increases as this provides an incentive to the offshore fishers to catch more. Conversely, the tax must decrease if the cost of effort increases. Furthermore, if the dispersion of the stock from offshore to inshore increases, the tax rate should decrease in order to keep the stock at an economically desirable level. Finally, the tax rate must increase if the stock has a higher intrinsic growth rate, implying that faster growing stocks must be taxed more.
4. Empirical illustration of a sink–source dispersion: the case of offshore–inshore stocks in Ghana
To provide an empirical illustration of the sink–source dispersion that drives our theoretical results and also calculate the optimal royalty tax, we investigate the offshore–inshore fishing in Ghana. The West African coastal countries, including Ghana, are facing declining catches of wild fish stocks due to over-capitalization and habitat degradation. In addition, numerous reports attribute the declining catches of inshore fishers to intensive catches by large and extensive European Union fleets which fish offshore (Atta-Mills et al., Reference Atta-Mills, Alder and Sumaila2004). In Ghana, the EEZ is divided into the Inshore Exclusive Zone (IEZ) and Offshore Exclusive Zone. According to the Fisheries Act, 2002 Act 625, small semi-industrial vessels (SIV), canoes and recreational fishing vessels could exclusively use the IEZ, while large SIVs, or industrial vessels and canoe support vessels could only strictly fish in the Offshore Exclusive Zone. This is not peculiar to Ghana, as fisheries are often zoned such that each region adopts different sets of harvesting policies (Bischi and Lamantia, Reference Bischi and Lamantia2007). For numerical illustration, we use commercial species: mackerel and round and flat sardinella in the EEZ of Ghana.
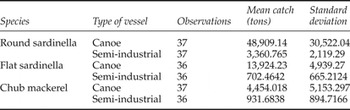
Recent landing statistics for the artisanal fleet indicate that landings peaked in 1992, and then declined due to overexploitation (Koranteng, Reference Koranteng1998). In addition, the catch per unit effort of the semi-industrial fleet has generally declined throughout the period, a clear indication of overfishing. The descriptive statistics of the data are provided in table A2 in the appendix. From the descriptive statistics, the mean catch values for the three species are higher for artisanal fishers compared to inshore fishers. This reflects the relative importance of artisanal fisheries in Ghana.
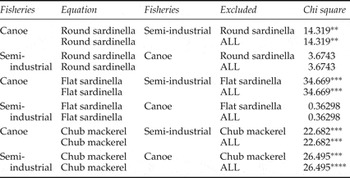
To investigate whether the stock of three major species (i.e., mackerel, round sardinella and flat sardinella) fished inshore and offshore are connected (i.e., the species are migratory), we perfomed a granger causality test on the harvest of each species. The results, which are reported in table A3 in the appendix, indicate a unidirectional line of causality from offshore to inshore for the flat and round sardinella, but a bidirectional line of causality for mackerel in the two fisheries. This implies that the harvest of each of the species offshore could predict the harvest inshore. Invariably, these results confirm that the species are migratory and policies that address overfishing offshore could potentially affect the stock and harvest inshore.
4.1. An estimate of the equilibrium tax rate for Ghana
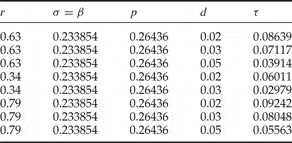
To obtain an estimate for the tax rate that guarantees the stock offshore is at the reserve level, and the tax that maximizes net revenue within the management area in Ghana, we adopted figures from the literature. First, concerning the catch per unit effort and average revenue from catch, we used figures based on artisanal fishing in Ghana from Brinson et al. (Reference Brinson, Die, Bannerman and Diatta2009). The median running cost and revenue per vessel (assuming that a vessel fishes 22 days in a month), which are used as proxies for cost per unit effort and average revenue or price, are US$ 95.88 and US$ 264.36 respectively. The intrinsic growth rate for sardines, one of the most commonly harvested stock in Ghana, adopted from FAO Fisheries and Aquaculture Department (2001) and Tsikliras et al. (Reference Tsikliras, Antonopoulou and Stergiou2007), is 0.63. The tax rate was, however, simulated for lower and upper rates of 0.34 and 0.79 reported in Tsikliras et al. (Reference Tsikliras, Antonopoulou and Stergiou2007). In addition, an estimate of 0.41 for the catchability coefficient for vessels targetting sardinella (Cochrane and Tandstad, Reference Cochrane and Tandstad2000) was used. Furthermore, we used a social discount rate of 3 per cent. We could not obtain a specific value for the dispersion parameters for the sardines so we adopted the following values used for other fisheries: 0.02, 0.03 and 0.05 (see, e.g., Armstrong and Skonhoft, Reference Armstrong and Skonhoft2006; Armstrong, Reference Armstrong2007; Kvamsdal, Reference Kvamsdal2011). The results from the sensitivity analysis of our estimates are reported in table 2. Like the theoretical results, the simulated results reported in table 2 indicate that the optimal tax is directly related to the price of fish but inversely related to the dispersion parameter, intrinsic growth rate, social discount rate and the cost per unit harvest.
Ghana landing tax sensitivity

Note: Price and cost per unit effort are in US$ 1,000.
The calculated tax rates range from a minimun of 3 per cent to a maximum of 9 per cent, indicating the specific rate based on which parameter values are deemed appriopriate for the fishery in Ghana. Nevertheless, the computed rates provide reasonable bounds that could guide offshore fishing policy decisions aimed at internalizing the spatial catch externality. In Ghana, foreign fleets are charged licensing fees as well as fees to acquire fishing rights, which is a one-time payment for a period of time.Footnote 6 The licensing fees have been raised over time from 0.05 per cent mean value of catch in 1995 to 0.6 per cent in 1996 and to 1 per cent in 1997. Beginning in 2003, vessel licensing fees have been tied to the size of the vessel and types of fish landed. Thus, trawlers up to 300 gross registered tonnage (GRT) pay US$ 30 per GRT per annum, while those in excess of 300 GRT pay US$ 55 for every GRT in excess of the recommended 300 GRT (Hutchful, Reference Hutchful2008). Compared to our minimum estimate of 3 per cent tax rate, the fee is very low and unlikely to generate the optimum rent from the fishery.
5. Conclusions
Many coastal developing countries lack the fishing technology to fully utilize the EEZ allocated under the United Nations Convention on the Law of the Sea. As a result, developing countries typically grant DWFNs the right to fish offshore and pay taxes. However, since the offshore serves as a natural reserve and most stocks are highly migratory (as, for example, evidenced by the fishery in Ghana), long-term overall sustainability of the resources could be traded for short-term tax revenue if the policy instrument (i.e., the tax) does not cater for the full implications. Specifically, the offshore natural reserve serves as a source as well as improving the resilience of the overall EEZ. We have developed a theoretical model which sought an optimum policy instrument (ad valorem royalty tax) that developing countries could impose on revenues from catches offshore in order to maximize overall long-term rents within the EEZ and internalize spatial catch externality.
Such an optimum royalty tax should be designed to reflect the ecology of the marine ecosystem as well as the economic conditions related to the catch. Specifically, the tax must increase if the intrinsic growth rate of the fish stock, catchability coefficients of fishing gears or price of fish increases. On the other hand, the tax must be decreasing in cost per unit effort, and the dispersion of the stock from offshore to inshore. Using parameter values obtained from previous studies, the optimum tax rate was calculated for Ghana to be within the range of 3–9 per cent. Since the minimum tax rate is much higher than what the foreign fishing vessels pay, we conclude that the current practice could result in overexploitation and possible eventual stock collapse. It is important for coastal developing countries to balance the short-term benefit with the long-term overall sustainability of the resource when granting access rights.
Appendix
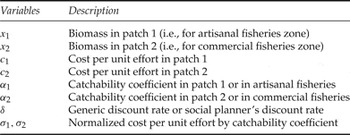
Description of variables and parameters

Descriptive statistics of canoe and semi-industrial catch in Ghana (1971–2007)

Granger causality between canoe and semi-industrial catch of three species

Note: *Significant at 10%; **significant at 5%; ***significant at 1%.