Introduction
Rice is the most important food crop for more than a half of the world's population. It is cultivated in all the continents except Antarctica covering more than 150 million hectares. Among the Asian countries, China and India account for approximately 50% of world's rice area and 56% of production. India possesses nearly one-third of the world's rice-growing area covering around 43 million hectares with a production of 105 million tones with an average productivity of 2.2 t/ha (2011–2012). There are approximately 15 million hectares of rice fields in 24 different countries under threat from cold weather. During the last decade, rice production potential of modern cultivars has remained stagnant. It is essential to increase the rice production in different rice-growing ecosystems to feed the increasing world population. Low temperature stress affects rice yield in northern, north eastern and other high altitude areas of India. The boro rice of India covering around 3 million hectares is affected by seedling-stage cold followed by high temperature during flowering stage. Rice seedlings are sensitive to cold temperature stress leading to slow seedling growth, yellowing, withering, reduced tillering and stunted growth (Kaneda and Beachell, Reference Kaneda and Beachell1974; Zhang et al., Reference Zhang, Su, Chen, Li and Zhu2005; Andaya and Tai, Reference Andaya and Tai2006; Lou et al., Reference Lou, Chen, Sun, Xing, Li, Xu, Mei and Luo2007). Recently, the extent of cold stress has increased due to extreme weather events such as unexpected heavy winter that have inundated wider areas across many regions in Asia. One of the most promising solutions is to develop high yielding varieties that are cold stress tolerant and that are more likely to be rapidly adopted by the farmers in the target regions.
Cold tolerance of rice is a complex quantitative trait, the mechanism of which is difficult to illuminate by the study of any single gene. The development of molecular markers and linkage maps has made it possible to identify quantitative trait loci (QTLs) that control cold tolerance. More than 30 QTLs are reported for expression of seedling-stage cold tolerance in rice and located on different chromosomes (Kim et al., Reference Kim, Sohn and Chung2000; Qu et al., Reference Qu, Chen and Zhang2003; Andaya and Mackill, Reference Andaya and Mackill2003; Zhan et al., Reference Zhan, Zhu and Chen2005; Zhang et al., Reference Zhang, Su, Chen, Li and Zhu2005; Andaya and Tai, Reference Andaya and Tai2006; Lou et al., Reference Lou, Chen, Sun, Xing, Li, Xu, Mei and Luo2007; Koseki et al., Reference Koseki, Kitazawa, Yonebayashi, Maehara, Wang and Minobe2010). It is difficult to utilize the QTLs in cold tolerance breeding programme due to many QTLs involved and lack of validation of the reported molecular markers for various QTLs/gene(s) and epistasis effect. Most of the previous papers reported only mapping informations of those QTLs associated with seedling-stage cold tolerance and no information on breeding application. In this study, a set of 220 genotypes comprising mainly rice varieties of high-elevation regions of India were studied for screening of tolerant genotypes, validation of molecular markers and identification of robust markers for seedling-stage chilling stress tolerance to be used in marker-assisted breeding programme. Deployment of gene(s)/QTLs for cold tolerance in the high yielding background may be helpful for increasing the rice production from cold regions of the rice-producing countries.
Materials and methods
Plant materials and field screening
The study material comprised 220 accessions consisting of land races and improved cultivars collected mainly from Central Rice Research Institute (CRRI) gene bank representing collections from cold regions of the country and cold-tolerant germplasm lines of CRRI (Table S1, available online). The entries were direct seeded in plots with augmented block design having four check varieties during December, 2011. Three rows per entry with 4 m row length were maintained with a spacing of 20 × 15 cm. During seedling stage, field screening of all genotypes were done by noting the change in leaf colour, leaf rolling and plant growth. Evaluation of cold tolerance was measured by phenotypic scale provided by IRRI (Standard Evaluation System (SES) score) ranging from 1 to 9 based on vigour and subtle changes in leaf colour of the seedlings.
Screening under control condition
Forty-six tolerant genotypes with one susceptible check variety ‘Sahabhagidhan’ and another tolerant check variety ‘Kalinga-III’ were taken for confirmation under control screening facility (Table S2, available online). The genotypes were grown in pots under uniform growth conditions at Rapid Generation Advance (RGA)-cum-Phytotron chamber under controlled conditions during April–July, 2012. Fifteen to twenty seeds of each selected genotypes and check cultivars were germinated and planted in partially soil-filled pots. Seedlings were allowed to grow until the three-leaf stage in RGA-cum-Phytotron set at 25°C temperature with 12 h photoperiod. At three-leaf stage, the weak and dead plants were removed and healthy seedlings were retained for cold treatment in the temperature-controlled phytotron growth chamber which was set with 75–85% relative humidity and light intensity of 800 μ moles/s/m2. The seedlings were subjected to 25°C for 3 d followed by a gradual decrease in temperature to 15°C so as to express the trait at >15°C for 7 d; at 8°C for 7 d and then finally constant temperature of 4°C was maintained for 30 d. The experiment was conducted in a complete randomized design with two replications. Evaluation of cold tolerance under control facility was measured by phenotypic scale as per the IRRI-SES score for field screening with miner modification as follows: 1 = seedlings dark green; 3 = seedling light green; 5 = seedling with rolled leaves and light green to brownish yellow in colour; 7 = seedling with rolled leaves and brownish green in colour; 9 = seedling with rolled leaves and brown in colour.
DNA isolation
Leaves were collected from 15 d-old seedlings to extract genomic DNA for molecular screening of cold tolerance among the genotypes. Total genomic DNA was extracted after crushing in liquid nitrogen in microfuge tubes using Cetyl trimethylammonium bromide (CTAB) extraction buffer (100 mM Tris–HCl pH 8, 20 mM Ethylenediaminetetraacetic acid (EDTA) pH 8, 1.3 M NaCl, 2% CTAB) and by chloroform–isoamyl alcohol extraction followed by RNase treatment and ethanol precipitation (Murray and Thompson, Reference Murray and Thompson1980). Agarose gel electrophoresis was used to estimate DNA concentration, and each sample was then diluted to approximately 30 ng/μl.
PCR amplification and visualization of markers linked to cold stress
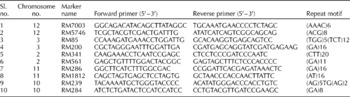
DNA amplification reaction was performed in a volume of 20 μl containing 1.5 mM Tris–HCl (pH 8.75), 50 mM KCL, 2 mM MgCl2, 0.1% Triton X-100, 200 μM each of Deoxyadenosine triphosphate (dATP), Deoxycytidine triphosphate (dCTP), Deoxythymidine triphosphate (dTTP), Deoxyguanosine triphosphate (dGTP), 4 pmol of each forward and reverse primers (Table 1), 1 unit of Taq Polymerase and 30 ng of genomic DNA. Amplification was performed in a Programmable Thermal Cycler (Veriti; Applied Biosystems, Life technologies, Singapore). The reaction mixture was first denatured for 4 min at 94°C and then subjected to 35 cycles of 1 min denaturation at 94°C, 1 min annealing at 55°C and 1 min extension at 72°C, and then a final extension for 10 min at 72°C. Aliquots of 10 μl of DNA products from PCR amplification were loaded in 2.5% agarose gel containing 0.8 μg/ml Ethidium Bromide for electrophoresis in 1 × Tris-Borate-EDTA (TBE) (pH 8.0). A 50 bp DNA ladder was used for determination of size of amplicons. The gel was run at 60 v (2.5 V/cm) for 4 h and photographed using a Gel-Doc System (SynGene).
Molecular markers used for molecular screening of 48 rice genotypes for seedling-stage cold tolerance

Data analyses
Data were scored for computer analysis on the basis of the presence or absence of the amplified products for each genotype–primer combination. The data entry was done into a binary data matrix as discrete variables. Data were analysed and similarity matrix was constructed from binary data with Jaccard's coefficients and dendrogram was generated with unweighted pair group method arithmetic average algorithm, using the FreeTree software (Pavalícek et al., Reference Pavalícek, Hrdá and Flegr1999; Hampl et al., Reference Hampl, Pavlícek and Flegr2001) and the dendrograms were visualized using the Treeview 32 software (Page, Reference Page1996).
Results
Screening of genotypes for seedling-stage cold tolerance
During field screening, 46 genotypes were observed to be tolerant to seedling-stage cold with a score of 1–5. The remaining 174 genotypes that were found to be susceptible to cold stress with more than 5 SES score were rejected. A total of 46 tolerant genotypes with one susceptible check variety ‘Sahabhagidhan’ and another tolerant check variety ‘Kalinga-III’ were taken for confirmation under control screening facility and validation using molecular markers. The screening results obtained under cold chamber are summarized in Table S2 (available online). Susceptible check variety Sahabhagidhan became brownish yellow with rolled leaves leading to an SES score of >5 at 15°C with an exposure period of 7 d, whereas the remaining 47 genotypes showed normal growth and colour. When the genotypes were exposed to 8°C for 7 d, the genotypes exhibiting >5 SES score were Rajlaxmi, Nagaum, Jijiko, Shillong Andeng, Amdeng, Jangia, Kokua, Joha, Geko, Boradhan, Darim and Ampi with rolled leaf, yellow to brown colour and reduced growth. Hence, the above two types of susceptible genotypes are grouped into two susceptible sub-groups. Genotypes showing >5 SES score at a screening temperature of >15°C for 7 d are highly susceptible (HS) types, while genotypes showing >5 SES score at above chilling stress (>8°C) and < 15°C for 7 d are moderately susceptible (MS) genotypes. Govind, Ajay, Satabdi, Krishnahamsa, Kamesh, Geetanjali, Vandana, Ningpung, Paun, Kalinga-III, Padmini, Radang, Manipuridhan, Rungpchi, MR37, Umleng-2, Umleng-1, Langme-1, Mopu, Tazek, Umbo, Serum, Bamak, Lagmin, Tabadugu, Bombi, Langme-2, Itanagardhan, Teze and Ranjit that were with a score of 1–5 with regard to leaf colour and leaf rolling at 8°C were under tolerant group to be classified by further exposure to low temperature. Exposure at 4°C for 7 d to the above genotypes, Pucho, Satabdi, Vandana and Padmini were found to be with a cold tolerance score >5. These four genotypes can be categorized as moderately tolerant group to cold stress at the seedling stage. Govind, Ajay, Krishnahamsa, Kamesh, Geetanjali, Ningpung, Paun, Kalinga-III, Radang, Manipuridhan, Rungpchi, MR37, Umleng-2, Umleng-1, Langme-1, Mopu, Tazek, Umbo, Seron, Bamak, Lagmin, Tabadugu, Bombi, Langme-2, Itanagardhan, Teze and Ranjit that had scores of 1–5 were tolerant group, which needs further exposure for more days under chilling stress for classification under tolerant sub-groups. When the genotypes were further continued under chilled conditions for up to 14 d, only genotype Tabadugu was found to be showing an SES score of >5 for cold tolerance. Hence, Tabadugu is a different one among the tolerant types. This solitary genotype forms a separate group as a tolerant type. The remaining genotypes with a score of 1–5 were Govind, Ajay, Krishnahamsa, Kamesh, Geetanjali, Ningpung, Paun, Kalinga-III, Radang, Manipuridhan, Rungpchi, MR37, Umleng-2, Umleng-1, Langme-1, Mopu, Tazek, Umbo, Serum, Bamak, Lagmin, Bombi, Langme-2, Itanagardhan, Teze and Ranjit that were further exposed for 21 d under chilling stress for classification under tolerant sub-group. At 4°C for 21 d, genotypes exhibiting >5 SES score were Govind, Ajay, Krishnahamsa, Kamesh, Ningpung, Paun, Radang, Manipuridhan, Rungpchi, MR37, Umleng-2, Langme-1, Mopu, Tazek, Umbo, Serum, Bamak, Lagmin, Bombi, Itanagardhan, Teze and Ranjit. This sub-group can be categorized into a highly tolerant (HT) group. Genotypes Geetanjali, Langma and Umleng exhibited a score of 1–5 after 21 d at chilling stress, which are categorized as a very highly tolerant (VHT) group. The highly tolerant genotypes like Kalinga-III (positive check) could survive for 20 d and very highly tolerant genotypes like AC 43281 (Langma), AC 43291 (Umleng-1) and Geetanjali even survived 25 d with a score of 7 under chilling stress. Representative pictures of very highly tolerant, highly tolerant, tolerant, moderately tolerant, moderately susceptible and susceptible genotypes are depicted in Fig. S1 (available online).
Screening for cold tolerance using molecular markers
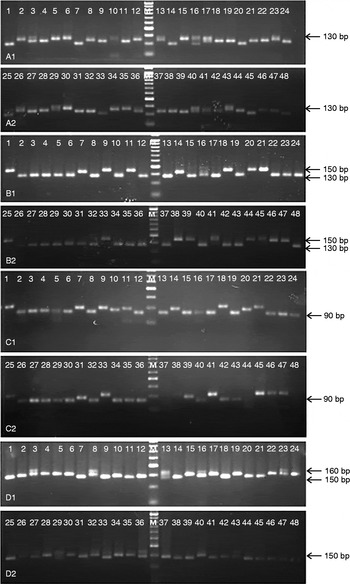
The amplification of genomic DNA of 48 genotypes was performed using known molecular markers for cold stress tolerance (Table 1). The ten molecular markers used here for screening of seedling-stage cold tolerance reflect the majority of intergenic region of cold tolerant genes. Amplicons were obtained with all the ten markers. In toto, 469 amplicons were obtained out of which 64.61% were found in tolerant varieties and 35.39% in susceptible varieties. Fig. 1 shows the representative electrophoregram of the genotypes obtained with various simple sequence repeat (SSR) markers.
Representative amplification pattern with simple sequence repeat markers RM286 (A), RM341 (B), RM85 (C) and RM5746 (D) with the genomic DNA of 48 rice genotypes (lanes 1 to 48 are as in Table S2 (available online)).

RM284 showed one band of 160 bp, which was specific for 19 tolerant types (Jamek, Itanagarghan, Umleng-1, Mopu, Tobadugu, Lengmin, Bamak, Umbo, Langme-1, Langme-2, Bombi, Charmui, Langma, Umleng-2, Ningpung, Radang, Paun, Geetanjali, Rangpchi), with an exception of genotype Jijiko which was phenotyped to be susceptible. A 130 bp band was obtained in nine tolerant types, namely Jamek, Umleng-1, Mopu, Tabadugu, Bamak, Langme-2, Langma, Umleng-2, Rungpchi and two susceptible types Jijiko and Nagaum, in case of RM286. Then, RM85 could differentiate 22 tolerant varieties along with five susceptible ones from the rest of the cultivars with a band of size 90 bp. These tolerant varieties were MR37, Charmui, Langma, Umleng-2, Ningpung, Manipridhan, Radang, Paun, Geetanjali, Rangpchi, Jamak, Itanagardhan, Umleng-1, Mopu, Tabadugu, Langmin, Bamak, Teze, Umbo, Langme-1, Langme-2 and Bambi and the five susceptible varieties included Shillong Andeng, Jijiko, Joha, Pucho and Nagaum. RM341 showed three bands of size 130, 150 and 160 bp of which 130 bp band was obtained in 16 genotypes of which only Vandana, Shillong Andeng, Jijiko and Kokua were susceptible and Jamek, Itanagardhan, Umleng-1, Mopu, Tabadugu, Legmin, Bamak, Teze, Umbo, Langme-1, Langme-2 and Bambi were tolerant. The 150 bp band was obtained in 13 tolerant (MR37, Charmui, Langma, Umleng-2, Serum, Ningpung, Manipuridhan, Radang, Kamesh, Paun, Gitanjali, Rangpchi and Tazek) and 4 susceptible (Darim, Joha, Pucho and Nagaum) genotypes. RM5746 showed a band of size 150 bp in 12 tolerant and 3 susceptible types namely Bamak, Joha, Teze, Umbo, Bambi, Pucho, MR-37, Charmui, Umleng-2, Ningpung, Manipuridhan, Nagaum, Paun, Geetanjali and Rangpchi. These bands were amplified in the varieties, 76–95% of which were of tolerant types.
Clustering
The forty-eight rice genotypes were clubbed into various clusters based on Jaccard's similarity coefficient of various genotypes using cold stress tolerant markers (Table 2). The markers were tested alone and in combination to evaluate their discrimination ability for the phenotype variation among the genotypes (Table S2, available online). Chromosome-wise marker-pair combinations could not show good resolutions for the trait when compared with the single markers. Among the ten numbers of single markers, RM284, RM341 and RM85 showed better resolution and RM239 and RM7003 showed moderate resolution. One cluster of RM284 consisted mostly of the tolerant types and the remaining two clusters were mainly with susceptible types. RM85 also showed a similar pattern but comparatively less resolution than RM284. It formed one tolerant cluster (70.96% tolerant and 29.41% susceptible), and one susceptible cluster with 58.82% susceptible and 25.81% tolerant types. Three genotypes singly formed three separate mono-genotypic clusters. Following RM85, RM341 could group 41.94% tolerant and 23.53% susceptible types into one cluster, 38.71% tolerant and 23.53% susceptible types into second cluster and 19.35% tolerant and 52.94% susceptible types into third cluster.
Simple sequence repeat markers and their combination used for clustering of 48 rice genotypes

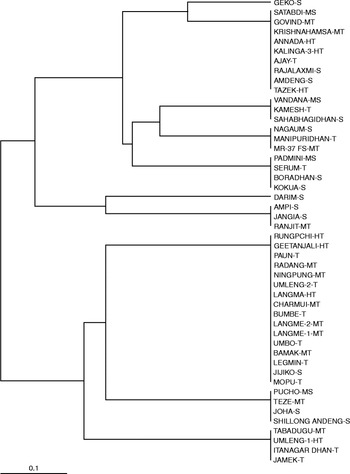
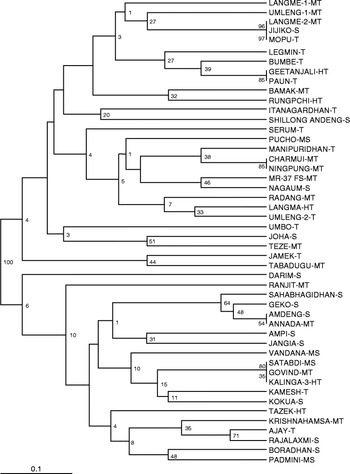
The non-pair combinations were tested because of the less discrimination efficacy of the pair-wise combinations. As RM284 showed best result among the ten markers, other non-pair combinations were tried along with it. Out of them RM284 and RM85 combination showed better grouping of the tolerant and susceptible genotypes. One cluster consisted of 64.52% tolerant and 29.41% susceptible genotypes, whereas the other cluster grouped 70.59% susceptible and 35.48% tolerant genotypes. The other marker combinations with RM284 were not much effective in this regard. The clusters formed contained both tolerant and susceptible genotypes nearly in equal proportion. RM239, the paired marker of RM284, showed a similar pattern with one cluster containing 83.87% tolerant and 88.24% susceptible types and the other cluster with 16.23% tolerant and 11.76% susceptible genotypes. To compare the combination of other markers with this pair, other eight markers were tested for their discrimination ability. Best result was obtained with the combination of RM284, RM239 and RM85 (Fig. 2), which was even better than the RM284 and RM85 combination. It could club 76.47% susceptible genotypes in one cluster and 64.52% tolerant genotypes in the other. When all the markers were taken into account, almost 75% of tolerant genotypes were grouped in one cluster and approximately 71% of the susceptible genotypes were clubbed into the other cluster. The dendrogram (Fig. 3) constructed using all ten markers indicated that 48 genotypes were grouped into two major clusters of which cluster I contains 28 genotypes while cluster II possessed 20 entries.
Dendrogram showing clustering of the 48 genotypes with RM284, RM239 and RM85.

Dendrogram showing clustering of the 48 genotypes with all the markers used in the study.

Discussion
From the study, two types of susceptible genotypes were observed and grouped into two susceptible sub-groups. Genotypes showing >5 SES score at a screening temperature of >15°C for 7 d are highly susceptible (HS) types, while genotypes showing >5 SES score at above chilling stress (>8°C) and < 15°C for 7 d are moderately susceptible (MS) genotypes. Accordingly, genotype Sahabhagidhan is classified as highly susceptible, while Rajlaxmi, Nagaum, Jijiko, Shillong Andeng, Amdeng, Jangia, Kokua, Joha, Geko, Boradhan, Darim and Ampi were classified as moderately susceptible. From the results, the tolerant genotypes can further be classified into sub-groups. Genotypes showing a score of 1–5 for up to 7 d at below chilling temperature ( < 8°C) and >5 score up to 7 d at chilling stress of 4°C were classified as moderately tolerant (MT); genotypes showing a score of 1–5 for up to 7 d and >5 score up to 14 d at chilling stress of 4°C as tolerant (T); genotypes showing a score of 1–5 for up to 14 d and >5 score up to 21 d at chilling stress of 4°C as highly tolerant (HT) and genotypes showing an SES score of 1–5 for more than 21 d at chilling stress are grouped as very highly tolerant (VHT) for chilling stress at the seedling stage.
From the experiment, it is concluded that genotypes like Pucho, Satabdi, Vandana and Padmini are moderately tolerant; landrace ‘Tabadugu’ as tolerant; genotypes Govind, Ajay, Krishnahamsa, Kamesh, Ningpung, Paun, Radang, Manipuridhan, Rungpchi, MR37, Umleng-2, Langme-1, Mopu, Tazek, Umbo, Seron, Bamak, Lagmin, Bombi, Itanagardhan, Teze and Ranjit are highly tolerant and genotypes Geetanjali, Langma and Umleng-1 are characterized as very highly tolerant to the seedling stage chilling stress. Many phenotypic classes of cold tolerance are observed due to presence of many QTLs/genes and their combination in various rice genotypes governing the trait. Various classes of genotypes specific for cold tolerance with different low-temperature regimes and duration were studied earlier; cold tolerance at the seedling stage was evaluated at 10°C for 10 and 13 d (Zhang et al., Reference Zhang, Su, Chen, Li and Zhu2005) or at 9°C for 8, 14, 16 and 18 d (Andaya and Mackill, Reference Andaya and Mackill2003). However, no classification of seedling-stage cold tolerant population is available under chilling stress up to 25 d of exposure to cold stress. Besides, no report of survival of rice plant at chilling stress (4°C) up to 25 d is available till date.
The ten SSR molecular markers used here for screening of seedling-stage cold tolerance showed amplicons. Many QTLs for seedling cold tolerance on chromosomes 1, 2, 3, 4, 6, 8, 10, 11 and 12 controlled cold tolerance of seedlings of rice (Kim et al., Reference Kim, Sohn and Chung2000; Andaya and Mackill, Reference Andaya and Mackill2003; Qu et al., Reference Qu, Chen and Zhang2003; Zhan et al., Reference Zhan, Zhu and Chen2005; Zhang et al., Reference Zhang, Su, Chen, Li and Zhu2005; Jiang et al., Reference Jiang, Xun, Wang and Wan2008; Lou et al., Reference Lou, Chen, Sun, Xing, Li, Xu, Mei and Luo2007; Koseki et al., Reference Koseki, Kitazawa, Yonebayashi, Maehara, Wang and Minobe2010). This indicated that seedling-stage cold tolerance was controlled by multigenes and distributed widely on the rice genome. This also indicated that cold tolerance is developmentally regulated as well as growth stage specific, and that cold tolerance at one growth stage is therefore not necessarily correlated with cold tolerance at other stages (Foolad and Lin, Reference Foolad and Lin2001; Suh et al., Reference Suh, Ahn, Choi, Cho, Hwang and Suh2003). Hence, there is no perfect correspondence of genotyping results with phenotyping results. However, molecular markers like RM284, RM286, RM85, RM341 and RM5746 can be used for marker-assisted breeding programme individually as they differentiated 76–95% tolerant types by exhibiting tolerant specific bands in cold tolerant lines. Marker RM1812 showed specific bands of sizes 210, 130 and 120 bp in three genotypes namely Darim, Ranjit and Rajalaxmi, respectively, whereas two susceptible varieties Jangia and Boradhan shared a single band sized 190 bp. The marker is useful for finger printing of these varieties rather than screening for cold tolerance.
It was interesting to observe that, when all the markers were taken into account, almost 75% of tolerant genotypes were grouped in one cluster and approximately 71% of the susceptible genotypes were clubbed into the other cluster. The dendrogram (Fig. 3) constructed using all ten markers indicated that 48 genotypes were grouped into two major clusters, of which cluster I contains 28 genotypes, while cluster II possessed 20 entries. The majority of the genotypes present in the cluster I are tolerant types while cluster II accommodates mainly susceptible and moderately susceptible types. Both the clusters were separated from each other with a bootstrap value of 100, indicating the robustness of the grouping. Out of the 31 tolerant genotypes, Ranjit (MT), Annada (HT), Govind (MT), Kalinga-III (HT), Kamesh (T), Tazek (HT), Krishnahamsa (HT) and Ajay (T) were grouped under cluster II, whereas the remaining 74.19% tolerant genotypes were clubbed under cluster I. Among the susceptible genotypes, five genotypes, i.e. Jijiko (S), Shillong Andeng (S), Pucho (MS), Nagaum (S) and Joha (S), were grouped under cluster I, whereas the remaining 70.59% genotypes were grouped in cluster II. The rest of the 25% of the tolerant genotypes that stood with the susceptible ones might possess the other QTLs for cold tolerance, those that are not considered in this study. There are more than 30 QTLs reported for cold tolerance. The tolerant genotypes like Govind, Krishnahamsa, Annada, Kalinga-III, Ajay and Ranjit were consistently closer to the susceptible ones, whereas the susceptible genotypes like Nagaum, Pucho, Joha, Jijiko, Shilong Andeng, Kokua, Darim and Vandana consistently showed relatedness to the tolerant types according to the genotypic study with the ten markers. Though many QTLs for cold tolerance at seedling stages have been identified in rice, the genetic relationship of cold tolerance between the two stages is still unknown and the QTLs may be distributed widely on the rice genome. Genotypes possessing only miner QTLs for cold tolerance may be phenotyped as cold susceptible. Minor QTLs have been reported by Suh et al. (Reference Suh, Jeung, Lee, Choi, Yea, Virk, Mackill and Jena2010). Interaction among genes for cold tolerance is also reported (Wang et al., Reference Wang, Wang, Zhou, Wang and Zhang2011). Moreover, the trait may be developmentally regulated (Foolad and Lin, Reference Foolad and Lin2001) and the chilling sensitivity of rice may vary during the life cycle (Zhang et al., Reference Zhang, Su, Chen, Li and Zhu2005).
Cold tolerance in rice is a complex trait and many QTLs are involved in expression of tolerance phenotype. Incorporation of many cold tolerance QTLs into high yielding rice genotypes can be achieved through marker-assisted breeding programme. Individual use of molecular markers like RM284, RM286, RM85, RM341 and RM5746 can be applied in marker-assisted breeding (MAS) breeding, but combination use of non-pair markers like RM284, RM239 and RM85, which was even better than RM284 and RM85, is more effective. However, combined use of all ten markers can be most effectively employed for cold tolerance MAS breeding.
Supplementary material
To view supplementary material for this article, please visit http://dx.doi.org/10.1017/S1479262115000192
Acknowledgements
The authors are thankful to Director, Central Rice Research Institute, Cuttack, for providing all support to the research work.