Introduction
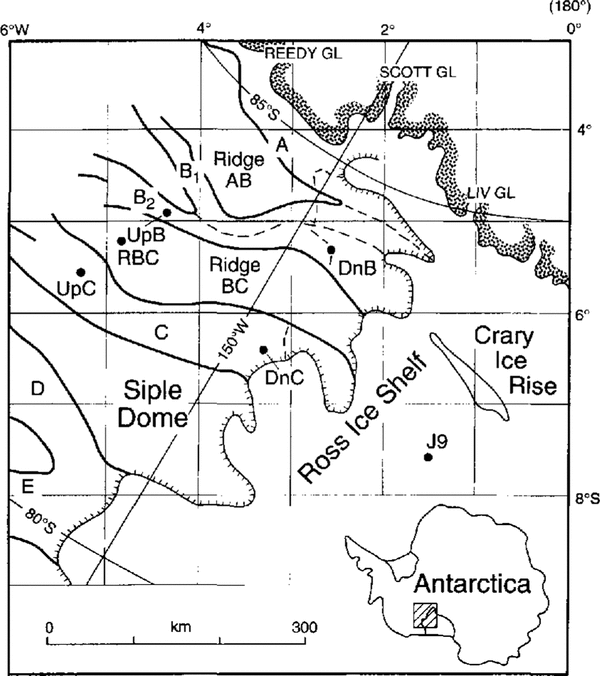
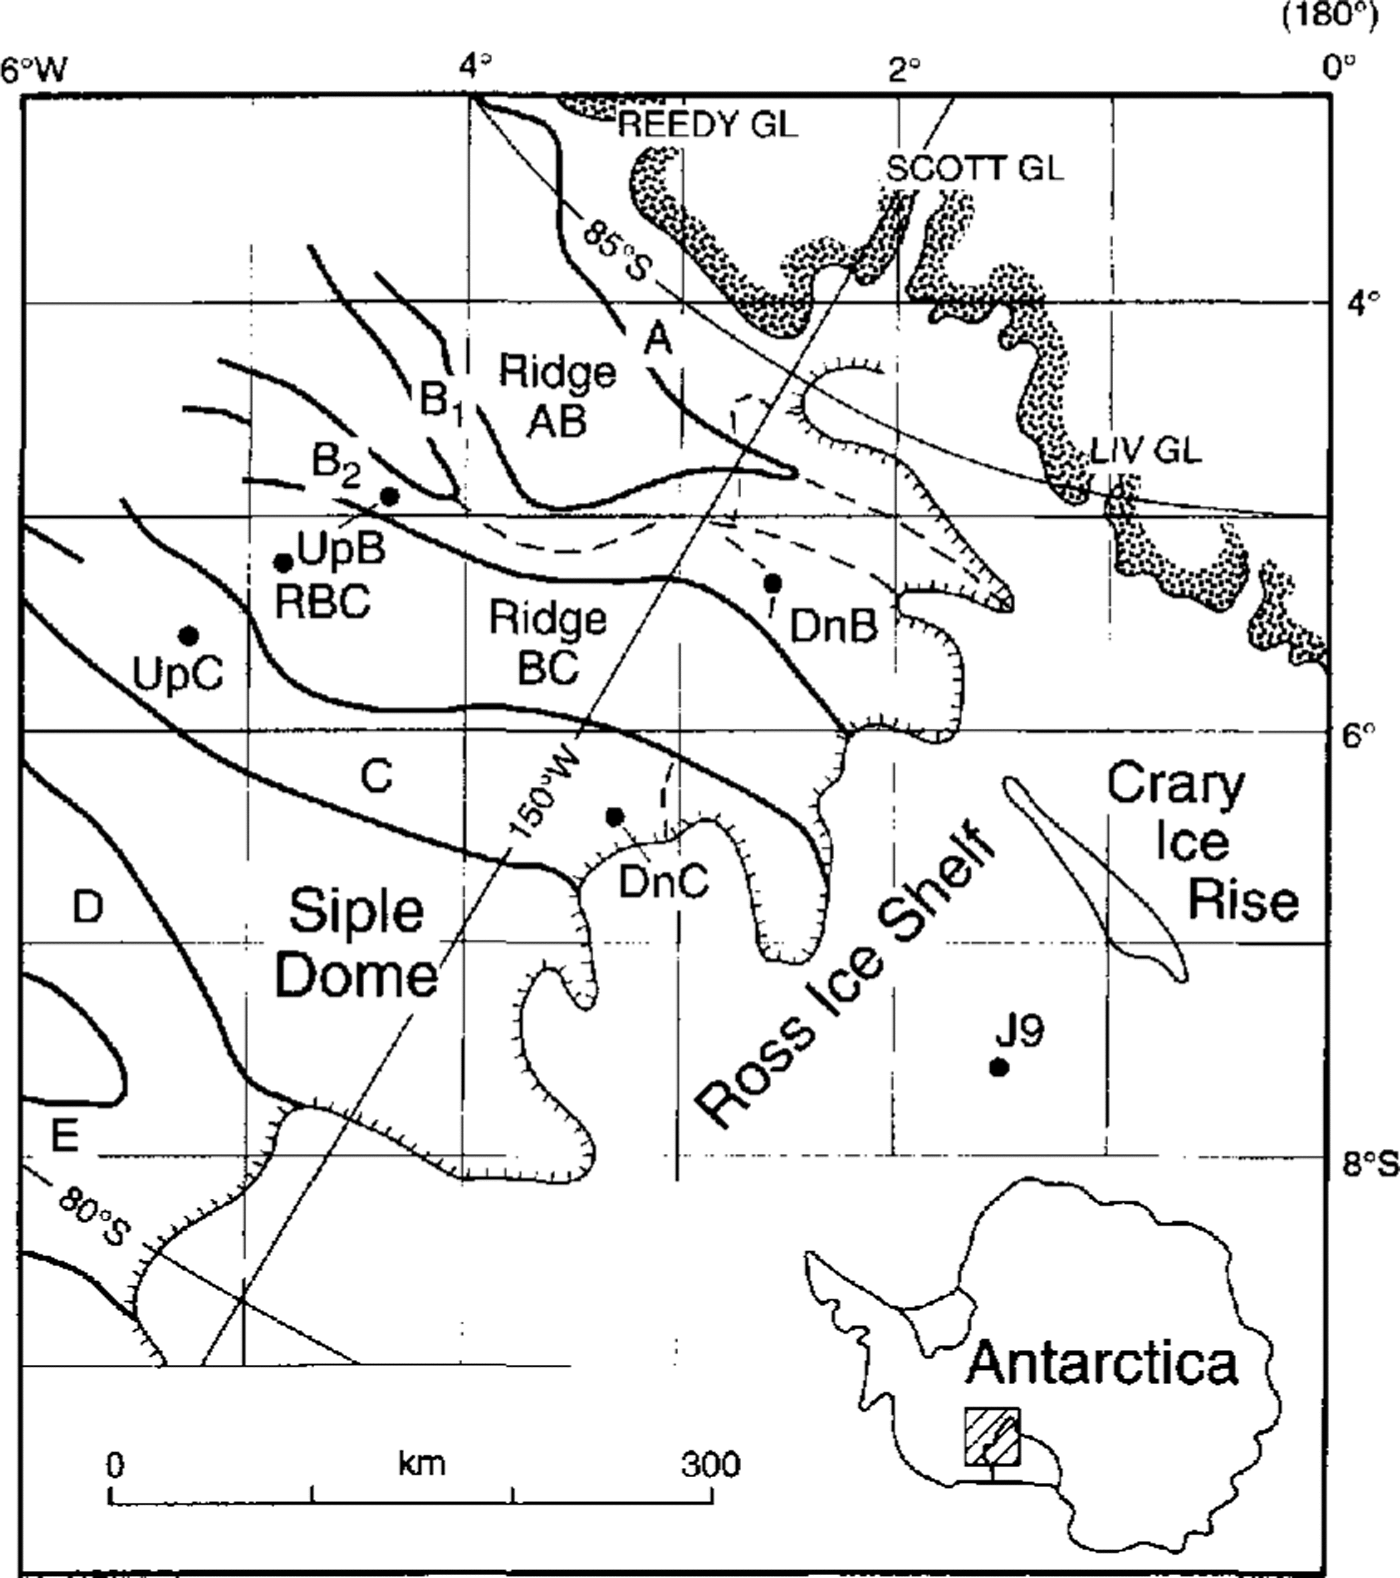
The University of Wisconsin-Madison has conductedseismic experiments during four field seasons on Ice Streams Band B and C, West Antarctica. The objective of these experiments was to investigate the basal conditions be neath these ice streams and how they might affect their dynamic behavior. We have already reported on the characteristics of the ice/bed interface be neath stations Upstream B (UpB) and Upstream C, centrally located on the two ice streams, as revealed by the phases of seismic P-wave reflections (Reference Atre and BentleyAtre and Bentley, 1994). Here, wereport on a similar investigation at Downstream B station (DnE) on the ice plain of Icc Stream B Fig. 1.
Alap of the Siple Coast ice streams (shaded)showing the location of stations Downstream B (DnE),Upstream B (UpB) and Upstream C (UpC).
Field Work
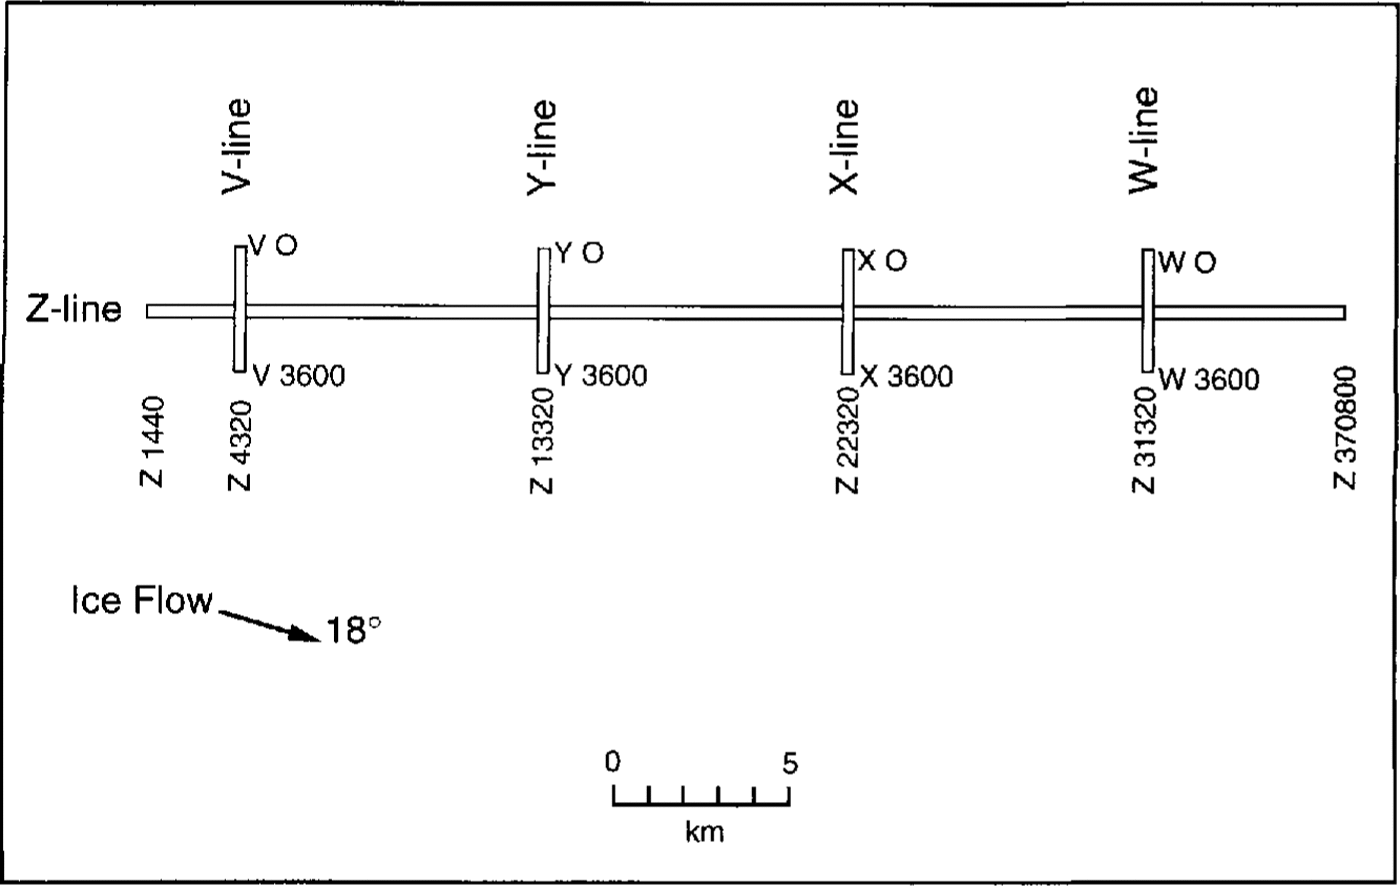
During the 1987–88 field season at DnB, high-resolution P-wave reflection data were collected by S. T. Rooney along a 36 km profile nearly parallel to the direction of ice movement (the Z line) and four 3.6 km transverse profiles I, the V, W, X and Y lines) Fig. 2. For all experiments,the receiving spread was 690 m long with 24 geophones spaced 30 m apart. Sources were 0.15 ( lb) kg or 0.45 kg explosive charges detonated in boreholes 14–18 m deep. Amplifiers had á flat frequency response without phase shift within the frequency band employed (50–450 Hz), which extended well beyond the signal frequencies (200–300 Hz). Detailed descriptions of the data collection and reduction can be found in Reference Blankenship, Bentley, Rooney and AlleyBlankenship and others (1987), Reference Rooney, Blankenship, Alley and BentleyRooney and others (1987), Reference RooneyRooney (1988) and Reference AtreAtre (1990). For this study of phases. we have not carried out any stacking, move-outcorrections or any other processing that could conceivably distort the phase information. Instead, we relyon visual inspection of individual seismograms. All these is mograms presented here are displayed with the samegain and all were recorded from 0.45 kg charges.
Diagram of the seismic survey lines at DnB. The arrow shows the direction of ice movement.
Reflection Phases
For a detailed discussion of acoustic impedance (the product of density and P-wave speed), the condition for P-wave phase reversal, the process of identifying thephase, and the justification for using real (rather than complex) impedances in both ice and bed, see Reference Atre and BentleyAtre and Bentley (1993). In brief, it turns out that the acoustic impedances in the ice and the dilated bed are nearly the same. Since the condition for a phase reversal is that the impedance in the bed is less than in the ice, small variations in physical characteristics of the bed can make the difference between a phase reversal and no phase reversal in a reflection.
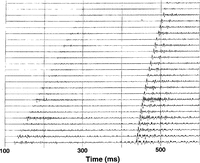
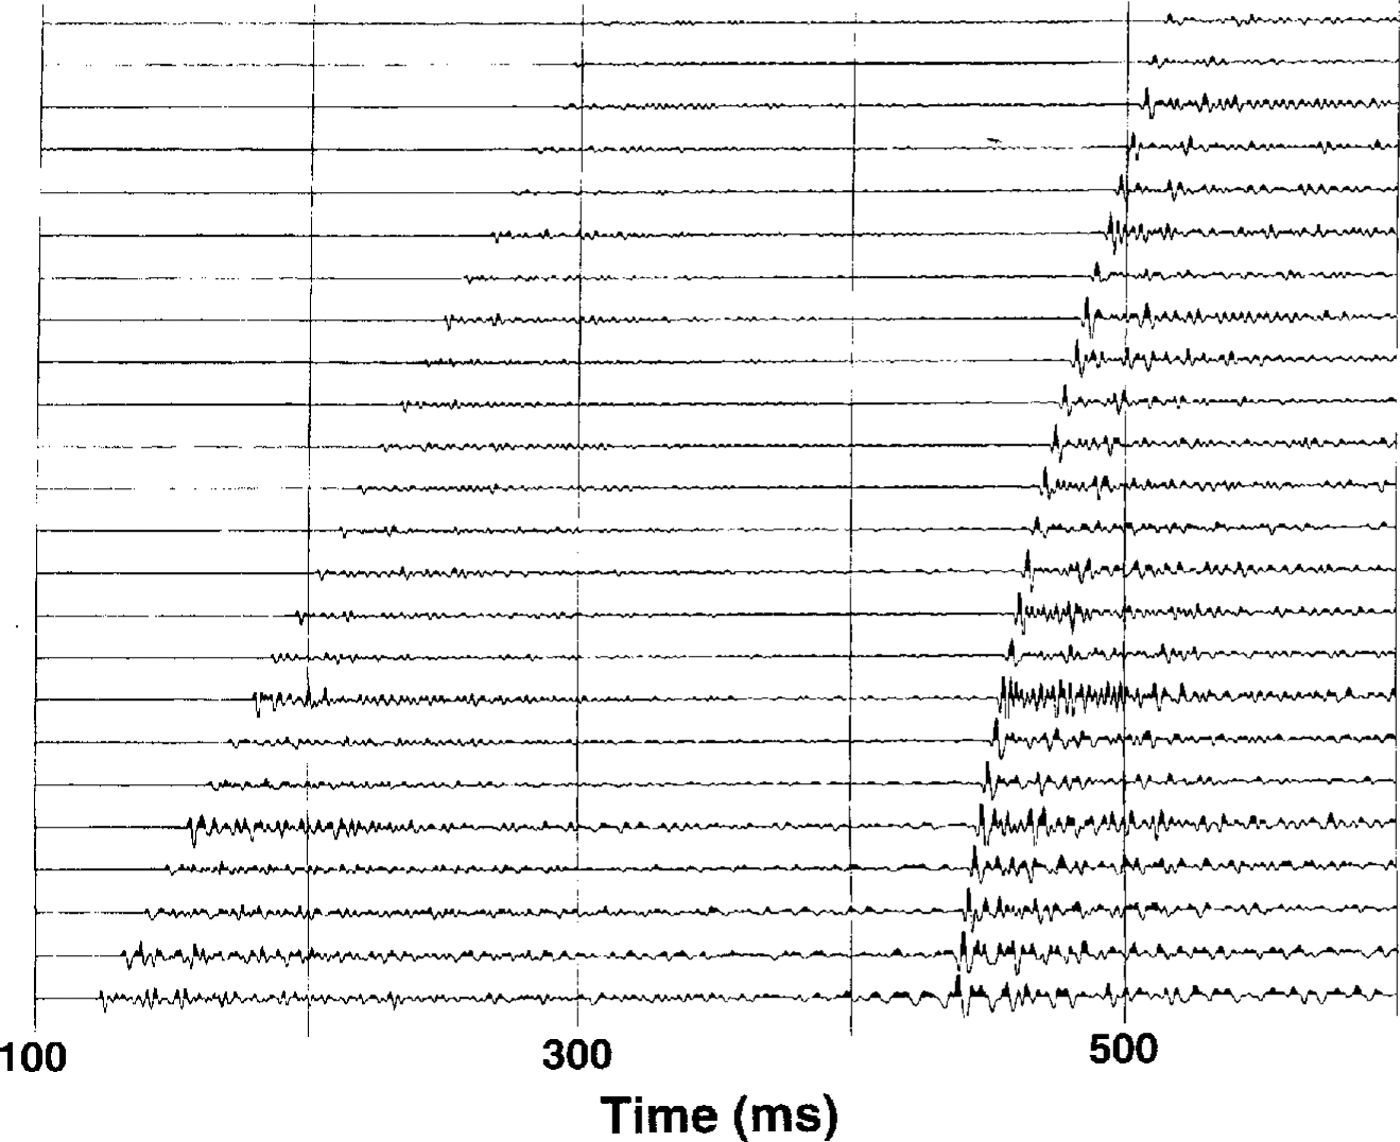
We show here some seismograms illustrating various characteristics of the reflection. On these seismograms,each horizontal line shows the ground motion detected byone of a linear array of seismometers. Upward deflection of the trace is indicative of upward movement of the ground. Time increases from left to right. The first signal to appear is the direct P wave through the ice; the second strong signal, a few hundred milliseconds later, is the reflection from the bed. The seismogram in Figure 3 provides a typical example of the reversed-phase relationshipbetween direct and reflected P-wave arrivals that isclearly observed, with high signal-to-noise ratio, on most of the records. The reversed phase implies that the acoustic impedance of the bed is less than that of the ice(“low-impedance bed”). Another reflection that can be seen in Fig. 3, 20 ms after the basal reflection, is the “ghost” of the basal reflection, produced by the wave first reflected off the ice surface above the shot. It is clear on most traces that the ghost, which undergoes a phase reversal at the free surface, is unreversed in phase. This means that it has been reversed twice, which again indicates phase reversal at the bed.
Seismogram showing reflections at ɀ20160. Shot-detector offsets: 360–1050 m. On this and succeeding seismograms, each horizontal line shows the ground motion detected by one of a linear array of seismometers. Upward deflection of thetrace is indicative of upward movement of the ground. Time increases from left to right. The first signal to appear is the direct P wave through the ice; the second strong signal, a few hundred milliseconds later, is the reflection from the bed Note in this case that first motion in the direct P wave is upward, whereas that in the reflection is downward, i.e. reversed inphase.
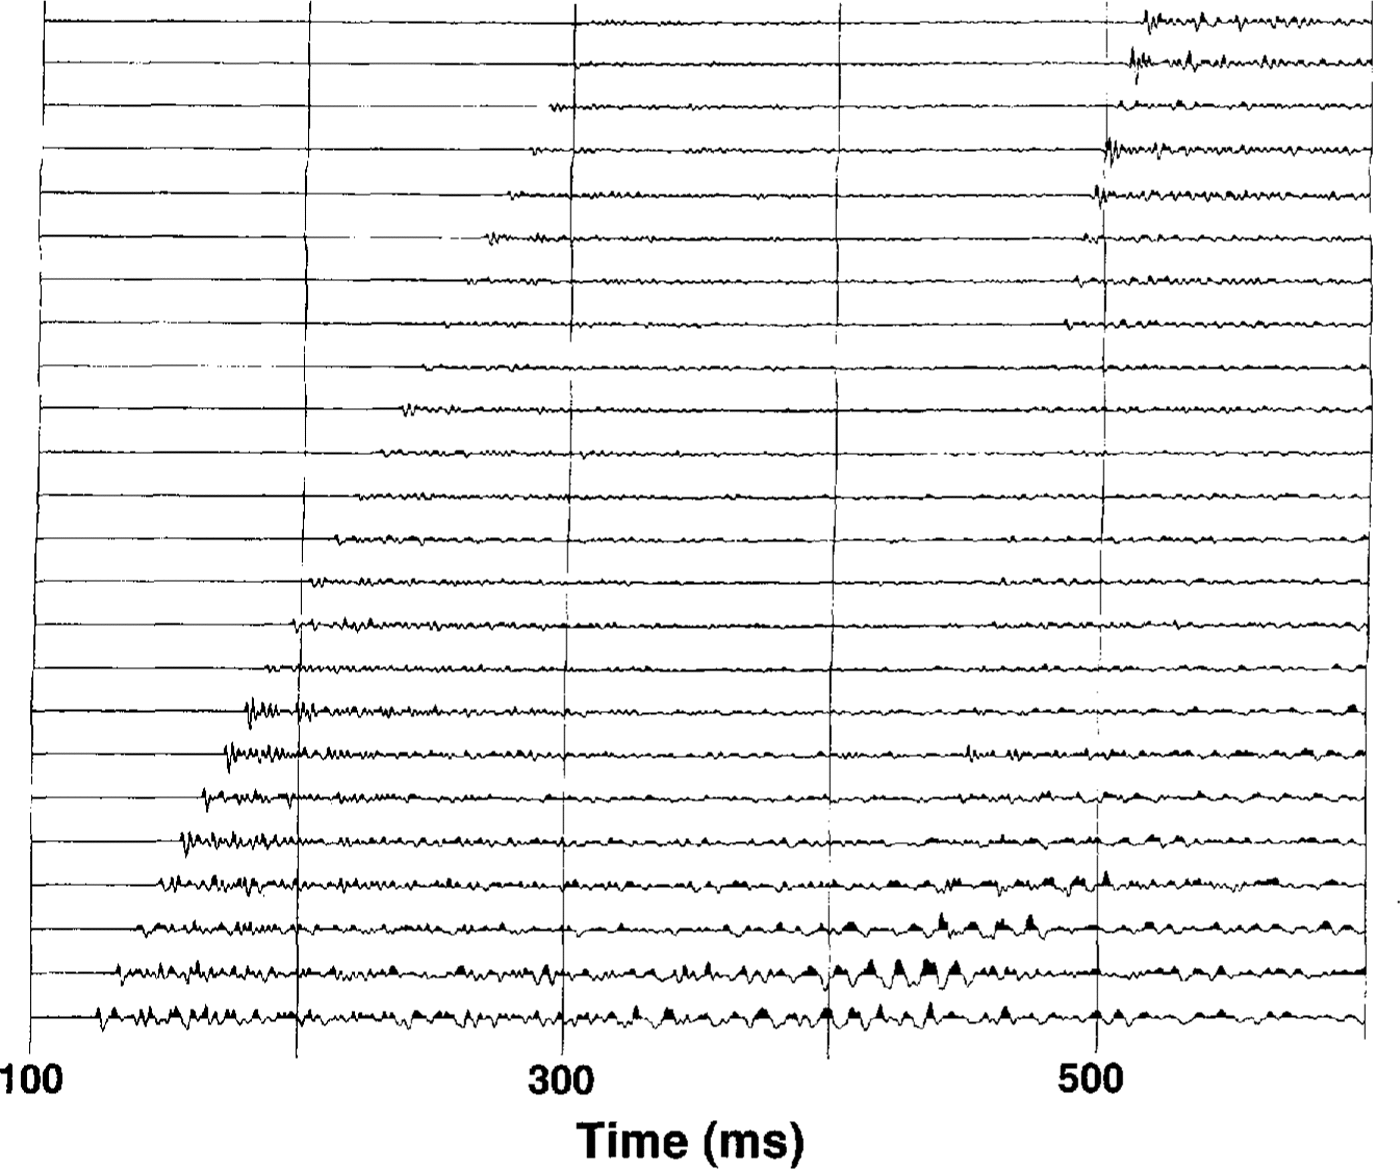
An example of an unreversed-phase basal reflection(with reversed-phase ghost) is shown in Fig. 4. This indicates a “high-impedance” bed, which characterizes about half of the area surveyed.
Seismogram showing reflections at ɀ33120. Shot-detector offsets: 360–1050 m. Here, the first motion is upward inboth the direct wave and the reflection, i.e. the Phase is unreversed.

Reflection Amplitudes
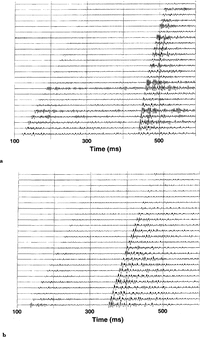
Since we do not have an absolute calibration of reflectionamplitudes, we should like to use amplitude ratios relativeto the direct P wave. Rut the direct P wave, unfortunately,is a poor standard to use at DnB, since it is of tendrastically attenuated by interference from crevasses. Thiscan cause small amplitudes Fig. 3, a large irregularityfrom trace to trace Fig. 3, and/or an abrupt diminution in amplitude beyond a particular distance (Fig. 5a Fig. 6. Consequently, amplitude ratios are quantitatively unreliable. However, it is still possible to make some general observations about reflection amplitudes, because they vary so greatly compared with variations that are likely to occur from other causes considering the uniformity of charge size, shot-hole depth and gain.
Seismograms from shots at the intersection of the V and ɀlines (V1800 and,(ɀ4320). a. Recording along the ɀline.Shot-detector offsets: 360–1050 m. b. Recording along the V line. Shot-detector offsets: 1080–1770 m.

Seismogram showing reflections at ɀ23400. Shot-detector offsets: 360 1050m. Note that the reflection virtually disappears on some traces.
Observations
There are several observations that we can make aboutthe characteristics of the reflections. We have chosen several sample seismograms to illustrate our points.
-
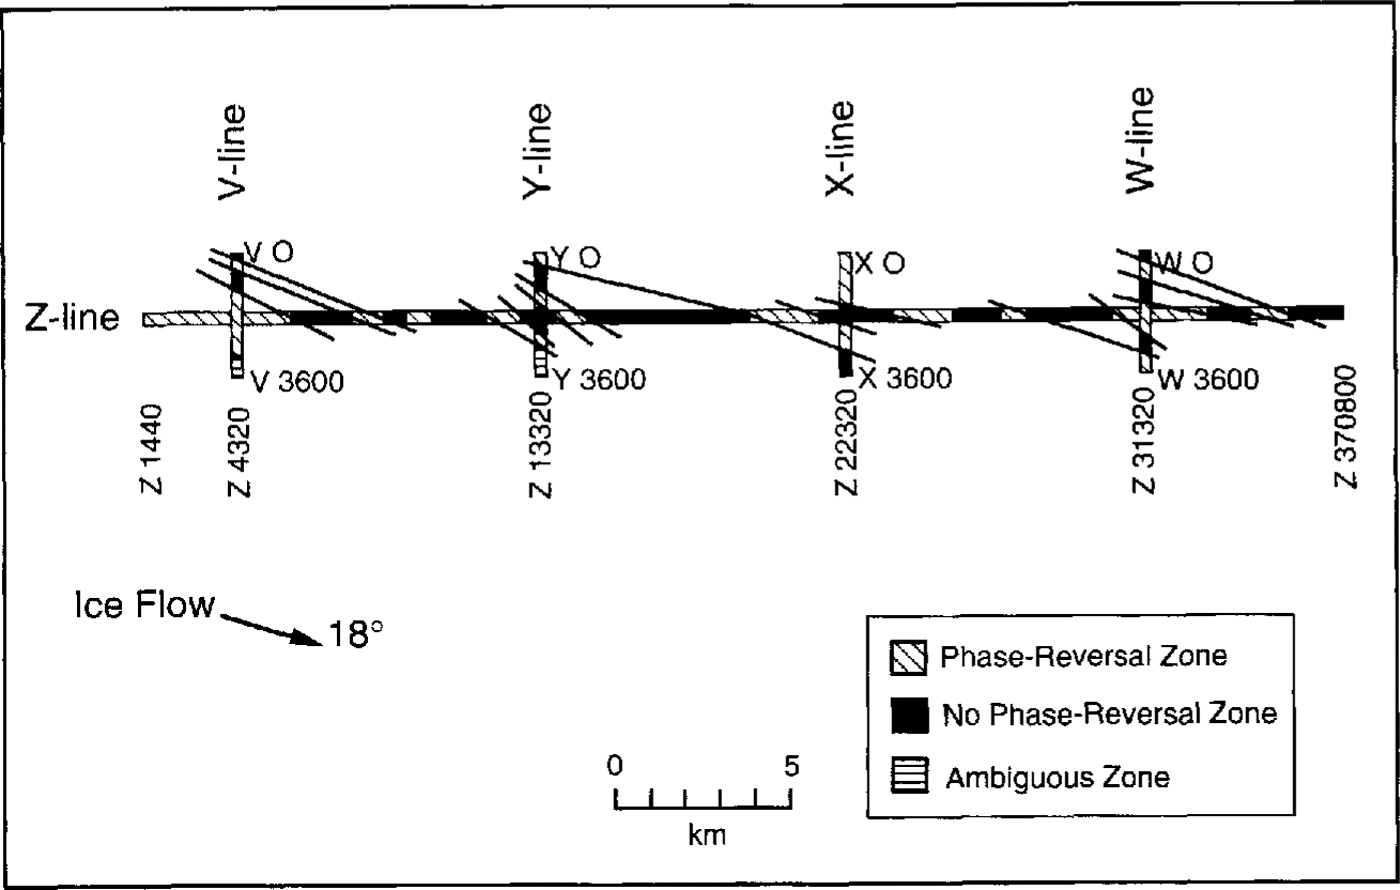
The entire survey is characterized by frequent spatial switches between a low-impedance bed anda high-impedance bed Fig. 7. Each bed type covers about half of the region.
-
There is agree men t in phase on records on the Zline and the transverse lines near their crossingpoints Fig. 5.
-
Reflectivity varies more rapidly across How thanparallel to How. Half the records from the transverseprofiles show marked changes in amplitude acrossthe spread, compared with only one-tenth of thoseon the Z line. This is true of both reversed-phaseand unreversed-phase reflections.
-
The reversed-phase and unreversed-phase zonescan be correlated between the Z line and the transverse lines. Two different correlations arepossible; one of those, which we prefer, yields stripes of reversed and unreversed phase that arequasi-parallel to flow Fig. 7. (The other correlation would yield stripes at about 60° to How; such an orientation would be difficult to explain.)
-
The unreversed-phase reflections are fairly weak,with reflection-to-direct-P-wave ratios of I or lessFig. 4. By contrast, the reversed-phase echoesvary widely in strength, from undetectable Fig. 6to several times as large as direct P wave Fig. 5.In several cases, a large change takes place withina single record Fig. 6, although we have notfound a clear switch between reversed andunreversed in a single record.
Diagram of the seismic survey lines at DnB showing the reversed-phase and unreversed-Phase zones. Short straightlinesegments are drawn to show our prefened correlationS between zones. The arrow shows the direction of ice movement.
Discussion
At UpB and UpC, the principal profile lines were transverse to the direction of ice movement (“flow”). We concluded that changes from “low impedance” to“high impedance” probably arose from changes in the nature of the sedimentary component of the subglacial dilated till (Reference Atre and BentleyAtre and Bentley, 1993). That would implythat the reflection phase should be more consistent from record to record along the ice stream than across it,because sediments of the same type should be draggedinto stripes parallel to now by the ice-induced deformation of the till. Evidence From the secondary lines at UpBand UpC, which ran parallel to flow, supported this ideabut the lines were too short to produce a convincing test.Here, the long line is at a small angle (18°) to now and theobservations do indeed support the model (observations1–4).
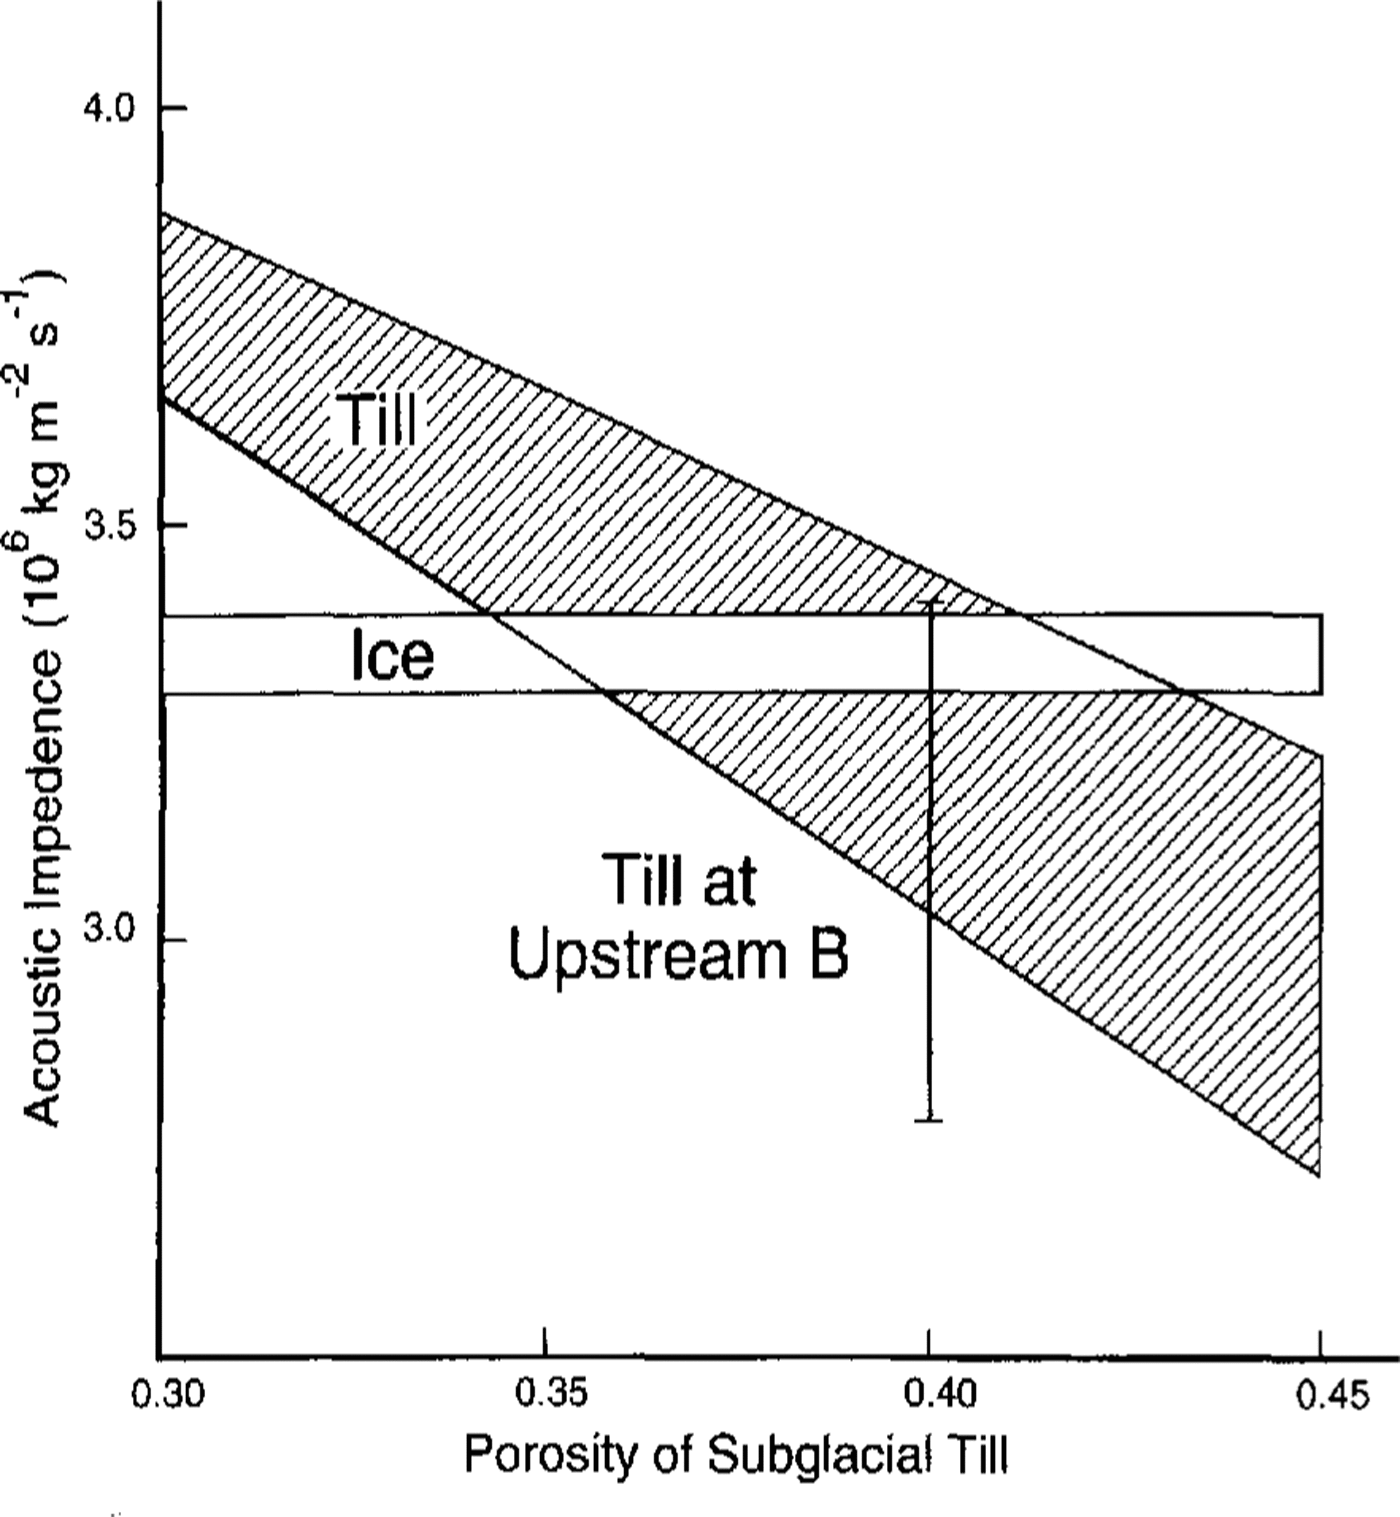
Our previously developed model for unreversed phases at UpB also implied that they would necessarily be fairly weak, because the high porosity of the bed,~40 (Reference Blankenship, Bentley, Rooney and AlleyBlankenship and others, 1987; Reference Kamb and EngelhardtKamb and Engelhardt, 1991), was inconsistent with an acoustic impedance in the bed much larger than that in the ice,(Fig. 8). That implication is borne out here (observationj). On the other hand, there would be no such limitationfor reversed-phase reflections, because there is nonecessary limit on the proportion of water present at the bed. In fact, we believe it likely the stronger reflections(observation 5) arise from pooled water under the ice. Asthe acoustic impedance of water is only about 1.4 × 10⁶(kg m–2 s1) less than half that of ice, water at the bedcould easily produce an acoustic-impedance contrast with the ice that is an order of magnitude larger than the contrast between icc and till. (The acoustic impedance would depend upon the thickness of the water layer.) The occurrence of free water beneath the ice on the ice plain would not be surprising (Reference Alley, Blankenship, Bentley and RooneyAlley and others, 1987).
Acoustic impedance versus porosity for ice and till. The vertical line shows the range of possible values at UpB. (From Reference Atre and BentleyAtre and Bently, 1993.)
Conclusion
Seismic reflection profiling on the ice plain of lee Stream B reveals an ice-bed interface that varies laterally inacoustic ratio between greater than 1 and less than 1, justas found before beneath the trunks of Ice Streams Band C. A previously developed model that explains thevariability in terms of lateral changes in the nature of thesubglacial deforming till is supported by the observationsat Downstream B. In addition, there is good evidence ofpooled water beneath the ice in this boundary regionbetween the ice stream and the ice shelf.
Acknowledgements
We thank S. T. Rooney, D. D. Blankenship, N. Lord,S. Anandakrishnan, J. Kempf and L. Powell, whoconducted the field work on Ice Stream B, and personnel of the Polar lee Coring Office, University of Alaska, fortheir efficient preparation of the seismic shot holes. Thisresearch was supported by U.S. National Science Foundation grant DPP86-14011. This is contribution No. 542 of the Geophysical and Polar Research Center, University of Wisconsin-Madison.