Hand hygiene (HH) by healthcare workers (HCWs) is one of the most effective strategies to prevent healthcare-associated infections.Reference Boyce and Pittet 1 However, compliance with recommended HH practices remains low in many hospitals.Reference Erasmus, Daha and Brug 2 – Reference Brouqui and Aladro 4 Reliable methods are needed to monitor adherence to recommended HH practice because adherence rates form the basis of improvement initiatives. Adherence rates are also used to determine the effectiveness of interventions and to plan targeted educational programs.Reference Boyce 5
The current gold standard for determining HH compliance is direct observation. 6 This method facilitates the assessment of HH techniques and can establish specific compliance rates for different HCW types and situations. However, direct observation is costly and time consuming, and it can capture only a very small fraction of HH activity in healthcare environments. The Hawthorne effect also modifies the behavior of HCWs under direct observation.Reference Haas and Larson 7 – Reference Hagel, Reischke and Kesselmeier 10
The recent developments in electronic HH monitoring systems offer potential means to address these limitations.Reference Azim, Juergens, Hines and McLaws 11 Electronic dispenser counters record HH activity by tracking counts of dispenser usage. HH compliance is estimated using the HH activity quantified by the counters and an appropriate denominator—the number of opportunities in which HH is required. As differences in patient acuity affect HH requirements, the denominator should reflect variations in hand hygiene opportunities (HHOs) across various hospital settings. Past studies have shown that HHOs vary by provider and unit type,Reference Goodliffe, Ragan and Larocque 12 – Reference Scheithauer, Oude-Aost and Heimann 16 but there is a paucity of information regarding the number of opportunities that occur on specialty units such as step-down units and the post-partum unit. In addition, available information is limited regarding HHO estimates for each moment or indication.
In a previous paper, we reported rates of HHOs in a tertiary-care teaching hospital on weekdays on general medical-surgical units, adult and neonatal intensive care units (NICUs), and the emergency department.Reference Goodliffe, Ragan and Larocque 12 In this study, we sought to determine the rates of HHOs on additional specialty units, to assess rates of HHOs during the night and on weekends, and to assess variation in HHOs by provider type and by indication.
METHODS
Hospital Setting and Study Sample
The study was conducted at Mount Sinai Hospital in Toronto, Ontario. The academic teaching hospital provides acute care for adults, and the facility has 442 beds among its multiple units. A NICU provides specialized care for infants. Observations were conducted in the adult medical-surgical intensive care unit (ICU), the medical and surgical step-down units (MSD and SSD), all 4 adult medical units, all 4 adult surgical inpatient units, and the postpartum mother–baby unit (MBU). The ICU has 16 beds, while the MSD and SSD have 6 and 4 beds, respectively. In total, there are 99 beds on the medical units and 118 beds on the surgical units. On the MBU, there are 40 patient rooms; among them, 26 are private. Babies not requiring NICU care room with their mothers.
Observer Training
The observers were trained to identify opportunities as defined by the Public Health Ontario “Four Moments for Hand Hygiene,” which categorizes HHOs into 4 moments: (M1) before initial patient/patient environment contact, (M2) before aseptic procedure, (M3) after body fluid exposure risk, and (M4) after patient/patient environment contact. 17 This method effectively combines moments 4 and 5 of the World Health Organization’s “Five Moments for Hand Hygiene” (WHO-5) into M4 and expands the WHO-5 moment 1 to include contact with the patient’s environment. 6 The observers reviewed presentations and training videos on HH provided by the Ontario Ministry of Health and Long-Term Care Just Clean Your Hands program. 18 In addition, the educator of the infection control department demonstrated the application of the 4 moments in patient care scenarios, and the observers shadowed the hospital’s HH auditor as part of their training.
Data Collection
As previously described,Reference Goodliffe, Ragan and Larocque 12 observations were conducted in 1-hour sessions of a single-patient room Monday–Friday during May–August 2013, May–July 2014, and June–August 2015. In 2015, observations were also conducted on weekends on the medical and surgical units. Observations were scheduled so that each unit was observed during the day (8 am–8 pm) and night (8 pm–8 am). For each observation, the patient room or bed space to be observed was selected randomly from all beds in the unit. Observers recorded the duration of each HCW–patient interaction and the number of HHOs for each interaction using a standardized form adapted from the HH auditing tool provided by the Just Clean Your Hands program (see supplementary figure). The same observation form was used in 2013 and 2014; in 2015, the HHOs for visitors were also recorded. When the HCW drew the privacy curtains, HHOs were estimated by asking the HCW to recount the actions that had taken place behind the closed curtain. All HCWs entering the room were included. No identifying information about the HCWs or patients was recorded.
Approval for this study was granted by the institutional research ethics board with a waiver of individual consent.
Statistical Analysis
GraphPad Prism, version 6 (GraphPad Software), and Excel 2007 (Microsoft) were used for data management and analysis. The mean (95% confidence interval [CI]) and median rates of HHOs per patient hour and the interquartile ranges (IQR) were calculated. Both were reported because HHOs were not normally distributed. The Mann-Whitney test was used to compare the differences between day and nighttime HHO rates for each unit. Categorical variables were compared using the χ2 test or the Fisher’s exact test. All statistical tests were 2-sided, with significance set at α=.05. The 4 medical units and the 4 surgical units were grouped as medical or surgical and were analyzed accordingly after confirming that HHO rates did not differ significantly between units.
RESULTS
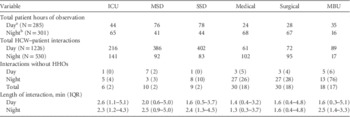
In total, 586 hours of observation were conducted; 49% of observations occurred between 8 am and 8 pm (day) and 51% of observations occurred between 8 pm and 8 am (night; Table 1). The observations included 1,756 HCW–patient interactions. A small proportion of daytime interactions (2%) and nighttime interactions (16%) did not involve a HHO (ie, entering or exiting a patient room without contact).
Characteristics of Healthcare Worker–Patient Interactions by Unit Type and Time of Day

NOTE. HHO, hand hygiene opportunities; HCW, healthcare worker; ICU, medical-surgical intensive care unit; MSD, medical step-down unit; SSD, surgical step-down unit; MBU, mother–baby unit; IQR, interquartile range.
a 8 am–8 pm.
b 8 pm–8 am.
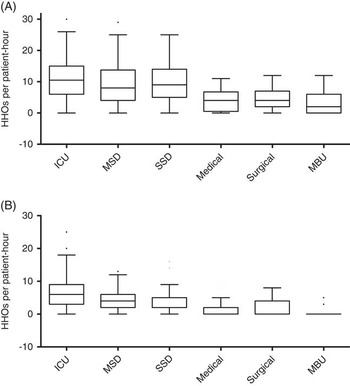
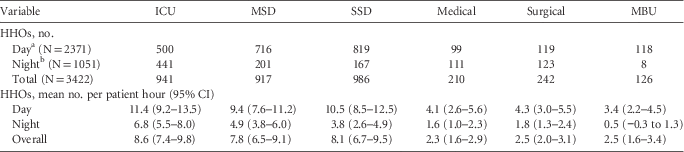
In total, 3,422 HHOs were identified. The number of HHOs per patient hour on each unit is presented in Table 2. During the night, there was a decrease in the rate of HHOs on all units (P<.005 for each unit). Variation in HHO frequency during the day was most notable in lower-acuity units. Box-and-whisker plots of daytime and nighttime HHOs across units are presented in Figure 1.
Boxplot representing the rates of HHOs per patient hour for each unit during the day (A) and night (B). Box plots display the median value and 25th and 75th interquartile ranges. Outliers are represented by dots. The Tukey method was used to plot whiskers and outliers. Abbreviations: HHO, hand hygiene opportunities; ICU, medical-surgical intensive care unit; MSD, medical step-down unit; SSD, surgical step-down unit; MBU, mother–baby unit.

Hand Hygiene Opportunities by Unit Type and Time of Day

NOTE. HHO, hand hygiene opportunities; ICU, medical-surgical intensive care unit; MSD, medical step-down unit; SSD, surgical step-down unit; MBU, mother–baby unit; CI, confidence interval.
a 8 am–8 pm.
b 8 pm–8 am.
Moreover, 12% of observations were conducted in isolation rooms. The rate of HHOs for patients requiring additional precautions did not differ significantly from patients without additional precautions on each unit (P>.05 for each unit; data not shown).
The rate of HHOs for the 4 individual medical units did not differ significantly (P=.68) nor did the rates for the 4 surgical units (P=.52; data not shown). During weekend observations on the medical and surgical units (n=14 patient hours each), we found no statistically significant difference in HHO rates compared with weekdays.
We collected visitor HHO data in the step-down units during the night and in the ICU on both shifts. During the day in the ICU, the median number of HHOs per patient hour for visitors was 0 (IQR, 0–2); During the night, the IQR was 0–0 on each unit (data not shown).
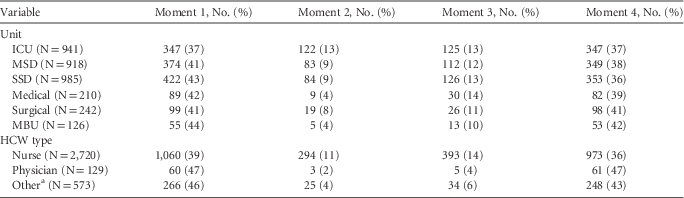
The distribution of HHOs by moment type are displayed in Table 3. The distribution of moments among the different units did not differ significantly, with 1 exception: there was a higher proportion of M2 in the ICU (13%) than in other units (8.1%; P<.0001). M1 and M4 composed the majority of HHOs for all HCW types. However, nurses had greater proportions of M2 and M3 combined (25%) than physicians (6%) and other HCWs (10%; P<.0001).
Distribution of Hand Hygiene Opportunities by Moment Type

NOTE. Data are no. (%) of opportunities for each unit or HCW type. ICU, medical-surgical intensive care unit; MSD, medical step-down unit; SSD, surgical step-down unit; MBU, mother–baby unit; HCW, healthcare worker.
a Respiratory therapists, physiotherapists, porters, social workers, occupational therapists, pharmacists, housekeeping staff, medical and nursing students, infection control practitioners, and all other healthcare workers involved in patient care.
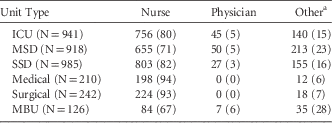
Table 4 shows the distribution of HHOs by HCW type. Most opportunities were identified during nurse interactions (79%). Although nurses made up the largest proportion of HHOs on all units, this finding was most pronounced on the medical and surgical units.
Distribution of Hand Hygiene Opportunities by HCW Type

NOTE. Data are no. (%) of opportunities on each unit. HCW, healthcare worker; ICU, medical-surgical intensive care unit; MSD, medical step-down unit; SSD, surgical step-down unit; MBU, mother–baby unit.
a Respiratory therapists, physiotherapists, porters, social workers, occupational therapists, pharmacists, housekeeping staff, medical and nursing students, infection control practitioners, and all other healthcare workers involved in patient care.
DISCUSSION
In this study, we documented the frequency of HHOs across multiple hospital units, confirming that HHOs are significantly higher on high-acuity units than on general wards. To our knowledge, this is the first study to systematically measure HHOs in step-down and mother–baby units. In step-down units, we counted 7.8–8.1 HHOs per patient hour compared to 8.6 per patient hour in ICU. This finding suggests that step-down units are more similar to ICUs than to general medical and surgical units and that interventions aimed at improving HH in ICUs may be transferrable to step-down units. In addition, we found that a mean of 2.5 HHOs occur per patient hour in the postpartum unit.
Our finding of 8.6 HHOs per patient hour in the medical-surgical ICU is slightly higher than rates reported in 2 previous studies.Reference Steed, Kelly and Blackhurst 13 , Reference Scheithauer, Haefner and Schwanz 15 In ICUs of a tertiary-care hospital in Germany, Scheithauer et al observed 6.8 HHOs per patient hour in the medical ICU and 7.8 HHOs per patient hour in the surgical ICU.Reference Scheithauer, Haefner and Schwanz 15 Steed et alReference Steed, Kelly and Blackhurst 13 estimated similar rates of 7.5 HHOs per patient hour in the medical–surgical ICU of a large teaching hospital in the United States. Both studies used the WHO-5 methodology and monitored all shifts. We used the 4 Moments methodology, which has been suggested to result in 30% more HHOs than the WHO-5 methodology because of the additional recommendation for HH prior to contact with the patient environment.Reference Alper, Allison, Blackhurst, Boeker and Moore 19 Our results suggest that the 4 Moments methodology increases HHO counts by 10%–20%. In a recent study by our team using the same 4 Moments methodology, 13 HHOs per patient hour were observed in the medical-surgical ICU.Reference Goodliffe, Ragan and Larocque 12 However, in that study, only daytime hours were sampled, and the daytime rates from our current study are similar (11.4 HHOs per patient hour in the ICU).
We noted very few visitor opportunities for HH in the ICU and step-down units. Although additional studies of visitor HHOs are needed, our results suggest that HHO denominators derived from existing studies may be accurate despite the fact that they do not include visitors’ HHOs.Reference Azim, Juergens, Hines and McLaws 11 – Reference Steed, Kelly and Blackhurst 13 , Reference Scheithauer, Haefner and Schwanz 15 , Reference Diller, Kelly, Blackhurst, Steed, Boeker and McElveen 20
In medical and surgical units, between 2.3 and 2.5 HHOs occurred per patient hour in our study. This finding is compatible with previously reported rates of 2.75–3.17 HHOs per patient hour.Reference Azim, Juergens, Hines and McLaws 11 , Reference Diller, Kelly, Blackhurst, Steed, Boeker and McElveen 20 Our finding of 4.1 and 4.3 HHOs during the day on medical and surgical units agrees with our team’s previously reported daytime rates of 4.5 and 4.2.Reference Goodliffe, Ragan and Larocque 12
We found no statistically significant difference in weekend HHO rates compared with weekdays. Other studies in medical units have reported slightly decreased HHO rates on weekends. Diller et alReference Diller, Kelly, Blackhurst, Steed, Boeker and McElveen 20 reported 3.2 HHOs per patient hour during the week and 2.8 per patient hour on weekends on a medical unit at a large teaching hospital in the United States. Similarly, Azim et alReference Azim, Juergens, Hines and McLaws 11 estimated 3.2 HHOs per patient hour during the week and 3.0 per patient hour on weekends in a medical unit in a large teaching hospital in Australia.Reference Azim, Juergens, Hines and McLaws 11 It is likely that HHOs are affected by differences in staffing, admission rates, and numbers of procedures on weekends. Therefore, further studies of HHOs that include weekend observations are needed to clarify the impact of these factors.
The number of HHOs per patient hour was higher during the day than during the night on all units in this study. This finding is reasonable, given that nurses cluster care during the night to limit sleep disruptions for patients.Reference Eliassen and Hopstock 21 , Reference Radtke, Obermann and Teymer 22 Differences between daytime and nighttime HHOs of 40% in our ICU were consistent with a previous study that noted decreases of 30%–42% in HHOs in medical and surgical ICUs during the night.Reference Scheithauer, Haefner and Schwanz 15 The difference between daytime and nighttime HHO frequency on our medical floor (60%) was greater than the 40% difference reported by Diller et al,Reference Diller, Kelly, Blackhurst, Steed, Boeker and McElveen 20 who monitored 1,511 patient hours on a medical unit. Despite differences in magnitude, the direction of effect is the same. Only the study by Steed et alReference Steed, Kelly and Blackhurst 13 reported increases in HHOs overnight in a medical-surgical ICU (7%), and in a medical unit (22%). These researchers adjusted their observed HHO rates to account for potential sampling bias. The adjustment factors may have differentially affected their estimates of daytime or nighttime HHOs, and this may explain their findings of increases in HHOs overnight. However, it is also possible that different distributions of care processes or different definitions of “night” versus “day” might have altered rates of HHOs in this study.
Most HHOs in our study occurred before and after contact with the patient or his environment (M1 and M4, 78%). This finding is in keeping with all previous studies described.Reference Azim, Juergens, Hines and McLaws 11 – Reference Steed, Kelly and Blackhurst 13 , Reference Scheithauer, Haefner and Schwanz 15 , Reference Diller, Kelly, Blackhurst, Steed, Boeker and McElveen 20 In our previous study, 81% of HHOs were M1 and M4, which matches our findings. Moments 2 and 3 comprised a larger proportion of HHOs in ICU (26%) and step-down units (21%–24%) than in lower acuity units (14%–19%). This finding is consistent with previous research, in which as many as 42% of HHOs in the ICU were M2 and M3,Reference Scheithauer, Haefner and Schwanz 15 whereas only 13%–18% of HHOs on medical and surgical wards were M2 and M3.Reference Azim, Juergens, Hines and McLaws 11 , Reference Diller, Kelly, Blackhurst, Steed, Boeker and McElveen 20 It is reasonable to assume that intensive care is associated with a higher proportion of aseptic procedures and risks of body-fluid exposure than general care settings. However, Steed et alReference Steed, Kelly and Blackhurst 13 found no difference in the proportion of M2 and M3 HHOs in ICUs compared to medical wards.Reference Steed, Kelly and Blackhurst 13 Their method of sampling HCW ‘activity in progress’ may have led observers to capture more intense nurse–patient interactions and fewer brief interactions on medical and surgical units, thus inflating the incidence of M2 and M3 on those units. Moments 2 and 3 are not included in programs that monitor HH only at room entry and exit. Given that M2 and M3 may be critical to preventing the transmission of pathogens, our findings that they constitute frequent HHOs in ICU provides the impetus for hospitals to invest in monitoring all indications for HH rather than only some.
Most HHOs occurred during nurse–patient interactions in all units for both day and night. This finding was also reported in our previous study.Reference Goodliffe, Ragan and Larocque 12 Steed et alReference Steed, Kelly and Blackhurst 13 also showed that the greatest proportion of HHOs was associated with nurses. Knowledge of the types of HCWs that have the greatest HH requirements may be useful in developing targeted HH programs that would lead to an appreciable impact on HH adherence rates.
Our study has several limitations. Data collection was performed during the summer months for the years during which the study was conducted; we did not evaluate potential seasonal differences in HHOs. Interrater reliability was not assessed. However, the rigorous training of observers and the use of standard data collection forms lessen the chance that the moments for HH were recorded inaccurately. Our data were collected at a single site, and our HHO measurements are not applicable to hospitals serving different patient types and providing different services.
Assessment of HH compliance through direct observation is a labor intensive and costly endeavor. More cost-effective methods to assess HH activity such as electronic dispenser counts provide the number of HH actions, but calculating compliance also requires the number of HHOs as a denominator. Our study provides the HHO estimates for multiple inpatient unit types including critical, intermediate, and noncritical units for both the daytime and nighttime periods. Our findings, which have shown unit- and time-specific differences in the rates of HHOs, suggest that tailored HHO estimates should be used as denominators to assess HH compliance. Additional data to examine variations in HHOs throughout the year and in specialized care areas are needed to establish a comprehensive picture of HHO patterns.
Acknowledgments
The authors gratefully acknowledge the hard work and support of the other members of the Mount Sinai Hospital Infection Control and Hand Hygiene Observer Teams, Jessica Bartoszko, Meghan Crandall, Addison Bertrand, Wayne Lee, Lorraine Maze dit Mieusement, Sierra Norville, Laura Oberholzer, Janet Randle, Dustin Shulman, Eslyn Thomas, Douglas Willcocks, and James Wong.
Financial support: No financial support was provided relevant to this article.
Potential conflicts of interest: All authors report no conflicts of interest relevant to this article.
SUPPLEMENTARY MATERIAL
To view supplementary material for this article, please visit https://doi.org/10.1017/ice.2016.308.