Introduction
External beam radiation therapy (EBRT) with concurrent chemotherapy followed by brachytherapy has been the standard of care for locally advanced cervical cancer. 1 With the technological advancements in the past two decades, intensity-modulated radiation therapy (IMRT) has been widely used in the treatment of cervical cancer owing to its advantages in delivering highly conformal radiation therapy to the tumour while minimising doses to the surrounding healthy tissues. Though its role in the improvement of survival remains unclear, multiple dosimetric and clinical studies have shown improvement in the toxicity profile of patients receiving IMRT for cervical cancer in terms of gastrointestinal and genitourinary toxicities. Reference Portelance, Chao, Grigsby, Bennet and Low2–Reference Lin, Chen, Lu, Zhao, Tao, Ouyang and Cao5
Nodal involvement has been found in approximately 31% to 67% of patients of locally advanced cervical cancer. Reference Grigsby, Siegel and Dehdashti6 Patients with pelvic and/or para-aortic nodal involvement have been shown to have inferior outcomes as compared to node-negative patients. Reference Raut, Chopra, Mittal, Patil, Mahantshetty, Gurram, Swamidas, Ghosh, Gulia, Popat, Deodhar, Maheshwari and Gupta7 With the incorporation of pelvic and para-aortic nodal involvement into the FIGO 2018 staging system, there has been increased use of lymph nodal boost. Higher dose to metastatic nodes has also been reported to have better regional control. Reference Wakatsuki, Ohno, Kato, Ando, Noda, Kiyohara, Shibuya, Karasawa, Kamada and Nakano8 The NCCN guidelines also suggest treating the grossly involved nodes with EBRT boost to 60–65 Gy. 1 While extended field radiation with conventional technique has been associated with a higher incidence of acute and late toxicities, SIB up to 2·2 Gy per fraction to the involved node has shown to have a better toxicity profile. 9,Reference Small, Winter, Levenback, Iyer, Hymes, Jhingran, Gaffney, Erickson and Greven10
The boosting of involved nodes can be done either by simultaneous or sequential nodal boost. IMRT offers the unique ability to deliver different dose levels to different target volumes through the simultaneous integrated boost (SIB) technique. In addition to the reduction in overall treatment time (OTT), SIB has the radiobiological advantage of delivering higher dose per fraction to the involved nodes. However, weight loss and alteration in tumour size and normal tissues during the course of treatment can result in the organs at risk (OARs) unexpectedly moving into the boost volume itself. By contrast, sequential boost (SeB) to the residual nodal volume enables adaptation based on nodal response after 45–50 Gy. Nonetheless, it can prolong the OTT if delivered prior to brachytherapy.
Though the SIB technique is being increasingly employed with IMRT nowadays due to the delivery of higher biologically effective dose, easier planning and patient convenience, Reference Jayatilakebanda, Tsang and Hoskin11 there is a paucity of studies comparing the dosimetric differences of these two planning strategies in terms of target coverage and normal tissue sparing and none of them considering the interfractional change in the anatomy of the patient and the tumour. The aim of the study was to evaluate and compare the dosimetric parameters between SIB-IMRT and SeB-IMRT for node-positive cervical cancer with special consideration to anatomical change during treatment.
Materials and Methods
Patient selection and target volume delineation
This retrospective study included a cohort of 40 patients of locally advanced cervical cancer with involved pelvic and para-aortic nodes treated previously with pelvic and para-aortic nodal radiotherapy with SeB to residual nodes from March 2017 to June 2018 at our centre. Nodal involvement was proven by imaging including computed tomography (CT), magnetic resonance imaging (MRI) or positron emission tomography (PET-CT) with or without biopsy. All the patients underwent 5 mm slice thickness CT scans from T11 to proximal third femur with appropriate bladder protocol as per institutional practice, and the CT images were transferred to the treatment planning system. The second set of CT scans was acquired after the completion of phase I of treatment, that is, delivery of 45 Gy in 25 fractions at 1·8 Gy per fraction.
Target volumes were delineated as per Radiation Therapy Oncology Group (RTOG) guidelines. For the first CT set (CT dataset 1), the clinical target volume for primary disease (CTV-P) included cervix, uterus, parametrial tissues and upper vagina. Gross tumour volume for lymph nodes (GTV1-N) included the involved pelvic and para-aortic lymph nodes. CTV for lymph nodes (CTV-N) included pelvic and para-aortic lymph nodal regions. The planning target volume (PTV1) was defined by adding 10 mm margin to CTV-P and 7 mm margin to CTV-N. For the SIB-IMRT strategy, PTV for SIB volume (PTV-SIB) was generated by adding 5 mm to GTV-N. In the second set of CT scan (CT dataset 2), residual pelvic and/or para-aortic nodes were contoured as GTV2-N and considered for the boost if the diameter on the short axis was greater than 1 cm. The PTV for SeB (PTV-SeB) was generated by adding 5 mm margin to GTV2-N. Rectum, bladder, bowel bag (abdominal contents inside the peritoneal cavity), kidneys, femoral head, duodenum and spinal cord were contoured as OARs in both the CT sets.
Dose prescription
For the SIB-IMRT strategy, the dose prescribed to PTV1 was 45 Gy in 25 fractions at 1·8 Gy per fraction, while PTV-SIB was prescribed 55 Gy in 25 fractions at 2·2 Gy per fraction. In phase I of the SeB-IMRT strategy, the dose prescription to PTV1 was 45 Gy in 25 fractions. For phase II of SeB-IMRT plan, PTV-SeB was prescribed 12·6 Gy in seven fractions. The EQD2 of total doses prescribed to PTV-SIB and PTV-SeB were 55·92 Gy and 56·64 Gy, respectively, for α/β = 10 (commonly used ratio for tumours) and 57·2 Gy and 55·3 Gy, respectively, for α/β = 3 (commonly used ratio for late-responding normal tissues). The dose fractionation for both the plans was planned such that the EQD2 of doses prescribed to both the PTVs (PTV-SIB and PTV-SeB) for α/β = 10 was approximately equivalent. The EQD2 is calculated using the following formula:
 $$EQD2 = D(d + a/\beta /2 + \alpha /\beta )$$
The details of the dose prescription are summarised in Table 1.
Dose prescription to PTVs in both the plans

Plan generation and evaluation
Volumetric-modulated arc therapy (VMAT) plans with two full rotations (both clockwise and anticlockwise) were generated for both the techniques with 6 MV photons with complementary collimator angles of +/− 30 degree and coplanar beams on Eclipse version 13.5 (Varian Medical Systems). For all the plans, 2·5 mm default dose calculation grid size and Acuros algorithm (AXB version 13.5) were used. The planning optimisation was performed as per goals as mentioned in Table 2. The Progressive Resolution Optimizer (PRO, version 13.5) engine was used for optimisation, and intermediate calculation was performed during optimisation.
Planning aims for target and OARs

SeB-IMRT plan
Phase I of SeB-IMRT plan was made for 45 Gy in 25 fractions followed by phase II boost plan for 12·6 Gy in 7 fractions generated on a fresh CT scan (CT dataset 2). Both the plans were summed to calculate the final effective doses for the SeB-IMRT plan.
SIB-IMRT plans
SIB-IMRT1 plan
The CT of phase I was utilised to generate a SIB plan, and a dose of 45 Gy was prescribed to PTV1 and 55 Gy to PTV-SIB for 25 fractions.
SIB-IMRT2 plan
In order to understand the effect of nodal regression and change of normal tissue topography and to account for weight loss during the course of phase I RT, the second SIB-IMRT plan was generated by utilising the PTV-SIB plan for 44 Gy in 20 fractions (EQD2 44·25) and reproducing the same plan on CT dataset 2 for 11 Gy in 5 fractions.
The plans were evaluated quantitatively by dose volume histogram (DVH). Both the plans were optimised such that 95% of the PTV received 95% of the prescribed doses. The dose constraints to the OARs were based on EMBRACE II protocol. 9
Statistical analysis
Statistical analysis of DVH of target volumes and OARs was performed. The three treatment plans were compared with one another using the Friedman test since the data were not normally distributed and had paired readings. A value of p < 0·05 was defined as having statistical significance. Bonferroni correction was used as multiple comparisons were done. The comparison of SeB-IMRT and SIB-IMRT1 plans and SIB-IMRT1 and SIB-IMRT2 plans were done individually using paired t-test for normally distributed data and Wilcoxon test for paired data that were not normally distributed.
Results
The median age of the patients included in the study is 50 years (range 28–70 years). All the patients had Eastern Cooperative Oncology Group (ECOG) performance scale 0 or 1. Twenty-three (57·5%) patients had American Joint Committee on Cancer (AJCC) tumour staging as T2b, while 17 (42·5%) patients had AJCC T staging as T3b. All the patients had both pelvic and para-aortic lymphadenopathy (FIGO 2018 Stage IIIC2). The median number of para-aortic and pelvic nodes per patient was 2 (range 3–12). Majority of the patients had para-aortic nodes in the middle para-aortic region (30%), while 18·7% of patients had lymph nodes in the lower para-aortic region with 2% of patients having them in the upper para-aortic region. Most commonly the lymph nodes were observed around the aorta (94%), while only approximately 6% of patients had the nodes around the inferior vena cava (IVC). Table 3 shows details of the anatomic distribution of lymph nodes in relation to major vessels as suggested by the study by Srinivasan et al. Reference Srinivasan, Gurram, Johnny, Chopra, Dheera, Baheti, Popat, Sable, Rangarajan and Mahantshetty12
Anatomic distribution of lymph nodes in relation to major vessels

* IMA, inferior mesenteric artery.
All the structures including PTV and OARs met the planning objectives except the bowel bag. Table 4 summarises the dosimetric comparison of PTV and OARs between the three plans. The comparison of DVH parameters between SeB-IMRT and SIB-IMRT plans and SIB-IMRT1 and SIB-IMRT2 plans has been mentioned in the appendix.
Comparison of median doses (± standard deviation) to target volume and OARs among the three plans

Target dose coverage
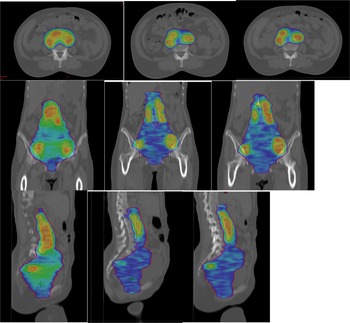
The target coverage measured in terms of V95% of PTV was found to be significantly higher in SeB-IMRT plan as compared to SIB-IMRT1 and SIB-IMRT2 plans (99·2 versus 97·7 versus 97·9, respectively, p = 0·000). There was no difference in V95% of SIB-PTV of both the SIB plans (99·2% versus 99·4%, respectively, p = 0·353). Figure 1 shows dose distribution in the three different plans.
Ninety-five per cent dose colour wash of plans in three different techniques: (a) SeB plan, (b) SIB-IMRT1 plan and (c) SIB-IMRT2 plan

Organs at risk
Bladder
SIB-IMRT1 plan resulted in better sparing of the bladder than SIB-IMRT2 and SeB-IMRT plans with V40 Gy being significant (43% versus 44·6% versus 45·5%, respectively, p = 0·005), whereas there was no difference in volume receiving 30Gy (70·4% versus 70·5% versus 68·8%, respectively, p = 0·087)
Rectum
For rectum, all the three plans attained the planning objectives. Median dose to V30Gy of rectum was significantly higher in SeB-IMRT plan as compared to SIB-IMRT1 and SIB-IMRT2 plans (80·3% versus 79·3% versus 79·8%, p = 0·007)
Bowel bag
SIB-IMRT1 plan delivered significantly lower doses to the bowel bag. V40 Gy of bowel bag for SeB-IMRT, SIB-IMRT1 and SIB-IMRT2 plans were 354·8 cc, 271 cc and 321·8 cc, respectively (p = 0·001), whereas V30 Gy were 687·8 cc, 635·5 cc and 680 cc, respectively (p = 0·001). When the SeB-IMRT plan was compared with SIB-IMRT1 plan and that of SIB-IMRT1 compared with SIB-IMRT2 plan individually, similar results were obtained as shown in Tables 4 and supplementary Table 5.
Femoral heads
There was no difference in Dmax to both the femoral heads in the three plans.
Kidneys
The mean doses for both the kidneys were significantly higher in SeB-IMRT plan as compared to the SIB-IMRT plans. The mean doses for the left kidney for SeB-IMRT, SIM-IMRT1 and SIB-IMRT2 plans were 11·1 versus 10·7 versus 10·9 Gy, respectively, p = 0·0026, whereas that of the right kidney were 11·5 versus 10·9 versus 10·9 Gy, respectively (p = 0·000).
Duodenum
In patients with para-aortic nodal irradiation, SeB-IMRT plan resulted in higher doses to the duodenum as compared to SIB-IMRT1 and SIB-IMRT2 plans.
Discussion
In order to intensify treatment in lymph node-positive cervical cancer patients, nodal boost has been increasingly employed either as SIB or SeB. However, there is limited literature comparing both the treatment strategies for nodal boost. Hence, this study was conducted to assess the dosimetric differences between them in terms of target volume coverage and normal tissues with special consideration to anatomical change during treatment. In the present study, we showed that SIB-IMRT results in better sparing of OARs especially bowel as compared to SeB-IMRT, while SeB-IMRT offers marginally better improvement in target coverage. However, the dosimetric advantage with SIB was considerably lost when the anatomical change during radiotherapy due to weight loss, nodal shrinkage and change in normal tissue topography was accounted for.
NCCN guidelines and EMBRACE II protocol suggest dose escalation to involved nodes to total dose of 55–65 Gy EQD2. 1,9 Nodal boost can be delivered either sequentially or simultaneously with whole pelvis radiotherapy. SIB offers various advantages in terms of reduction in OTT, easier planning and patient convenience. Delivery of a higher dose per fraction to involved nodes in a shorter time period can also have radiobiological advantages. Furthermore, it can avoid potentially overlapping high-dose regions in two separate plans. In their study, Feng et al. compared dosimetric parameters of SIB-IMRT with SeB-IMRT in PET-positive nodal disease and showed a small reduction in physical doses and equivalent EQD2 doses to small bowel and rectum with SIB-IMRT. Reference Feng, Hasan, Kopec and Al-Hallaq14 There was comparable target volume coverage and reduction in higher dose than prescription dose to PTV with SIB-IMRT. As expected, there was a reduction in OTT as well. One of the disadvantages of SeB is the prolongation of OTT which may have detrimental effects on outcomes. However, if the boost is delivered interdigitating with brachytherapy, the entire treatment course can be completed within the recommended OTT.
SeB offers the advantage of offering boost to the shrinking nodal volume in node-positive patients. Few retrospective studies have also questioned the role of nodal boost in all node-positive patients. Wujanto et al. retrospectively compared outcomes of EBRT boost in pelvic node-positive cervical cancer patients and reported similar recurrence-free survival and overall survival in patients receiving boost and no boost. Reference Wujanto, Choo, Tan, Ilancheran, Ng, Low, Shen, Tang and Koh15 A Japanese study reported a 90% rate of pelvic nodal control yet a high rate of distant metastasis in patients with metastatic pelvic nodes not receiving nodal boost which indicates the potential role of systemic therapy. Reference Yoshizawa, Koiwai, Ina, Fukazawa, Sakai, Ozawa, Matsushita and Kadoya16 Kim et al. studied the factors associated with nodal failure in patients not receiving nodal boost and noted that involvement of more than two pelvic nodes was associated with a higher rate of pelvic nodal failure. Reference Kim, Park and Cho17 Hence, further prospective studies for selecting patients carefully for nodal boosts are warranted to avoid unnecessary higher doses to normal tissues, especially those adjacent to the boost volume. The ongoing EMBRACE II study may also help in understanding the effect of nodal SIB on the outcomes and toxicities in node-positive cervical cancer patients. 9
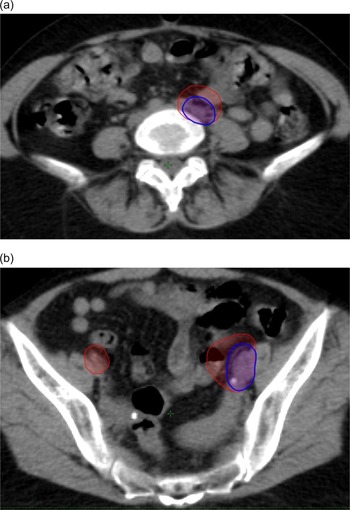
In our study, though the doses received by bowel, rectum, bladder and kidney were statistically significant by SIB-IMRT technique, the difference can be clinically significant with only bowel sparing. However, it is noteworthy to mention that the normal tissue sparing was markedly reduced when the initial SIB-IMRT plan was generated on the CT acquired after whole pelvis radiotherapy to account for weight loss, nodal shrinkage and change in the topography of normal tissues during treatment. Hence, frequent image guidance during treatment with assessment for the need for adaptive replanning for both primary and nodal boost, especially at around 3 weeks after commencement of external beam radiotherapy, should be considered when SIB is being planned to improve normal tissue toxicities. Though no statistical significance could be observed due to the smaller sample size, it was noticed that patients having lymph nodes with diameter more than 1·5 cm on the short axis had frequent movement of bowel inside the boost volume as shown in Figure 2 and may benefit from adaptive replanning.
(a, b) Two examples of nodal shrinkage during the course of radiation and the movement of bowel inside the PTV-SIB. The contour in red shows the representation of PTV-SIB on the CT dataset 2, while the PTV-SeB is shown in blue

EMBRACE II protocol suggests delivery of SIB to the involved nodes with the total dose to nodes being in the range of 55 Gy to 65 Gy EQD2. In our institution, we have also adopted the SIB-IMRT technique for node-positive cervical cancer patients and usually prescribe SIB to a dose of 55–57·5 Gy (EQD2 59 Gy). Nevertheless, the delivery of SIB to the involved lymph nodes, especially para-aortic nodes, should be cautiously dealt with considering the risk of bowel injury as the nodal shrinkage during treatment may cause unexpected movement of the bowel loop into the boost volume. This is especially important in patients with larger nodal size and burden as nodal regression during the course of treatment may lead to worse small bowel toxicity.
The current study has certain limitations including a smaller sample size and the second CT done after 4 weeks of commencement of radiotherapy. Moreover, the data on outcomes and toxicities of the patients treated with nodal boost with both the techniques have not been reported. Despite the above limitations, ours is the only dosimetric study that has studied the effect of anatomical change during radiotherapy due to weight loss and nodal shrinkage on the SIB-IMRT approach. Future prospective studies on the effect of SIB to the involved nodes, especially para-aortic on outcomes and toxicity, are warranted. Additionally, further studies on patient selection needing nodal boost after whole pelvis radiotherapy are required to achieve better regional control while reducing the risk of toxicity associated with nodal boost.
Conclusion
The study showed that SIB-IMRT resulted in better sparing of OARs, especially bowel in lymph node-positive cervical cancer. However, the magnitude of benefit was significantly reduced when an alteration in the anatomy of the involved node and the patient during the treatment was considered. Careful image guidance during SIB-IMRT treatment and planning adaptive radiotherapy whenever necessary may help reduce the unpredictable risk associated with overdosing of OARs adjacent to SIB volume and improve the toxicity profile in these patients.
Supplementary material
The supplementary material for this article can be found at https://doi.org/10.1017/S1460396923000365.
Data availability statement
Research data are stored in an institutional repository and will be shared upon request to the corresponding author.
Acknowledgements
None.
Financial support
None.
Competing interests
None (for all the authors).