Dyslipidaemia is a major risk factor for atherosclerotic CVD and one of the principal drivers of the continuing rise in global CVD burden(Reference Gisterå and Hansson1,Reference Ference, Ginsberg and Graham2) . Accumulating evidence indicates that dyslipidaemia is not merely a manifestation of metabolic dysregulation but is also closely linked to chronic low-grade inflammation and immune dysfunction(Reference Libby3,Reference Hansson, Libby and Tabas4) . The immune system is increasingly recognised as playing a central role in the initiation and progression of atherosclerosis, and T lymphocyte-mediated cellular immune responses are considered an important mechanism regulating inflammation within the arterial wall(Reference Monaco and Dib5). In particular, the CD4+:CD8+ T-cell ratio is widely used as an indicator of cellular immune homeostasis, and its aberrant variation has been associated with immune ageing and adverse outcomes in several chronic diseases(Reference McBride and Striker6). These observations suggest that immune-related outcomes may provide additional insight into the biological effects of dietary interventions in dyslipidaemia.
Phytosterols are a class of naturally occurring compounds found widely in plant-based foods. Their structural similarity to cholesterol enables them to reduce serum LDL-cholesterol levels by competitively inhibiting intestinal cholesterol absorption. A substantial body of randomised controlled trials and systematic reviews has demonstrated that increased phytosterol intake effectively improves lipid profiles, and several international guidelines and expert consensus statements have recommended phytosterols as an adjunct dietary strategy for LDL-cholesterol reduction(Reference Yang, Xia and Yu7–9). Beyond their established lipid-lowering effects, whether phytosterols influence immune function in humans remains unclear(Reference Zhang, Zhang and Wang10,Reference Salehi, Quispe and Sharifi-Rad11) . This question may be particularly relevant when phytosterols are consumed through naturally phytosterol-rich vegetable oils rather than purified supplements. Mechanistic studies suggest that phytosterols may affect immune regulation through changes in membrane lipid composition and related signalling pathways(Reference Salehi, Quispe and Sharifi-Rad11–Reference Wang, Liu and Du13). Some in vitro and animal studies have further indicated that phytosterols may influence T-cell activation and inflammatory cytokine expression(Reference Bouic14,Reference Bouic and Lamprecht15) .
Vegetable oils represent a major source of dietary fat intake among the Chinese population and are one of the principal dietary sources of phytosterols(Reference Yang, Xue and Zhang16). Since phytosterols occur naturally in vegetable oils and a variety of plant-based foods, their intake is largely determined by habitual dietary patterns(Reference Wang, Voortman and Bos17,Reference Chakraborty, Parashar and Jha18) . Compared with supplemental interventions, increasing phytosterol intake through habitual dietary sources may better reflect real-world exposure and may therefore be informative for nutritional research(Reference Racette, Lin and Ma19,Reference Eussen, de Jong and Rompelberg20) .
Wheat germ oil and corn germ oil contain relatively high amounts of phytosterols and differ in their phytosterol composition. Wheat germ oil contains high levels of β-sitosterol and campesterol, while corn germ oil is abundant in sitostanol and other sterol derivatives. A blend of these oils may provide a higher phytosterol content and a broader range of sterol species than commonly used cooking oils. By contrast, peanut oil, which is among the most widely used cooking oils in Chinese households, has far less phytosterol content. Replacing habitual cooking oil with a phytosterol-enriched corn–wheat germ blended oil (CWGO) represents a feasible dietary modification within usual meal patterns. This approach may increase phytosterol intake under conditions that are closer to usual dietary practice. In addition, using naturally occurring phytosterols from food sources may help evaluate their effects under habitual dietary conditions. These characteristics made CWGO a suitable vehicle for increasing dietary phytosterol intake in the parent trial. Therefore, the PHYTO-HEALTH trial was designed to investigate the effects of this phytosterol-enriched CWGO on metabolic outcomes in Chinese adults with dyslipidaemia(Reference Xia, Tian and He21). The present study is a secondary analysis of that trial, focusing specifically on immune markers and T-cell immune balance.
However, evidence from human randomised controlled trials on the immunological effects of dietary phytosterols remains limited, particularly in adults with dyslipidaemia. It is currently unclear whether phytosterol dietary intervention can alter immune status, and if so, whether such effects are expressed primarily at the level of systemic inflammation, humoral immunity or cellular immunity. Against this background, the present study conducted a secondary analysis of data from a randomised controlled trial carried out in Chinese adults with dyslipidaemia(Reference Xia, Tian and He21), with the aim of examining the immune-related effects of a phytosterol dietary intervention. We systematically assessed changes in systemic inflammatory markers, humoral immune indicators and peripheral blood lymphocyte subsets before and after a 12-week intervention with CWGO. The primary focus was on whether this intervention could influence T-cell subset balance and the CD4+:CD8+ ratio.
Materials and methods
Study design
This study is a secondary analysis of data from the PHYTO-HEALTH trial (ClinicalTrials.gov identifier: NCT06060509). The PHYTO-HEALTH trial was a randomised, outcome assessor-blinded, parallel-controlled dietary intervention study designed to compare the effects of a high-phytosterol (HPS) diet and a low-phytosterol (LPS) diet on serum lipid levels, fasting blood glucose and estimated 10-year CVD risk in Chinese adults with dyslipidaemia. In that trial, the HPS group used CWGO as the cooking oil, whereas the LPS group used peanut oil with a lower phytosterol content.
The trial was conducted in Nanjing, Jiangsu Province, China, with the dietary intervention implemented in the employee cafeteria of a local company. All meals were prepared according to predesigned standardised menus. The study comprised a 2-week run-in period followed by a 3-month intervention period. Eligible participants with dyslipidaemia were randomly assigned in a 1:1 ratio to the LPS diet group or the HPS diet group after completing the run-in period. Outcome measures were assessed at the end of the run-in period (baseline) and at the end of the intervention period (endpoint).
The PHYTO-HEALTH study protocol was approved by the Institutional Review Board of Zhongda Hospital affiliated with Southeast University (approval number: 2022ZDSYLL032-P01) and registered at ClinicalTrials.gov. All participants provided written informed consent prior to enrolment.
In this secondary analysis, we further examined immune-related indicators measured before and after the intervention in all randomised participants, including systemic inflammatory markers, humoral immune indicators and peripheral blood lymphocyte subsets, to assess the potential effects of an HPS dietary intervention on immune status.
Participants and recruitment
This secondary analysis included all randomised participants from the PHYTO-HEALTH trial. The original trial recruited male and female participants aged 18–65 years from a company in Nanjing, Jiangsu Province, China, who met the diagnostic criteria for dyslipidaemia according to the Chinese Guidelines for the Prevention and Treatment of Dyslipidaemia in Adults (2023 guideline) based on fasting venous blood lipid measurements obtained during screening before randomisation(Reference Li, Zhao and Zhao22). All participants were long-term residents with more than 3 years of residency and were full-time employees of the company. Pregnant or lactating women, individuals with special dietary requirements and those who travelled frequently for work were excluded. Detailed inclusion and exclusion criteria are provided in online Supplementary Table 1. All eligible participants underwent a 2-week run-in period before randomisation. Participants with acute infection, chronic inflammatory disease, autoimmune disease, malignancy or current use of immunosuppressive medication were excluded according to the trial eligibility criteria.
Sample size
This is an exploratory secondary analysis using data from all randomised participants in the PHYTO-HEALTH trial. The sample size calculation for the original randomised controlled trial was based on its primary metabolic outcomes and has been reported in detail in the original publication(Reference Xia, Tian and He21); therefore, analyses of immune outcomes should be considered hypothesis-generating and interpreted with caution.
Run-in and baseline examinations
During the 2-week run-in period, a registered dietitian assessed participants’ habitual dietary preferences and worked with the cafeteria chefs to develop and refine the weekly menus. All participants consumed a standardised LPS diet during this phase, which was developed to reflect the local habitual dietary pattern.
At the end of the run-in period, baseline data were collected through structured questionnaire-based interviews, covering general demographic characteristics, lifestyle behaviours and medical and medication histories. Participants also underwent physical examinations, including measurements of height, weight, blood pressure, waist circumference and hip circumference.
Fasting venous blood samples were collected at baseline. All samples were transported under refrigerated conditions to the laboratory of Zhongda Hospital affiliated with Southeast University on the day of collection for analysis, and remaining serum samples were stored at –80°C.
Randomisation and blinding
In the original PHYTO-HEALTH randomised controlled trial, eligible participants were randomly assigned in a 1:1 ratio to the HPS diet group or the LPS diet group. The randomisation sequence was generated by a statistician who was not involved in data collection or analysis. Given the nature of the dietary intervention, blinding of participants was not feasible. However, personnel responsible for outcome assessment, data entry and statistical analysis were maintained blinded throughout the study. Full details of the randomisation and blinding procedures are provided in the original publication(Reference Xia, Tian and He21).
Intervention programmes
Following the 2-week run-in period, participants received either the HPS diet or the LPS diet according to their group assignment. Both groups consumed meals prepared according to identical menus, with the sole difference being the type of cooking oil used. The HPS group used CWGO, whereas the LPS group used peanut oil with a lower phytosterol content. All participants ate in the designated company cafeteria throughout the study period, with breakfast, lunch and dinner provided daily for 3 months. Lunch was consumed in a central company cafeteria under direct supervision of the research staff, and leftover food was weighed after each meal to estimate actual intake and assess adherence. During the intervention, standardised snacks, including yogurt, apples, bananas and pears, were provided, with each participant allowed one portion per day to minimise differences in non-study food consumption. The two diets were designed to be comparable in total energy and macronutrient composition, with the principal planned difference being the type of cooking oil and, consequently, phytosterol intake. Further details of the dietary intervention, including representative menus, the phytosterol content of the intervention oils and the compositional differences between peanut oil and CWGO, are provided in online Supplementary Table 2 and Table 3.
Outcomes
The primary outcomes of this secondary analysis were changes in peripheral blood T lymphocyte subset indicators from baseline to the end of intervention, including the absolute counts of CD3+, CD4+ and CD8+ T cells and the CD4+:CD8+ ratio. These indicators were used to evaluate the potential effects of the phytosterol-enriched cooking oil intervention on cellular immune status and T-cell subset balance.
Secondary outcomes included changes in systemic inflammatory markers, humoral immune indicators and other peripheral blood lymphocyte subset parameters. Systemic inflammatory markers comprised C-reactive protein (CRP), TNF-α and interferon-α (IFN-α). Humoral immune indicators included IgG, IgA, IgM, IgE and complement C3. Other lymphocyte subset parameters included the absolute counts and percentages of CD19+ B cells and CD16+CD56+ natural killer (NK) cells. All outcomes were assessed at baseline and at the end of the 12-week intervention, with changes from baseline and between-group differences serving as the primary analytic metrics.
Diet and nutrition data collection
Dietary intake was assessed at the baseline and at the end of the intervention. Baseline dietary phytosterol intake was estimated using the baseline FFQ and was presented separately to assess group comparability before the intervention. Because no end-of-intervention FFQ was collected in the parent trial, total dietary phytosterol intake during the intervention period could not be precisely estimated. Three-day 24-h dietary recalls were conducted at the end of the run-in period (baseline) and at the end of the 12-week intervention to estimate changes in energy and nutrient intake. Participants were instructed to report all foods and beverages consumed, including meals, snacks and other foods consumed outside the study meals provided. Detailed procedures for dietary recording, food weighing and nutrient intake calculation are described in the original publication(Reference Xia, Tian and He21). The centralised lunch service, meal supervision, leftover weighing and provision of standardised snacks helped reduce variation in non-study food consumption during the intervention.
Statistical analysis
Baseline demographic and clinical characteristics were summarised using descriptive statistics. Continuous variables are presented as mean and standard deviation or median and interquartile range according to their distribution, with normality assessed using the Shapiro–Wilk test. Categorical variables are expressed as counts and percentages. Between-group comparisons of baseline characteristics were performed using the independent-samples t test for normally distributed variables, the Mann–Whitney U test for non-normally distributed variables and the χ 2 test or Fisher’s exact test for categorical variables.
Generalised estimating equations (GEE) were used to assess changes in outcome measures over time and between-group differences. The models included group (HPS v. LPS), time (baseline v. end of 12-week intervention) and the group × time interaction as independent variables, with adjustment for age, sex, baseline value of the corresponding outcome, BMI and hypertension status. Covariates were selected a priori based on their established associations with immune function and cardiometabolic status, rather than solely on baseline statistical imbalance. Age and sex are major determinants of lymphocyte subset distributions, whereas BMI and hypertension reflect baseline metabolic status; the baseline value of each outcome was included to improve precision. Given the modest sample size, the primary model was kept parsimonious to avoid overfitting. An exchangeable working correlation structure was specified, and robust standard errors were estimated using a sandwich covariance matrix.
The group × time interaction term was used to assess whether the two groups differed in their trajectories of change over the intervention period. When the interaction effect was statistically significant, post hoc pairwise comparisons were conducted to estimate between-group differences at the end of the intervention. Effect sizes are reported as adjusted mean differences with 95 % CI.
All statistical tests were two-sided. Given the exploratory nature of this secondary analysis and the large number of immune-related endpoints, no formal correction for multiple comparisons was performed. To reduce type I error, results were considered robust only when consistent between intention-to-treat and per-protocol (PP) analyses; all other nominally significant (P < 0·05) findings were interpreted as hypothesis-generating. A PP analysis was conducted as a sensitivity analysis to assess the robustness of the findings. Missing outcome data were handled within the GEE framework using all available repeated measurements under the missing-at-random assumption, and no single imputation was performed. All statistical analyses were performed using SPSS version 27.0. The PP population included participants who completed the 12-week intervention, provided endpoint immune measurements and had no major protocol deviations, such as poor adherence to the prescribed meals, missing key dietary records, use of non-study cooking oils or incomplete outcome data. Participants were excluded from the PP analysis if they did not consume cafeteria lunch for more than 1 consecutive week or used non-study lipid-related nutritional supplements during the intervention. A two-tailed P < 0·05 was considered statistically significant.
Results
Participant flow and baseline characteristics
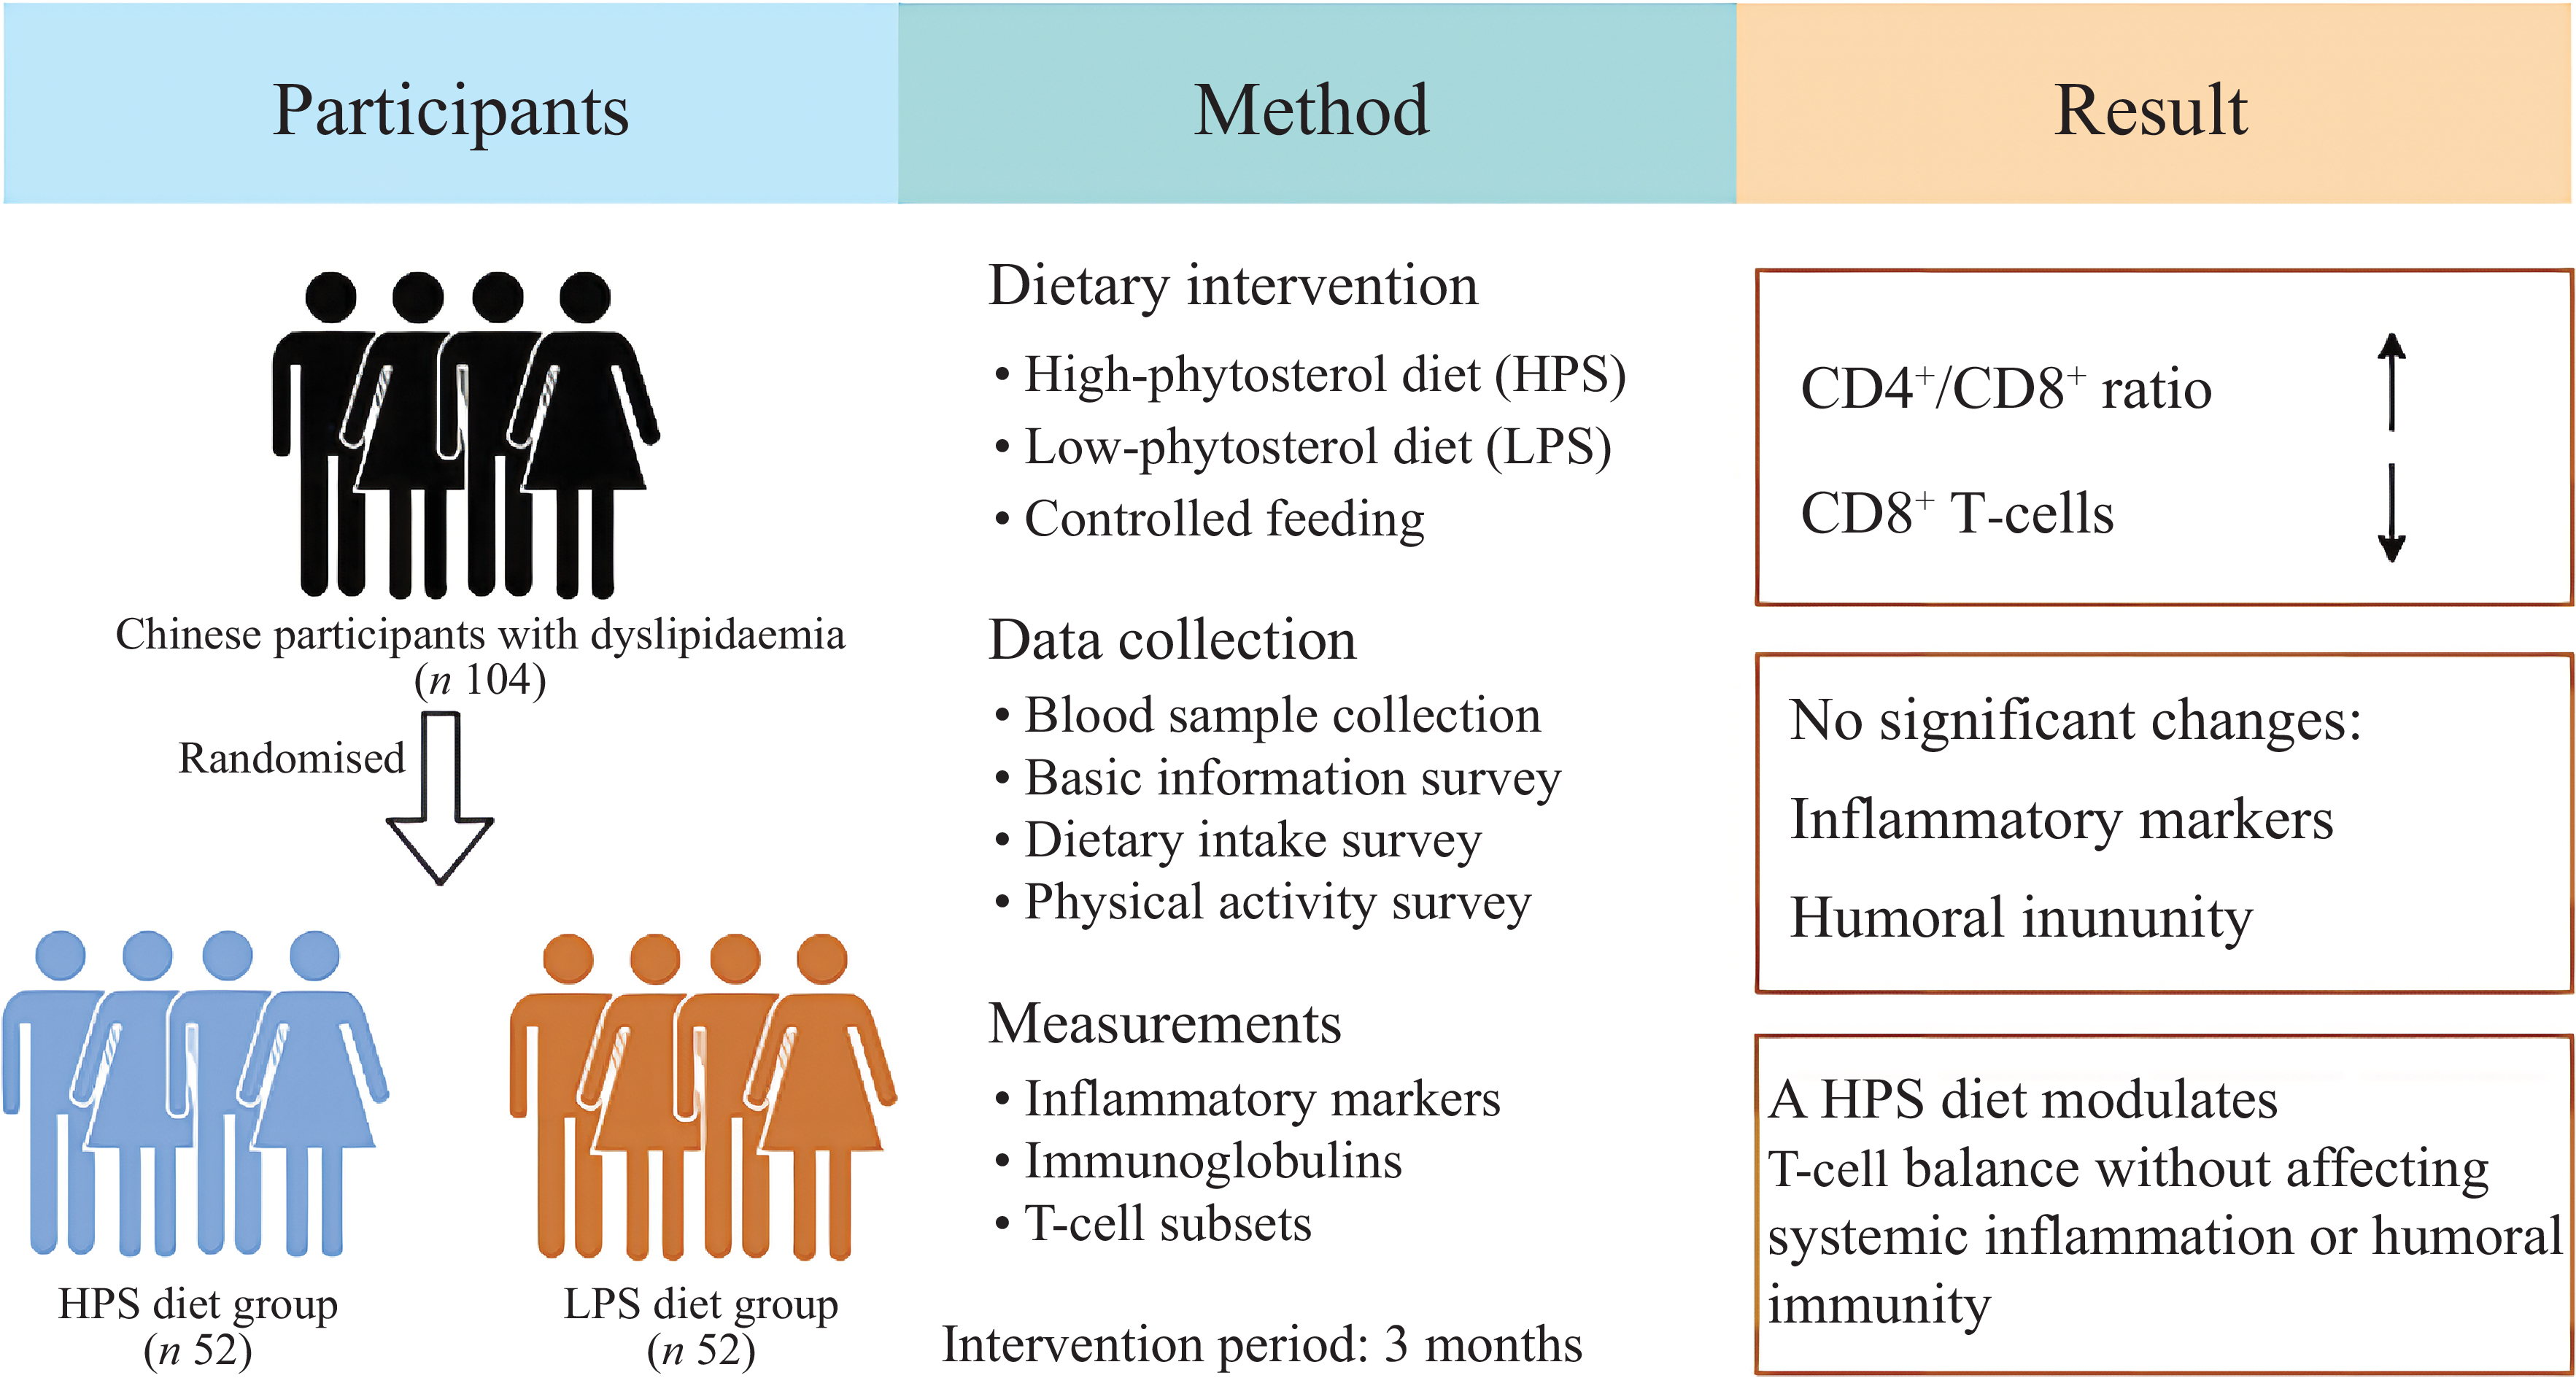
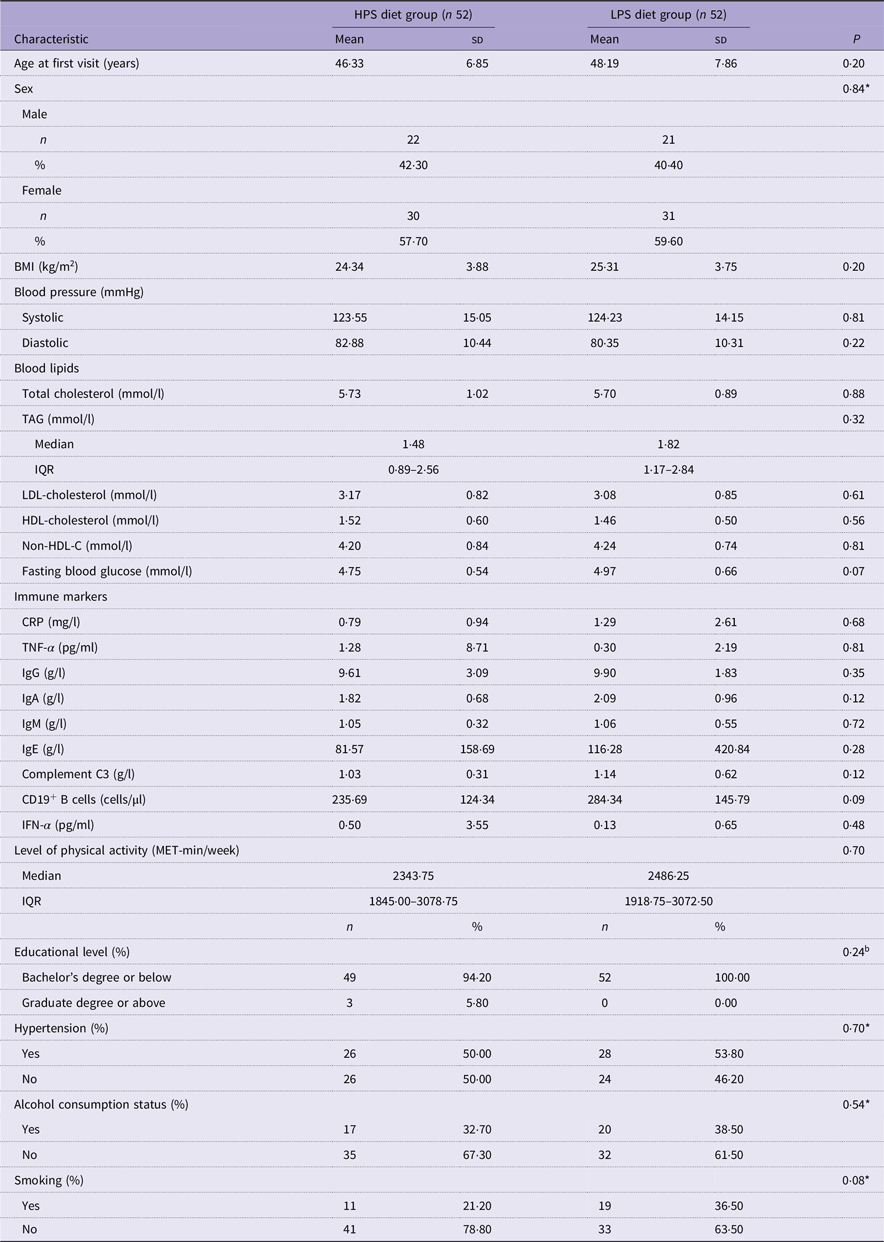
An overview of the randomised controlled trial is shown in Figure 1. A total of 104 participants with dyslipidaemia were randomised to either the HPS diet group (n 52) or the LPS diet group (n 52). During the intervention, five participants discontinued the study. Overall, ninety-nine participants (95 %) completed the outcome assessments at 3 months. Among the five participants who discontinued the intervention, two were from the HPS group and three from the LPS group. Reasons for discontinuation included illness (n 2), lack of time or motivation (n 1) and unknown reasons (n 2). Baseline characteristics were similar between completers and non-completers. Among the ninety-nine participants who completed the 3-month assessment, four were excluded from the PP analysis because of prolonged absence from the cafeteria lunch service (n 3) and use of lipid-lowering nutritional supplements during the trial (n 1). All randomised participants were included in the intention-to-treat analysis, while ninety-five participants were included in the PP analysis. Baseline inflammatory markers, humoral immune indicators and selected peripheral blood lymphocyte subsets were generally comparable between the two groups, as shown in Table 1. Data for the PP population are presented in online Supplementary Table 4. Missing endpoint data from the five participants who discontinued the trial were handled according to the prespecified statistical approach described above.
Overview of the randomised controlled trial and main findings. LPS diet group, low-phytosterol diet using peanut oil; HPS diet group, high-phytosterol diet using phytosterol-enriched corn–wheat germ blended oil.

Baseline characteristics of study participants

Table 1. Long description
A table comparing baseline characteristics of study participants in two diet groups, HPS diet group and LPS diet group, each with 52 participants. The table has 27 rows and 6 columns. Column headers are Characteristic, HPS diet group (n 52) Mean, HPS diet group (n 52) sd, LPS diet group (n 52) Mean, LPS diet group (n 52) sd, and P. Row labels include Age at first visit (years), Sex (Male and Female), BMI (kg/m^2), Blood pressure (Systolic and Diastolic), Blood lipids (Total cholesterol, TAG, LDL-cholesterol, HDL-cholesterol, Non-HDL-cholesterol), Fasting blood glucose (mmol/l), Immune markers (CRP, TNF-alpha, IgG, IgA, IgM, IgE, Complement C3, CD19 B cells, IFN-alpha), Level of physical activity (MET-min/week), Educational level (Bachelorʼs degree or below, Graduate degree or above), Hypertension, Alcohol consumption status, and Smoking. Each row provides mean and standard deviation values for each diet group and a P value for comparison. Notable trends include similar baseline characteristics between the two groups, with P values indicating no significant differences in most characteristics.
HPS diet group, high-phytosterol diet using phytosterol-enriched corn–wheat germ blended oil; LPS diet group, low-phytosterol diet using peanut oil; CRP, C-reactive protein; IFN-α, interferon-α; MET, metabolic equivalent of task; IQR, interquartile range.
*Pearson’s χ 2 test; continuity-corrected Pearson’s χ 2 test.
Dietary intake and physical activity
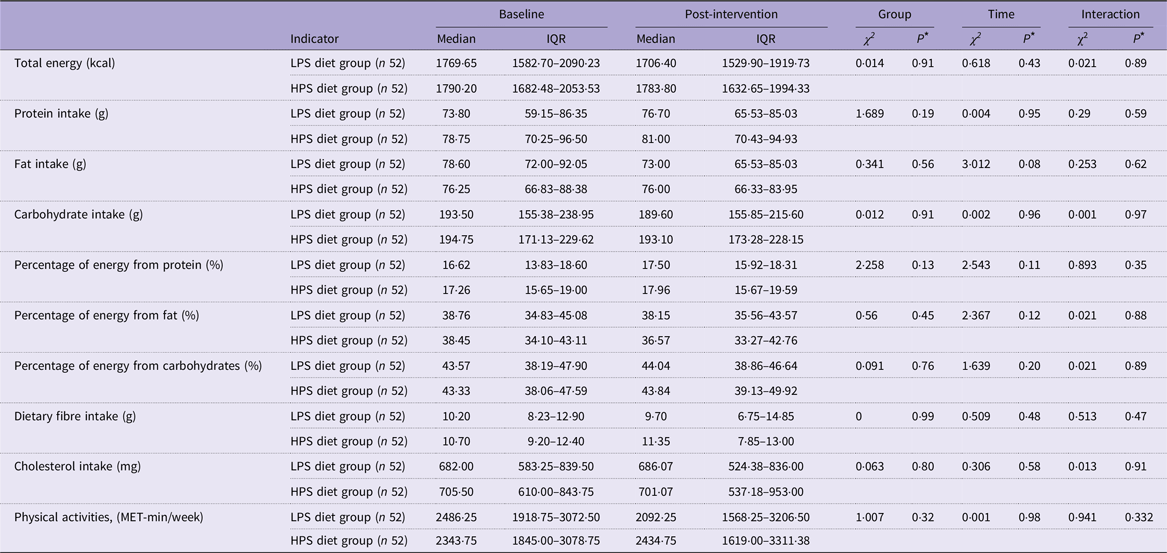
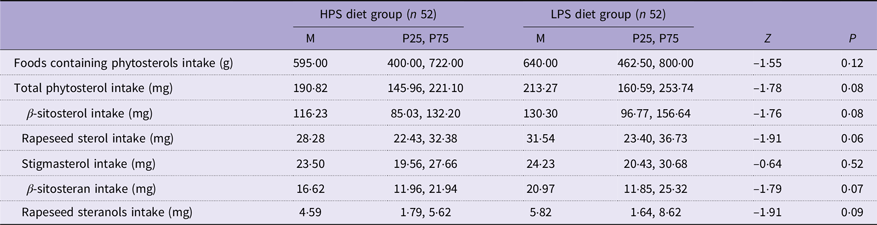
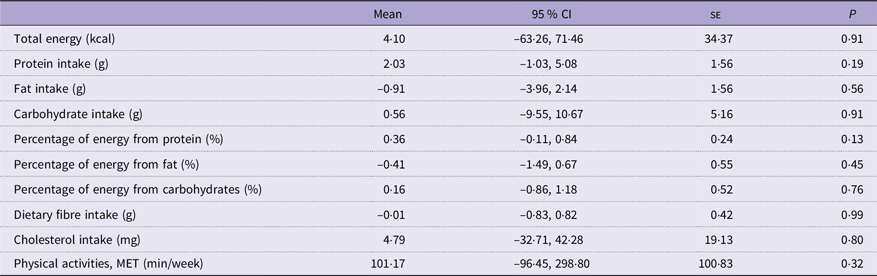
No significant group × time interactions were observed for dietary intake or physical activity variables after adjustment for age, sex, BMI, baseline values and hypertension status (all P > 0·05; Table 2). Baseline dietary phytosterol intake was comparable between the two groups (Table 3), whereas the phytosterol content of the intervention oils differed substantially, indicating that the main exposure contrast arose from the assigned cooking oil rather than pre-existing dietary differences. Similarly, post hoc analyses showed no significant between-group differences in changes in total energy intake, macronutrient intake, dietary fibre, cholesterol intake or physical activity at 12 weeks (all P > 0·05; Table 4).
Analysis of dietary intake and physical activity during 3-month intervention based on GEE

Table 2. Long description
A table comparing dietary intake and physical activity during a 3-month intervention. The table has 12 rows and 10 columns. The columns are labeled Indicator, Baseline Median, Baseline IQR, Post-intervention Median, Post-intervention IQR, Group χ², Group P*, Time χ², Time P*, Interaction χ², and Interaction P*. The rows are labeled with different dietary and physical activity indicators such as Total energy (kcal), Protein intake (g), Fat intake (g), Carbohydrate intake (g), Percentage of energy from protein (%), Percentage of energy from fat (%), Percentage of energy from carbohydrates (%), Dietary fibre intake (g), Cholesterol intake (mg), and Physical activities (MET-min/week). Each row provides data for two diet groups: LPS diet group and HPS diet group, with 52 participants each. The table shows median and interquartile range (IQR) values for baseline and post-intervention periods, along with statistical analysis results for group, time, and interaction effects.
GEE, generalised estimating equations; IQR, interquartile range; LPS diet group, low-phytosterol diet using peanut oil; HPS diet group, high-phytosterol diet using phytosterol-enriched corn–wheat germ blended oil; MET, metabolic equivalent of task.
* GEE were used to analyse the data, with adjustment for age, sex, BMI and blood pressure status.
Baseline dietary phytosterol intake by intervention group in the ITT population

Table 3. Long description
A table comparing dietary phytosterol intake between two diet groups, HPS diet group and LPS diet group, each with 52 participants. The table has 8 rows and 10 columns. The columns are labeled as follows: Foods containing phytosterols intake (g), Total phytosterol intake (mg), β-sitosterol intake (mg), Rapeseed sterol intake (mg), Stigmasterol intake (mg), β-sitosteran intake (mg), and Rapeseed steranols intake (mg). Each of these columns has three sub-columns: M, P25, P75 for both HPS diet group and LPS diet group. The last two columns are labeled Z and P. Row 1: Foods containing phytosterols intake (g), HPS diet group (M: 595.00, P25: 400.00, P75: 722.00), LPS diet group (M: 640.00, P25: 462.50, P75: 800.00), Z: -1.55, P: 0.12. Row 2: Total phytosterol intake (mg), HPS diet group (M: 190.82, P25: 145.96, P75: 221.10), LPS diet group (M: 213.27, P25: 160.59, P75: 253.74), Z: -1.78, P: 0.08. Row 3: β-sitosterol intake (mg), HPS diet group (M: 116.23, P25: 85.03, P75: 132.20), LPS diet group (M: 130.30, P25: 96.77, P75: 156.64), Z: -1.76, P: 0.08. Row 4: Rapeseed sterol intake (mg), HPS diet group (M: 28.28, P25: 22.43, P75: 32.38), LPS diet group (M: 31.54, P25: 23.40, P75: 36.73), Z: -1.91, P: 0.06. Row 5: Stigmasterol intake (mg), HPS diet group (M: 23.50, P25: 19.56, P75: 27.66), LPS diet group (M: 24.23, P25: 20.43, P75: 30.68), Z: -0.64, P: 0.52. Row 6: β-sitosteran intake (mg), HPS diet group (M: 16.62, P25: 11.96, P75: 21.94), LPS diet group (M: 20.97, P25: 11.85, P75: 25.32), Z: -1.79, P: 0.07. Row 7: Rapeseed steranols intake (mg), HPS diet group (M: 4.59, P25: 1.79, P75: 5.62), LPS diet group (M: 5.82, P25: 1.64, P75: 8.62), Z: -1.91, P: 0.09.
ITT, intention-to-treat; HPS diet group, high-phytosterol diet using phytosterol-enriched corn–wheat germ blended oil; LPS diet group, low-phytosterol diet using peanut oil.
The data were derived from participants’ baseline self-reported FFQ. Data are presented as M (P25, P75), and statistical analyses between groups were performed using the Mann–Whitney U test.
Post hoc analysis of dietary intake and physical activity during 3-month intervention based on GEE

Table 4. Long description
A table showing dietary intake and physical activity during a 3-month intervention. The table has 11 rows and 5 columns. The columns are labeled Mean, 95 percent CI, SE, and P. The rows are labeled with different variables: Total energy (kcal), Protein intake (g), Fat intake (g), Carbohydrate intake (g), Percentage of energy from protein (percent), Percentage of energy from fat (percent), Percentage of energy from carbohydrates (percent), Dietary fibre intake (g), Cholesterol intake (mg), and Physical activities, MET (min/week). Each row contains values for Mean, 95 percent CI, SE, and P. For example, the first row shows Total energy (kcal) with Mean: 4.10, 95 percent CI: -63.26, 71.46, SE: 34.37, and P: 0.91. The table provides a detailed comparison of these variables during the intervention period.
GEE, generalised estimating equations; MET, metabolic equivalent of task; LPS diet group, low-phytosterol diet using peanut oil.
The mean differences between groups before and after the intervention were used using GEE, with the LPS diet group as the reference. Changes were reported as mean (95 % CI) and adjusted for age, sex, baseline values, BMI and hypertension status.
Systemic inflammatory and humoral immune markers
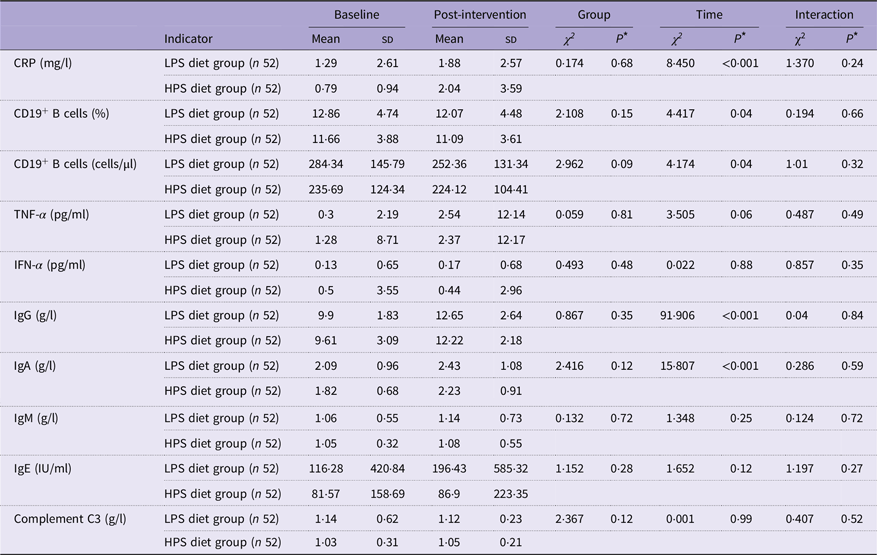
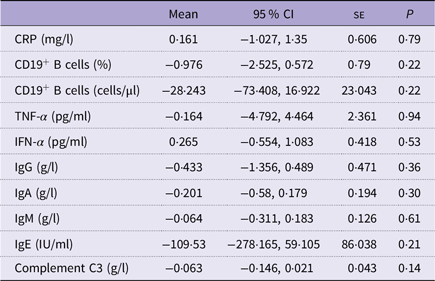
The HPS diet had no significant differential effect on any systemic inflammatory marker or humoral immune indicator compared with the LPS diet. After adjustment for age, sex, baseline values, BMI and hypertension status, the group × time interaction effects for CRP, TNF-α, IFN-α, IgG, IgA, IgM, IgE, complement C3 and CD19+ B cells were all non-significant (all P > 0·05), and post hoc analyses confirmed no significant between-group differences for any of these indicators after 3 months of intervention (all P > 0·05). CRP, IgG and IgA showed significant time main effects (all P ≤ 0·05), with levels increasing over time in both groups. Complete GEE and post hoc results are presented in Tables 5 and 6.
Analysis of systemic inflammatory markers and humoral immune indicators during 3-month intervention based on GEE

Table 5. Long description
The table presents data on systemic inflammatory markers and humoral immune indicators for two diet groups, LPS diet group and HPS diet group, each with 52 participants. The table is divided into several rows and columns, with indicators listed in the first column, followed by baseline and post-intervention mean and standard deviation (SD) values for each diet group. The columns are labeled as Indicator, Baseline (Mean, SD), Post-intervention (Mean, SD), Group, Time, and Interaction. Each row provides specific data for indicators such as CRP (mg/l), CD19 B cells (%), TNF-α (pg/ml), IFN-α (pg/ml), IgG (g/l), IgA (g/l), IgM (g/l), IgE (IU/ml), and Complement C3 (g/l). The table includes statistical values for Group, Time, and Interaction effects, with chi-square (χ²) and P-values provided for each indicator. Notable trends include significant time main effects for CRP, IgG, and IgA, with levels increasing over time in both groups. The table provides a comprehensive comparison of the effects of the two diets on various inflammatory and immune indicators over the intervention period.
GEE, generalised estimating equations; CRP, C-reactive protein; LPS diet group, low-phytosterol diet using peanut oil; HPS diet group, high-phytosterol diet using phytosterol-enriched corn–wheat germ blended oil; IFN-α, interferon-α.
* GEE were used to analyse the data, with adjustment for age, sex, BMI and blood pressure status.
Post hoc analysis of systemic inflammatory markers and humoral immune indicators during 3-month intervention based on GEE

Table 6. Long description
A table comparing systemic inflammatory markers and humoral immune indicators during a 3-month intervention. The table has 10 rows and 5 columns. The columns are labeled Mean, 95 percent CI, SE, and P. The rows are labeled with different markers and indicators: CRP (mg per l), CD19 B cells (percent), CD19 B cells (cells per microliter), TNF-alpha (pg per ml), IFN-alpha (pg per ml), IgG (g per l), IgA (g per l), IgM (g per l), IgE (IU per ml), and Complement C3 (g per l). Each row provides the mean value, 95 percent confidence interval, standard error, and P-value for the respective marker or indicator. Notable trends include non-significant P-values for all markers and indicators, indicating no significant between-group differences after 3 months of intervention. CRP, IgG, and IgA showed significant time main effects, with levels increasing over time in both groups.
GEE, generalised estimating equations; CRP, C-reactive protein; IFN-α, interferon-α; LPS diet group, low-phytosterol diet using peanut oil.
The mean differences between groups before and after the intervention were used using GEE, with the LPS diet group as the reference. Changes were reported as mean (95 % CI) and adjusted for age, sex, baseline values, BMI and hypertension status.
Peripheral blood T-cell subsets and natural killer cells
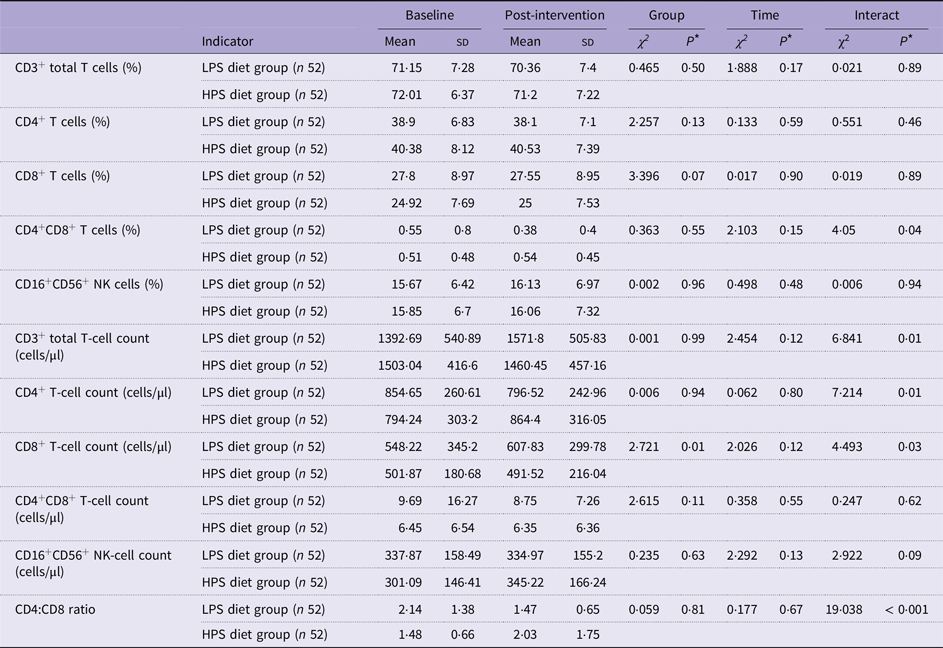
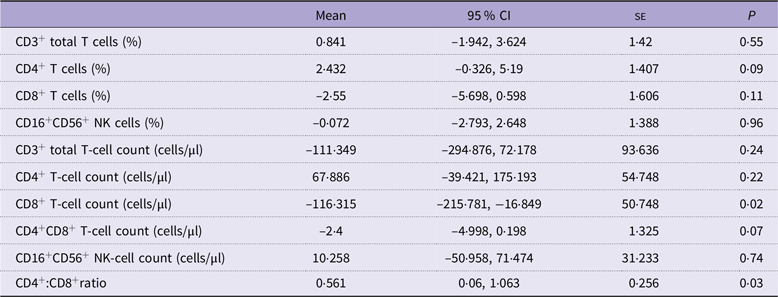
A significant group × time interaction was observed for the CD4+:CD8+ ratio after covariate adjustment (P < 0·001). The ratio decreased in the LPS group and increased in the HPS group over the intervention period. In post hoc analyses, the HPS group had a higher CD4+:CD8+ ratio than the LPS group at 12 weeks (adjusted mean difference: 0·561; 95 % CI 0·060, 1·063; P = 0·029).
Significant group × time interactions were also observed for absolute CD3+ T-cell count (P = 0·009), CD4+ T-cell count (P = 0·007) and CD8+ T-cell count (P = 0·034). In post hoc analyses, CD8+ T-cell count was lower in the HPS group than in the LPS group at 12 weeks (adjusted mean difference: –116·315 cells/μl; 95 % CI –215·781, –16·849; P = 0·023), whereas the between-group difference in CD4+ T-cell count was not statistically significant (adjusted mean difference: 67·886 cells/μl; 95 % CI –39·421, 175·193; P = 0·216).
No significant group × time interactions were observed for the percentages of CD3+, CD4+ or CD8+ T cells, or for NK-cell count or percentage, and post hoc analyses showed no significant between-group differences in these outcomes (all P > 0·05). Complete GEE and post hoc results are presented in Tables 7 and 8.
Analysis of peripheral blood lymphocyte subsets during 3-month intervention based on GEE

Table 7. Long description
The table presents data on the analysis of peripheral blood lymphocyte subsets during a 3-month intervention. It includes baseline and post-intervention measurements for two diet groups, LPS diet group and HPS diet group, each with 52 participants. The table has 11 rows and 10 columns. The columns are labeled Indicator, Baseline Mean, Baseline SD, Post-intervention Mean, Post-intervention SD, Group χ2, Group P, Time χ2, Time P, Interact χ2, and Interact P. The rows are labeled with different lymphocyte subsets: CD3 total T cells (%), CD4 T cells (%), CD8 T cells (%), CD4 CD8 T cells (%), CD16 CD56 NK cells (%), CD3 total T-cell count (cells/μl), CD4 T-cell count (cells/μl), CD8 T-cell count (cells/μl), CD4 CD8 T-cell count (cells/μl), CD16 CD56 NK-cell count (cells/μl), and CD4:CD8 ratio. Each row provides the mean and standard deviation (SD) for both baseline and post-intervention periods for the two diet groups, along with chi-square (χ2) and P-values for group, time, and interaction effects. Notable trends include variations in the mean values and SDs across different lymphocyte subsets and diet groups, with specific P-values indicating the significance of group, time, and interaction effects.
GEE, generalized estimating equations; LPS diet group, low-phytosterol diet using peanut oil; HPS diet group, high-phytosterol diet using phytosterol-enriched corn–wheat germ blended oil; NK, natural killer.
* GEE were used to analyse the data, with adjustment for age, sex, BMI and blood pressure status.
Post hoc analysis of peripheral blood lymphocyte subsets during 3-month intervention based on GEE

Table 8. Long description
A table comparing lymphocyte subsets during a 3-month intervention. The table has 10 rows and 5 columns. The columns are labeled Mean, 95% CI, SE, and P. The rows are labeled with different lymphocyte subsets: CD3 total T cells (percent), CD4 T cells (percent), CD8 T cells (percent), CD16 CD56 NK cells (percent), CD3 total T-cell count (cells/ul), CD4 T-cell count (cells/ul), CD8 T-cell count (cells/ul), CD4 CD8 T-cell count (cells/ul), CD16 CD56 NK-cell count (cells/ul), and CD4+CD8+ ratio. Each row contains values for Mean, 95% CI, SE, and P. Row 1: CD3 total T cells (percent), Mean: 0.841, 95% CI: -1.942, 3.624, SE: 1.42, P: 0.55. Row 2: CD4 T cells (percent), Mean: 2.432, 95% CI: -0.326, 5.19, SE: 1.407, P: 0.09. Row 3: CD8 T cells (percent), Mean: -2.55, 95% CI: -5.698, 0.598, SE: 1.606, P: 0.11. Row 4: CD16 CD56 NK cells (percent), Mean: -0.072, 95% CI: -2.793, 2.648, SE: 1.388, P: 0.96. Row 5: CD3 total T-cell count (cells/ul), Mean: 111.349, 95% CI: -294.876, 72.178, SE: 93.636, P: 0.24. Row 6: CD4 T-cell count (cells/ul), Mean: 67.886, 95% CI: -39.421, 175.193, SE: 54.748, P: 0.22. Row 7: CD8 T-cell count (cells/ul), Mean: -116.315, 95% CI: -215.781, -16.849, SE: 50.748, P: 0.02. Row 8: CD4 CD8 T-cell count (cells/ul), Mean: -2.4, 95% CI: -4.998, 0.198, SE: 1.325, P: 0.07. Row 9: CD16 CD56 NK-cell count (cells/ul), Mean: 10.258, 95% CI: -50.958, 71.474, SE: 31.233, P: 0.74. Row 10: CD4+CD8+ ratio, Mean: 0.561, 95% CI: 0.06, 1.063, SE: 0.256, P: 0.03.
GEE, generalized estimating equations; NK, natural killer; LPS diet group, low-phytosterol diet using peanut oil.
The mean differences between groups before and after the intervention were estimated using GEE, with the LPS diet group as the reference. Changes were reported as mean (95 % CI) and adjusted for age, sex, baseline values, BMI and hypertension status.
Sensitivity analyses
Sensitivity analyses in the PP population showed that the main finding for the CD4+:CD8+ ratio remained directionally consistent and statistically significant, indicating that the overall tendency towards a higher T-cell subset balance in the HPS group was robust. The CD4+ T-cell count also remained significant in the PP analysis, whereas the effects on CD3+ and CD8+ T-cell counts were attenuated and no longer statistically significant. In contrast, no significant between-group differences were observed for systemic inflammatory markers, humoral immune indicators or NK-cell outcomes in the PP analysis, consistent with the intention-to-treat results. Detailed PP estimates are provided in online Supplementary Table 6, Table 8 and Table 10.
Safety outcome
No participants withdrew from the study due to adverse events during the trial. Although occasional mild adverse events were reported, including constipation, food allergy, food aversion or intolerance, and gastroenteritis, none were considered related to the intervention. No significant difference in the incidence of adverse events was observed between the LPS and HPS diet groups. Detailed safety data are presented in online Supplementary Table 11.
Discussion
Given the well-recognised association between dyslipidaemia and immune–inflammatory dysregulation(Reference Lacy, Atzler and Liu23), and the limited human evidence on the potential immunomodulatory effects of phytosterols(Reference Van Brakel, Mensink and Lütjohann24,Reference van Brakel, Brüll and Lasfar25) , the present study conducted a secondary analysis of data from a randomised controlled dietary intervention trial to examine the immune-related effects of an HPS diet in adults with dyslipidaemia. Compared with a low-phytosterol diet, a 12-week intervention using phytosterol-enriched CWGO as the daily cooking oil did not produce broad changes in systemic inflammatory markers or humoral immune indicators. However, it was associated with changes in selected T-cell-related parameters, suggesting a possible selective influence on T-cell immune balance. Sensitivity analyses indicated that the intervention effects on CD4+ T-cell count and the CD4+:CD8+ ratio were relatively robust, whereas the findings for total CD3+ T-cell count and CD8+ T-cell count were attenuated in the PP analysis and should therefore be interpreted with caution. Given the large number of immune outcomes examined without adjustment for multiple comparisons, the positive findings should be considered exploratory and require confirmation in future studies specifically designed for immune endpoints. Overall, these findings suggest a possible selective influence of the intervention on T-cell homeostasis, although the results should be interpreted cautiously.
The observation that the CD4+:CD8+ ratio differed between groups, whereas the individual CD4+ and CD8+ T-cell measures did not consistently reach statistical significance, requires cautious interpretation. The CD4+:CD8+ ratio may reflect relative T-cell subset balance even when individual component counts do not show consistent significant differences. In the present study, the higher CD4+:CD8+ ratio appeared to reflect a relative shift in T-cell subset balance rather than a broad or uniform change in absolute T-cell counts. Therefore, this finding should be interpreted as an integrated marker of T-cell homeostasis, not as definitive evidence of a strong independent effect on CD4+ or CD8+ T cells alone.
In the present study, the CD4+:CD8+ ratio was higher in the HPS group, and the CD4+:CD8+ ratio showed the most consistent findings across analyses, suggesting that the intervention may influence T-cell subset balance. The CD4+:CD8+ ratio is widely regarded as an important indicator of T-cell immune homeostasis, and a low or inverted ratio has been associated with immune ageing, chronic inflammation and certain adverse health outcomes(Reference McBride and Striker6,Reference Garrido-Rodríguez, Herrero-Fernández and Castro26) . These findings suggest that the phytosterol-enriched oil intervention may be associated with changes in T-cell homeostasis rather than broad stimulation or suppression of immune function. Prior evidence on the immunological effects of phytosterols has been derived largely from in vitro and animal studies, which suggest that phytosterols may influence T-cell activation, T helper cell responses and the expression of related inflammatory mediators(Reference Calpe-Berdiel, Escolà-Gil and Benítez27,Reference Brüll, Mensink and van den Hurk28) . Human evidence, however, is inconsistent. Some intervention studies found no appreciable effect of plant stanol supplementation on ex vivo T-cell-derived cytokine production in healthy volunteers(Reference van Brakel, Brüll and Lasfar25), whereas others reported that plant stanols may enhance antibody responses under specific immune stimulation conditions(Reference Van Brakel, Mensink and Lütjohann24,Reference Brüll, De Smet and Mensink29) . The T-cell-related changes observed in the present study in adults with dyslipidaemia, a population with an underlying metabolic risk profile, suggest that the immunological effects of phytosterols in humans may be expressed preferentially as selective modulation of cellular immune balance, rather than as broad and pronounced effects on the immune system as a whole.
It is noteworthy that the HPS diet did not produce significant intervention effects on systemic inflammatory markers such as CRP, TNF-α or IFN-α, nor on humoral immune indicators including IgG, IgA, IgM, IgE or complement C3. This is broadly consistent with the conclusions of several prior systematic reviews and randomised controlled studies(Reference Rocha, Ras and Gagliardi30,Reference Aslani, Eslami and Fakourizad31) . Several factors may account for these null findings. First, these markers reflect overall systemic inflammatory or humoral immune status, and their variation is typically influenced by a wide range of metabolic, lifestyle and individual factors(Reference Koelman, Egea Rodrigues and Aleksandrova32). The effects of short-term dietary intervention on such indicators are therefore likely to be modest. In addition, the study participants had dyslipidaemia but not overt inflammatory disease, and their baseline inflammatory levels were generally low, which may have further limited the capacity for additional change in these markers. Furthermore, although the HPS diet in the present study increased phytosterol intake, the overall exposure level remained closer to habitual dietary intake than to the supplemental doses commonly used in lipid-lowering intervention trials(Reference Yang, Xue and Zhang16,33) . Under this relatively moderate dietary exposure, phytosterols may be insufficient to produce detectable changes in systemic inflammation or humoral immunity, while still being capable of exerting effects on the more responsive T-cell subset compartment.
This pattern of selective effects has a degree of mechanistic plausibility. Phytosterols can partially substitute for cholesterol in cell membranes, thereby altering the membrane lipid environment(Reference Zio, Tarnagda and Tapsoba34,Reference Róg and Vattulainen35) . T-cell activation, proliferation and signal transduction are highly dependent on the lipid microdomain structure of the plasma membrane(Reference Jury, Flores-Borja and Kabouridis36). Phytosterols may therefore preferentially influence T-cell-related signalling processes without necessarily producing concurrent changes in more macroscopic immune readouts such as CRP or Ig. CRP primarily reflects hepatic acute-phase responses, while Ig and complement represent the status of the humoral immune system(Reference Sproston and Ashworth37), markers that typically require broader or more intense inflammatory stimulation to change appreciably. On this basis, the present findings are more consistent with the view that phytosterols, under real-world dietary conditions, may exert mild and selective modulatory effects at the level of immune cells, particularly T-cell subset balance, rather than triggering broad systemic immune responses.
The sensitivity analyses help qualify the interpretation of the primary findings. The PP analysis showed that the intervention effects on CD4+ T-cell count and the CD4+:CD8+ ratio retained statistical significance, whereas the interaction effects for total CD3+ T-cell count and CD8+ T-cell count were no longer significant. This indicates that the influence of an HPS diet on T-cell immune balance has a degree of robustness, but not all T-cell-related findings are equally stable. The observed discrepancy may partly reflect reduced statistical power in the PP analysis due to the smaller sample size or may indicate that certain indicators are more sensitive to adherence levels or the definition of the analysis set. Accordingly, the findings for CD3+ and CD8+ T cells are best regarded as exploratory or hypothesis-generating, and strong inferential conclusions should not be drawn from them. By contrast, the finding for the CD4+:CD8+ ratio was directionally consistent across both the primary and sensitivity analyses and therefore represents the most stable immune-related outcome in this study.
From a public health nutrition perspective, the intervention approach used in the present study has practical relevance. Unlike most studies that have relied on phytosterol-fortified foods or supplements(Reference Fontané, Pedro-Botet and Garcia-Ribera38), the present study increased phytosterol intake by substituting the daily cooking oil with a phytosterol-enriched CWGO, making the intervention more closely aligned with habitual dietary practice. This type of dietary modification may be more compatible with everyday dietary practice than supplement-based approaches(Reference Amundsen, Ntanios and Van der Put39,Reference Cicero, Fogacci and Giovannini40) . Under these relatively moderate and sustainable dietary conditions, changes in T-cell-related parameters were nonetheless observed, suggesting that increasing phytosterol intake through habitual dietary sources may influence selected immune-related outcomes. Furthermore, no notable adverse events related to the intervention were observed, and no unfavourable changes in inflammatory markers or humoral immune indicators suggestive of immune suppression were detected, indicating that the intervention was generally safe and well tolerated under the conditions of this study.
This study has several strengths. First, it was based on a randomised controlled dietary intervention trial in which unified cafeteria-based feeding and standardised menus were used, substantially controlling for potential confounders including total energy intake, macronutrient composition and physical activity. Second, the use of a real-world dietary setting through substitution of daily cooking oil with a phytosterol-enriched CWGO may improve the relevance of the findings to everyday dietary practice. Third, the study assessed the potential immune effects of phytosterol dietary intervention across multiple dimensions, including systemic inflammation, humoral immunity and peripheral blood lymphocyte subsets, providing relatively comprehensive human evidence regarding the biological effects of phytosterols beyond lipid lowering.
This study also has several limitations. First, this was a secondary analysis of data from an existing randomised controlled trial, and the original sample size was not calculated with immune-related outcomes in mind; some analyses may therefore have been underpowered. We did not construct a composite immune ageing score in this secondary exploratory analysis. Immunosenescence is a multidimensional process involving coordinated changes across multiple immune compartments, and no single biomarker or universally validated composite score is currently available to capture immune ageing across intervention studies(Reference Nikolich-Žugich41–Reference Goronzy and Weyand43). Future studies with larger sample sizes and validated immune ageing frameworks are warranted. Second, the HPS and LPS intervention oils differed not only in phytosterol content but also in fatty acid composition and other minor bioactive constituents. Because fatty acids can influence inflammatory tone, membrane lipid composition, T-cell activation and cytokine signalling, the observed changes in T-cell subset balance cannot be attributed exclusively to phytosterols. In addition, because no end-of-intervention FFQ was collected, total dietary phytosterol intake during the intervention period could not be precisely quantified. Therefore, Table 3 should be interpreted as evidence of baseline comparability rather than as a direct estimate of intervention-period total phytosterol exposure. Overall, the present findings should be interpreted as effects of a phytosterol-enriched oil intervention rather than as isolated effects of phytosterols alone. Third, many immune-related endpoints were examined without formal adjustment for multiple comparisons, and positive findings should therefore be interpreted cautiously. Fourth, the study assessed peripheral blood immune markers only, without further examination of deeper immune functional indicators or molecular mechanisms. Finally, several cytokines were at or near the lower limit of detection in this study population, which may have reduced the ability to detect small between-group differences. Future studies specifically designed for immune outcomes, with larger sample sizes and longer intervention periods, are needed to confirm the immunomodulatory effects of phytosterol dietary intervention. Mechanistic investigations will also be required to clarify the underlying biological basis of these effects.
Conclusion
In this exploratory secondary analysis, a 12-week intervention with phytosterol-enriched CWGO was associated with changes in selected T-cell-related outcomes, particularly the CD4+:CD8+ ratio, in adults with dyslipidaemia. No significant differences between groups were observed for systemic inflammatory or humoral immune markers. In conclusion, supplementation with phytosterol-enriched CWGO for 12 weeks may affect T-cell subset balance among adults with dyslipidaemia, without evident changes in inflammatory, humoral immune, B-cell or NK-cell markers. As this is an unplanned secondary analysis with no predefined immune endpoints, the findings are preliminary and not conclusive. Further dedicated trials focusing on immune parameters are required to confirm our results.
Supplementary material
For supplementary material/s referred to in this article, please visit https://doi.org/10.1017/S0007114526108083
Acknowledgements
The authors thank all participants for their time and commitment to this trial. The authors also thank the clinical staff of Zhongda Hospital, Southeast University, and Nanjing Yi Jia Health Management Co., Ltd for their support in conducting the study.
This work was supported by the National Nutrition Research Fund Program initiated by the Chinese Nutrition Society (CNS-NNSRG2021-39). The funder had no role in the design of the study; the collection, analysis or interpretation of data; the writing of the manuscript; or the decision to submit the article for publication.
S. D.: Data curation-Lead, Investigation-Equal, Software-Equal, Supervision-Equal, Validation-Equal, Visualisation-Equal, Writing – original draft-Lead, Writing – review and editing-Lead; J. X.: Conceptualisation-Equal, Data curation-Equal, Methodology-Equal, Software-Equal, Supervision-Equal, Visualisation-Equal, Writing – original draft-Lead, Writing – review and editing-Lead; Z. Z.: Conceptualisation-Equal, Data curation-Lead, Methodology-Equal, Software-Equal, Supervision-Equal, Validation-Equal, Writing – original draft-Lead, Writing – review and editing-Lead; T. W.: Data curation-Equal, Formal analysis-Equal, Software-Equal, Supervision-Equal, Visualisation-Equal; R. Z.: Formal analysis-Equal, Software-Equal, Supervision-Equal, Validation-Equal, Visualisation-Equal; Z. H.: Investigation-Equal, Software-Equal, Supervision-Equal, Visualisation-Equal; G-F. S.: Funding acquisition-Equal, Software-Equal, Validation-Equal, Visualisation-Equal; Z. F.: Data curation-Equal, Formal analysis-Equal, Supervision-Equal, Validation-Equal, Visualisation-Equal; J. Y.: Investigation-Equal, Methodology-Equal, Resources-Equal, Supervision-Equal, Validation-Equal; J. W.: Data curation-Equal, Funding acquisition-Equal, Software-Equal, Supervision-Equal, Validation-Equal, Visualisation-Equal; S. Y.: Funding acquisition-Equal, Investigation-Equal, Software-Equal, Supervision-Equal, Validation-Equal; L. Y.: Formal analysis-Equal, Funding acquisition-Equal, Supervision-Equal, Validation-Equal, Visualisation-Equal; W. L.: Funding acquisition-Equal, Investigation-Equal, Supervision-Equal, Validation-Equal, Visualisation-Equal; H. X.: Funding acquisition-Equal, Supervision-Equal, Validation-Equal, Visualisation-Equal; S. W.: Data curation-Equal, Funding acquisition-Equal, Supervision-Equal, Validation-Equal, Visualisation-Equal; D. P.: Funding acquisition-Equal, Software-Equal, Supervision-Equal, Validation-Equal, Visualisation-Equal; G. S.: Conceptualisation-Equal, Project administration-Equal. All authors read and approved the final manuscript.
The authors declare they have no conflicts of interest.
The data that support the findings of this study are available from the corresponding author upon reasonable request.