Introduction
Interneurons in the brain exhibit remarkable morphological, molecular, and physiological diversity, suggesting that different interneuron subtypes may perform specific computational tasks. Consistent with this idea, interneuron subtypes target distinct populations of neurons and specific subcellular compartments within neurons, including functionally presynaptic compartments, such as the distal axon and synaptic terminal. The computational impact of presynaptic inhibition is complex and depends on factors, including the local chloride reversal potential, activity patterns, and release probability in the target axon (Engelman & MacDermott, Reference Engelman and MacDermott2004; Kullmann et al., Reference Kepecs and Fishell2005). In the retina, previous work has shown that presynaptic inhibition extends the dynamic range of light-evoked transmission from rod and cone bipolar cells (Euler & Masland, Reference Euler and Masland2000; Sagdullaev et al., Reference Roux and Buzsaki2006).
Here, we examined the impact of presynaptic inhibition by a single interneuron subtype on visual signaling in the rod pathway, which mediates night vision. Rod bipolar cells (RBCs) receive synaptic signals from rod photoreceptors and encode luminance (ϕ) in their membrane potential (V RBC; Berntson & Taylor, Reference Berntson and Taylor2000; Euler & Masland, Reference Euler and Masland2000; Oesch & Diamond, Reference Nikonov, Kholodenko, Lem and Pugh2011). RBC synapses continuously release neurotransmitter and encode V RBC (and luminance) in the frequency of synaptic vesicle release. Moreover, a step increase in luminance from one level (ϕ 1) to another, brighter level (ϕ 2, temporal contrast) elicits a transient bout of vesicle release that corresponds to the change between luminance levels. This transient release is proportional to Weber contrast [C w = (ϕ 2−ϕ 1)/ϕ 1; Oesch & Diamond, Reference Nikonov, Kholodenko, Lem and Pugh2011], a metric reflecting the psychophysical sensitivity to changes in sensory stimuli (Aguilar & Stiles, Reference Aguilar and Stiles1954; Weber, Reference von Gersdorff and Matthews1834; Whittle, Reference Weber1994).
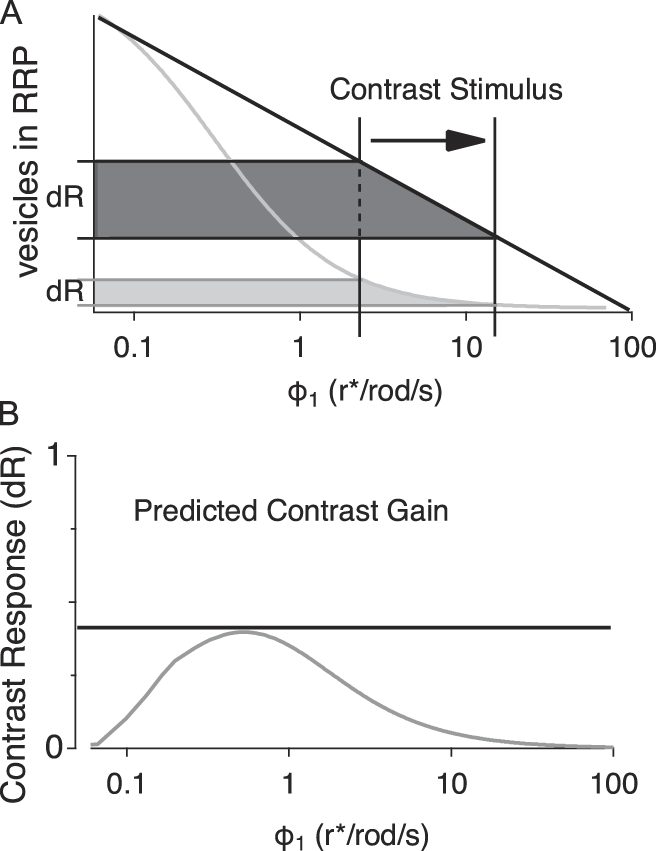
Synaptic release from RBCs can be recorded as an excitatory postsynaptic current (EPSC) in postsynaptic AII amacrine cells. In response to a sustained stimulus, this EPSC consists of two kinetically distinct phases: transient and sustained. The size of the transient phase of the EPSC is influenced by the size of the readily releasable pool (RRP), the synaptic vesicles docked at the presynaptic membrane, which are primed for immediate release. At RBC synapses, the RRP size reflects a dynamic balance between vesicle release from and replenishment to presynaptic release sites and varies with V RBC (Holt et al., Reference Heidelberger and Matthews2004; Jarsky et al., Reference Hong and Wilson2011; Oesch & Diamond, Reference Nikonov, Kholodenko, Lem and Pugh2011; Graydon et al., Reference Field and Rieke2014): As V RBC becomes more depolarized with increased luminance, RRP size decreases. Consequently, RRP size constitutes a physical (inverse) readout of luminance (Fig. 1A), and the transient bout of vesicle release corresponds to the change in RRP size between the two luminance levels. Because V RBC encodes luminance in roughly a log-linear fashion (Oesch & Diamond, Reference Nikonov, Kholodenko, Lem and Pugh2011), the extent to which the readout of this computation (i.e., the contrast gain) remains consistent over the physiological luminance range depends on the linearity of the log(ϕ 1)–RRP relationship (Fig. 1A and 1B).
Logistic functions determine response gain. (A) Theoretical intensity response functions plotted over the working range of luminance signaling in RBCs. The change in response level from ϕ 1 to ϕ 2 is shown on the y-axis for a perfectly linear–log function [y = (m − log(ϕ)) + b; black] and for a nonlinear–log Hill function (gray). (B) Plot of contrast gain over the range of ϕ 1 values predicted from the difference in response levels determined by the two curves shown in panel A.

RBC synaptic terminals receive inhibitory synaptic input from numerous subtypes of GABAergic and glycinergic amacrine cells (Dowling & Boycott, Reference Dowling and Boycott1966; Sterling & Lampson, Reference Singer, Lassova, Vardi and Diamond1986; Eggers & Lukasiewicz, Reference Eggers and Lukasiewicz2006a,Reference Eggers and Lukasiewiczb), including reciprocal GABAergic feedback inhibition from A17 amacrine cells (Dong & Hare, Reference Dong and Hare2003; Nelson & Kolb, Reference Mitchell and Silver1985). GABAergic inhibition has been shown to expand the dynamic range of RBC signaling (Euler & Masland, Reference Euler and Masland2000), but a specific role for A17s has not been investigated. Past work has suggested that A17-mediated inhibition may mediate center surround inhibition in the rod pathway (Bloomfield, Reference Bloomfield1992; Nelson & Kolb, Reference Mitchell and Silver1985; Völgyi et al., Reference Veruki, Zhou, Castilho, Morgans and Hartveit2002; Zhang et al., Reference Wilson, Runyan, Wang and Sur2002), enhance and sharpen responses near visual threshold (Dong & Hare, Reference Dong and Hare2003; Dong & Werblin, Reference Dong and Werblin1998; Grimes et al., Reference Grimes, Schwartz and Rieke2010), or improve the signal-to-noise characteristics of single-photon responses (Grimes et al., Reference Grimes, Zhang, Graydon, Kachar and Diamond2015). Here, we examined how presynaptic inhibition influences the dynamic range and consistency of contrast computation at the RBC terminal over a range of background luminance (ϕ 1). We recorded light-evoked EPSCs from AIIs in acutely prepared slices of dark-adapted rat retina and pharmacologically manipulated different components of presynaptic inhibition. Rather than universally decreasing release, the presence of GABAergic inhibition actually increased the transient EPSC evoked by a step increase in luminance over most of the background luminance range, enabling RBC synapses to compute Weber contrast over a wider range of luminance conditions. This effect appears to be mediated primarily by feedback inhibition from A17s: blocking inhibition from other GABAergic and glycinergic amacrine cells subtly modulated the gain of the RRP versus ϕ 1 relationship but did not affect the dynamic range of Weber contrast computation. We also found that GABAC receptors, located on RBC terminals and activated by GABA released from A17s (Grimes et al., Reference Graydon, Zhang, Oesch, Sousa, Leapman and Diamond2009, Reference Grimes, Zhang, Graydon, Kachar and Diamond2015), mediate most of the A17’s inhibitory effects on contrast computation.
Materials and methods
Slice and recording procedures
All animal procedures were conducted in accordance with NIH guidelines, as approved by the National Institute of Neurological Disorders and Stroke Animal Care and Use Committee (ASP 1220). Acute slices (200 µm thick) were prepared from retina isolated from Sprague-Dawley rats (p18–22), as previously described (Oesch & Diamond, Reference Nikonov, Kholodenko, Lem and Pugh2011; Singer & Diamond, Reference Shapley and Enroth-Cugell2003). Rats were dark-adapted for 2–3 h prior to dissection and all subsequent procedures were performed in darkness or under infrared (IR) illumination (940 nm). Retinas were isolated, and all subsequent procedures and recordings were performed in Ames’ medium (United States Biological, Salem, MA) equilibrated with 95% O2/5% CO2. For physiological recordings, the retinal slices were superfused with equilibrated Ames’ media at 4–5 ml/min at 35–37°C. Pharmacological agents were added to the superfusate at the specified final concentrations: 0.5 µ m tetrodotoxin (TTX; Ascent Scientific, Abcam, Cambridge, UK), 5 µ m SR-95531 (Ascent Scientific), 3 µ m strychnine (Sigma-Aldrich, St. Louis, MO), and 50 µ m TPMPA (Tocris Bioscience, Bristol, UK). RBCs and AIIs were targeted visually using IR (940 nM) differential interference contrast or Dodt contrast video microscopy. Whole-cell voltage clamp recordings were made with pipettes (4–6 MΩ) filled with solution containing (in mm) 90 CsCH3SO3, 20 TEA-Cl, 10 HEPES, 10 EGTA, 10 phosphocreatine disodium salt hydrate, 4 Mg-ATP, and 0.4 Na-GTP. Recordings were obtained using an Axopatch 700B amplifier (Molecular Devices, San Jose, CA), low-pass Bessel filtered at 4 kHz and digitized at 20–50 kHz with an Instrutech ITC-18 A/D board (HEKA Elektronik, Holliston, MA) controlled by custom acquisition software written in Igor Pro (WaveMetrics, Lake Oswego, OR). Traces were downsampled to 10 kHz and digitally filtered using a binomial smoothing algorithm in Igor Pro to approximate a Gaussian filter with a characteristic cutoff frequency of 2 kHz.
Light stimulation
Light stimuli were generated with a 525-nm LED and directed through a 1.0 NA 40× water-immersion objective (Zeiss, Thornwood, NY) to uniformly illuminate the 0.45-mm-diameter field of view. LED intensity controlled by pulse width modulation of the LED (500 Hz, 0.1% resolution) using a custom-built constant current power supply controlled digitally via the ITC18 and acquisition software and further attenuated with neutral density filters in a motorized filter wheel (ThorLabs, Newton, NJ), also controlled by the acquisition software. Photon flux was measured at the focal plane of the microscope objective using a DR-2000 radiometer (Gamma Scientific, San Diego, CA) and was converted to photoisomerization (r*)/rod assuming a collecting area of 0.5 µm (Field & Rieke, 2002). Light stimuli were presented at 15-s intervals and each set of light stimuli was presented three times.
Data analysis
Unless indicated otherwise, all data are reported as mean ± s.d. Statistical comparisons were made with t-tests (α = 0.05), and in the case of multiple (n) comparisons, Bonferroni correction (α = 0.05/n) was applied.
To measure transient release components for either light-evoked or paired recordings, we integrated release over the transient component (0.5 s) and subtracted the baseline offset measured immediately preceding the transient response to isolate the transient change in release. (Measuring the peak current yielded qualitatively similar results.) For comparison, we normalized all transient and sustained responses to the maximal response. To determine threshold (10% RRP depletion), saturation (90% RRP depletion), and dynamic range, we fit the integrated release from the second transient in the depletion protocol to the Hill function:
 $$y = {\rm{base}} + {{{\rm{max}} - {\rm{base}}} \over {\left( {1 + {{\left( {{{x{\rm{half}}} \over x}} \right)}^{{\rm{rate}}}}} \right)}},$$
using the Igor Pro “CurveFit” routine. We then rescaled the y-axis between 0 and 1 and measured the x-value, where y crossed 0.1 (ϕ saturation) and 0.9 (ϕ threshold). The dynamic range was calculated as the difference between ϕ saturation and ϕ threshold. To compare how “linear” RRP depletion was relative to log luminance, we used Igor Pro’s CurveFit routine to fit the data to function (m − log(ϕ)) + b. The chi-square was measured for each fit against the data, and pairwise comparisons were made using the two-tailed t-test. Contrast gain distributions were fit with a sigmoid function for the purposes of qualitative comparison:
 $$y = {\rm{base}} + \left\{ {{{\max } / {\left( {1 + \exp \left( {{{{x_{{1 / 2}}} - x} \over {{\rm{rate}}}}} \right)} \right)}}} \right\}.$$
Results
AII amacrine cells receive glutamatergic input from RBCs via AMPA receptors that provide a linear, high-fidelity readout of RBC synaptic release (Heidelberger & Matthews, Reference Heidelberger, Heinemann, Neher and Matthews1992; Heidelberger et al., Reference Hartveit1994; von Gersdorff & Matthews, Reference Völgyi, Xin and Bloomfield1997; Hartveit, Reference Grimes, Zhang, Tian, Graydon, Hoon, Rieke and Diamond1999; Singer & Diamond, Reference Shapley and Enroth-Cugell2003; Singer et al., Reference Singer and Diamond2004; Oesch & Diamond, Reference Nikonov, Kholodenko, Lem and Pugh2011). Our previous work demonstrated that the steady-state size of the RRP is a key substrate for computing contrast signals at the RBC (Oesch & Diamond, Reference Nikonov, Kholodenko, Lem and Pugh2011), but we did not examine how inhibitory inputs to the RBC terminal influence contrast coding. To address this, we first recorded light-evoked changes in whole-cell currents in AIIs in dark-adapted acute rat retinal slices with synaptic inhibition intact (Fig. 2). To elicit primarily rod-driven responses, light stimulus levels were kept well below the threshold for cone activation [<100 rhodopsin photoisomerizations per rod per second (r*/rod/s); Nikonov et al., Reference Nelson and Kolb2006; Ke et al., Reference Jarsky, Cembrowski, Logan, Kath, Riecke, Demb and Singer2014].
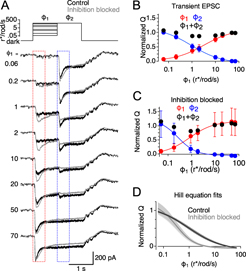
Inhibition alters the relationship between ϕ 1 and RRP size. (A) Top: Intensity of the light stimulus over time for a family of light stimuli to measure RRP depletion. Bottom: Average responses across 10 cells for control conditions (black traces) and in the presence of 0.5 µ m TTX, 3 µ m strychnine, 5 µ m SR95531, and 50 µ m TPMPA (gray traces) to block all inhibition. Traces are presented in order of increasing ϕ 1 intensity from the top down. Dashed boxes denote time windows for calculating charge transfer. (B) Average charge transfer of the transient peak in response to ϕ 1 (red) and ϕ 2 (blue), plotted against ϕ 1 and normalized to the ϕ 1 step to 72 r*/rod/s, for control responses. Solid lines are the Hill equation fits to the data. Black circles show the sum of the responses to ϕ 1 and ϕ 2 at each ϕ 1. Error bars indicate standard deviation. (C) Average charge transfer of the transient peak in response to ϕ 1 (red) and ϕ 2 (blue), normalized to the ϕ 1 step to 72 r*/rod/s, during inhibitory block. Solid lines show Hill equation fits to the data. Error bars indicate standard deviation. (D) Average (solid lines) and standard error (shading), for Hill equation fits to each cell in control conditions (black) and during inhibitory block (gray, n = 10).
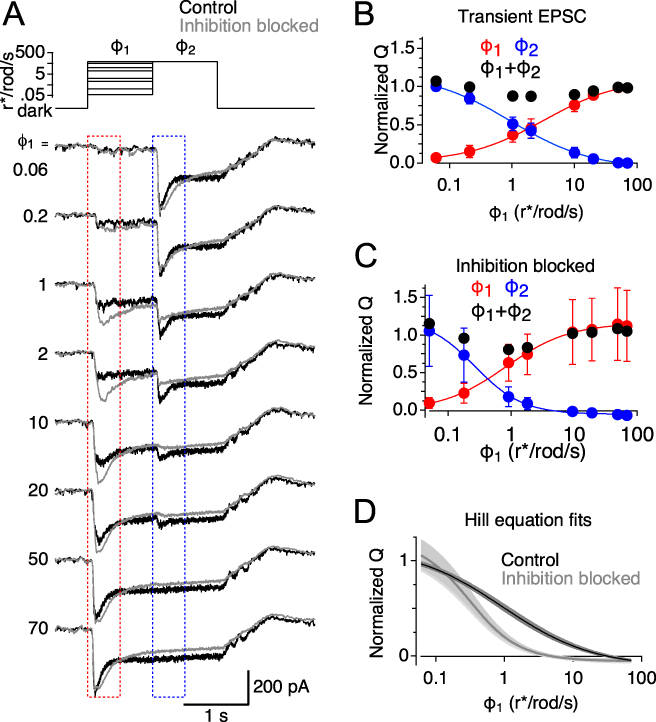
The full-field luminance was stepped from complete darkness to different luminance (ϕ 1) values (0.08–72 r*/rod/s) for 1 s, enough time for RBC release and RRP size to settle to new steady-state levels (Fig. 2A). The luminance was then stepped to a higher level (ϕ 2; 72 r*/rod/s; Fig. 2A) to evoke release of the remaining RRP (Oesch & Diamond, Reference Nikonov, Kholodenko, Lem and Pugh2011). Light-evoked EPSCs were recorded from the AII amacrine cells, and the transient EPSC size was quantified by integrating the transient component of the EPSC (after subtracting the preceding sustained EPSC baseline). The sum of the two transient responses was relatively constant over the entire range of ϕ 1 levels (black circles, Fig. 2B) and equivalent to the transient response evoked by a step from darkness directly to ϕ 2, indicating that the sum reflects release of the entire RRP (i.e., the total number of vesicles available in darkness). Thus, the transient EPSC evoked by ϕ 1 reflects the change in RRP size between complete darkness and ϕ 1, and the transient EPSC evoked by the second step to ϕ 2 reflects the RRP size at each ϕ 1 (Oesch & Diamond, Reference Nikonov, Kholodenko, Lem and Pugh2011). Light steps were brief and slices were kept in complete darkness between trials to minimize slower adaptation processes in the rod pathway (Grimes et al., Reference Grimes, Li, Chavez and Diamond2014; Ke et al., Reference Jarsky, Cembrowski, Logan, Kath, Riecke, Demb and Singer2014); accordingly, we saw little change in sensitivity over the course of an experiment.
To test the effects of inhibition on light-evoked EPSCs in AIIs, this light stimulation protocol was repeated after the slice was superfused with extracellular solution containing SR95531 (5 µ m), TPMPA (50 µ m), and strychnine (3 µ m) to block GABAA, GABAC, and glycine receptors, respectively (Fig. 2A, gray traces). In the absence of inhibition, transient responses to ϕ 2 decreased more steeply as a function of ϕ 1. To quantify this, we measured the luminance values where RRP occupancy fell below 90% and 10% of maximum occupancy from the Hill equation fit to the data. In the presence of inhibitory blockers, luminance corresponding to 10% maximum occupancy decreased significantly compared with control (2.25 ± 1.1 r*/rod/s vs. 15.6 ± 6.4 r*/rod/s, n = 9; P = 2.3 × 10⁻⁴, paired t-test; Fig. 2B and 2C). Therefore, blocking inhibition reduced the dynamic range (luminance range between the 10% and 90% maximal occupancy levels) over which RBC synapses could encode luminance changes, from 39.8 ± 3.1 dB in control conditions to 25.6 ± 4.9 dB with inhibition blocked (n = 9, P = 3.9 × 10⁻⁵, paired t-test; see Materials and methods), with no significant change in the size of the RRP (n = 9, P = 0.75, paired t-test; Fig. 2D). These results are analogous to those reported in ON ganglion cells of the mouse retina (Sagdullaev et al., Reference Roux and Buzsaki2006) and RBCs in the rat retina (Euler & Masland, Reference Euler and Masland2000).
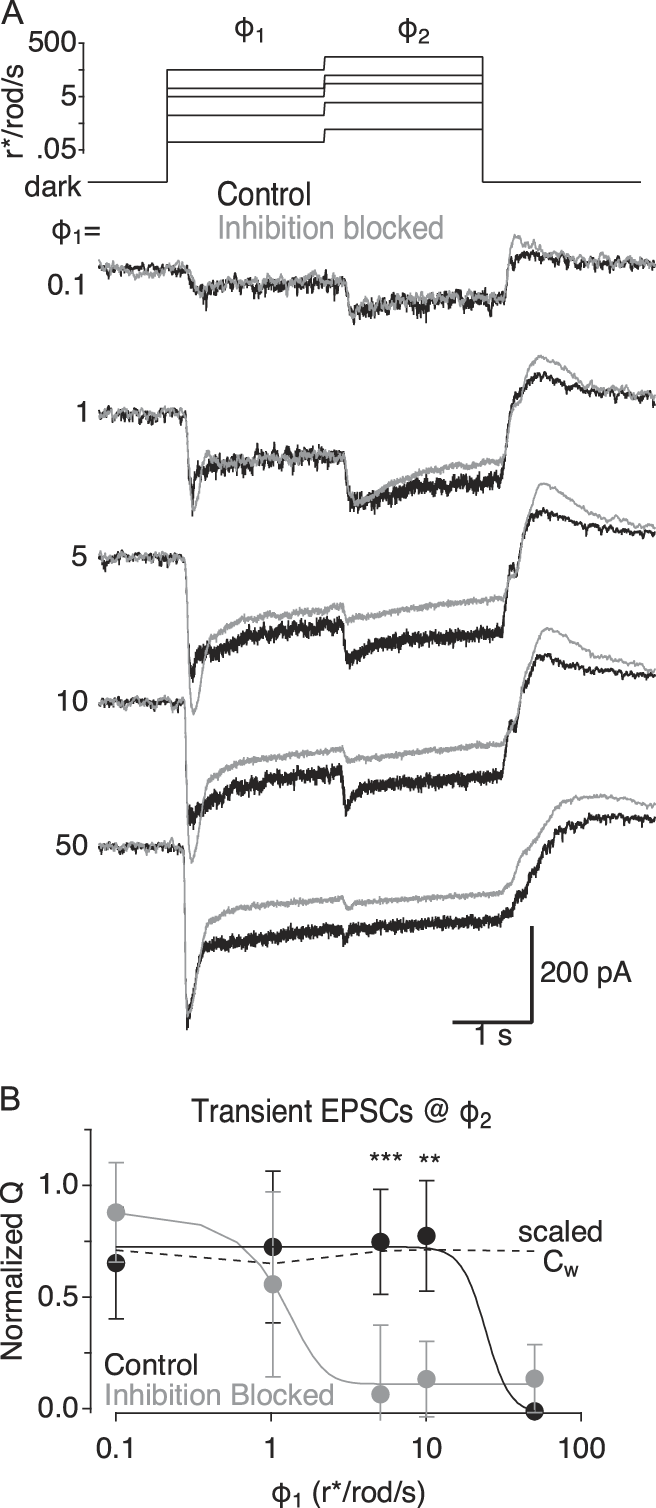
By expanding the dynamic range of the transient responses to ϕ 2, inhibition may enhance the range over which RBCs report contrast consistently (Fig. 1). To test this hypothesis, we repeated the two-step stimulus paradigm but varied luminance steps, so that the Weber contrast between ϕ 1 and ϕ 2 was nearly the same (Weber contrast = 1.97 ± 0.073) in each trial across a wide range of ϕ 1 values (0.1–50 r*/rod/s; Fig. 3A). Under control conditions, transient release evoked by the step from ϕ 1 to ϕ 2 remained constant up to ϕ 1 = 10 r*/rod/s, matching the constant Weber contrast in the stimulus (Fig. 3B); contrast was not encoded above 10 r*/rod/s, presumably because at these luminance levels the RRP was nearly completely depleted (Fig. 2B) and further luminance increases could not elicit transient release. Blocking inhibition during constant contrast stimulation reduced the ϕ 1 range over which Weber contrast was encoded (Fig. 3B; see Materials and methods), as predicted from the observed changes in dynamic range (Fig. 2D). These results demonstrate that synaptic inhibition increases the range of background luminance over which Weber contrast is signaled.
Inhibition alters contrast gain across a range of ϕ 1. (A) Top: Intensity of the light stimulus over time for a family of light stimuli to measure contrast gain. Bottom: Average responses across 11 cells for control conditions (black traces) and in the presence of 0.5 µ m TTX, 3 µ m strychnine, 5 µ m SR95531, and 50 µ m TPMPA (gray traces) to block all inhibition. (B) Average charge transfer of the transient peak in response to ϕ 2 in control (black symbols) and during inhibitory blockade (gray symbols) plotted against the ϕ 1 and normalized to the maximal response in control. Solid lines show sigmoid fits for qualitative comparisons between the two distributions. Dashed line plots the actual Weber contrast between ϕ 1 and ϕ 2 for each pair, plotted against ϕ 1 and scaled for comparison to transient EPSCs. Error bars indicate standard deviation. Asterisks indicate P values that reached significance following Bonferroni correction (i.e., α = 0.01 **P < 0.01 ***P < 0.001).

Given the diversity of inhibitory signaling in the retina, we next examined how specific types of inhibition influenced contrast signaling. RBC axon terminals receive at least three pharmacologically distinguishable classes of inhibitory inputs. Here, we refer to two of the three classes as “lateral” inhibition, because they are mediated by amacrine cells that are driven by other bipolar cells (Chávez et al., Reference Chávez, Grimes and Diamond2010; Eggers et al., Reference Eggers, McCall and Lukasiewicz2007). Lateral inhibition from glycinergic amacrine cells is blocked completely by the glycine receptor antagonist strychnine, whereas lateral inhibition from GABAergic amacrine cells is eliminated by blocking Nav channels with tetrodotoxin (TTX; Chávez & Diamond, Reference Chávez and Diamond2008). This allows us to isolate the third component, reciprocal GABAergic feedback inhibition from A17 amacrine cells, which inhibits the same RBC terminal from which it receives glutamatergic excitation; reciprocal inhibition persists in the presence of TTX but is eliminated by GABA receptor antagonists (Chávez et al., Reference Chávez, Singer and Diamond2006; Hartveit, Reference Grimes, Zhang, Tian, Graydon, Hoon, Rieke and Diamond1999).
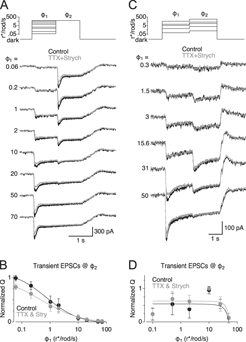
We examined the effect of lateral inhibition on the relationship between RRP and luminance by repeating this stimulation protocol, first in control solution and then in the presence of strychnine (3 µM) and TTX (0.5 µM) (Fig. 4A). Blocking lateral inhibition did not significantly change the slope of the log(ϕ 1) versus Q transient relationship (P = 0.53, paired t-test; Fig. 4B), and we did not detect a significant change in the dynamic range (34.5 ± 3.9 vs. 37.7 ± 2.3 dB, n = 6, P = 0.07, paired t-test). Accordingly, in experiments in which ϕ 2 was varied to maintain constant contrast (as in Fig. 3), blocking lateral inhibition did not change the range over which contrast was encoded reliably (Fig. 4C and 4D).
Lateral inhibition does not influence ϕ 1–RRP relationship or contrast gain. (A) Top: Intensity of the light stimulus over time for a family of light stimuli to measure RRP depletion. Bottom: Average responses across six cells for control conditions (black traces) and in the presence of 0.5 µ m TTX and 3 µ m strychnine (gray traces) to block lateral inhibition. Traces are presented in order of increasing ϕ 1 intensity from the top down. (B) Average charge transfer of the transient peak in response to ϕ 2, for control responses (black symbols), and during block of lateral inhibition with 0.5 µ m TTX and 3 µ m strychnine (gray symbols) plotted against ϕ 1 and normalized to the ϕ 1 step to 72 r*/rod/s in control. Error bars indicate standard deviation. Solid lines are Hill equation fits to the data (n = 6). (C) Top: Intensity of the light stimulus over time for a family of light stimuli to measure contrast gain. Bottom: Average responses across five cells for control conditions (black traces) and in the presence of 0.5 µ m TTX and 3 µ m strychnine (gray traces) to block all inhibition. (D) Average charge transfer of the transient peak in response to ϕ 1, for control responses (black symbols), and during block of lateral inhibition with 0.5 µ m TTX and 3 µ m strychnine (gray symbols) plotted against ϕ 1 and normalized to the maximal response. Error bars indicate standard deviation (n = 5). Solid lines show sigmoid fits for qualitative comparisons between the two distributions.

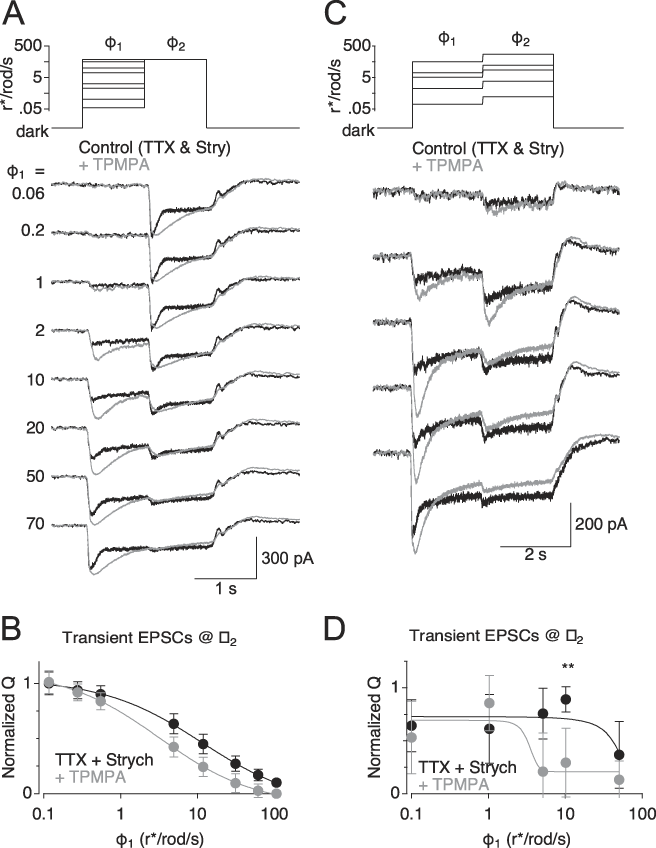
Previous work has demonstrated that GABA release from A17s can activate both GABAA and GABAC receptors on RBC terminals (Pan & Lipton, Reference Oesch and Diamond1995; Hartveit, Reference Grimes, Zhang, Tian, Graydon, Hoon, Rieke and Diamond1999; Euler & Masland, Reference Euler and Masland2000; Singer & Diamond, Reference Shapley and Enroth-Cugell2003; Chávez et al., Reference Chávez, Singer and Diamond2006, Reference Chávez, Grimes and Diamond2010; Grimes et al., Reference Grimes, Zhang, Graydon, Kachar and Diamond2015). In ON cone bipolar cells, GABAC receptor–mediated feedback enhances the dynamic range of synaptic signaling (Sagdullaev et al., Reference Roux and Buzsaki2006). GABAergic inhibition has been shown to expand the dynamic range of RBC responses (Euler & Masland, Reference Euler and Masland2000), but a specific role for GABAC receptors was not examined. Here, blocking GABAC receptors with TPMPA significantly reduced the range over which RBC synapses encoded luminance (from 38.1 ± 5.1 to 29.2 ± 4.6 dB, n = 12, P = 6.8 × 10⁻⁵, paired t-test), similar to the effects blocking inhibition entirely (Fig. 3) and analogous to effects reported in the cone pathway (Sagdullaev et al., Reference Roux and Buzsaki2006). Accordingly, TPMPA also reduced the range over which RBC transient responses reliably encoded contrast (Fig. 5D). These results show that GABAC receptors play a major role in mediating the A17’s modulation of contrast gain in RBC synapses.
GABAC receptors are responsible for shaping contrast gain. (A) Top: Intensity of the light stimulus over time for a family of light stimuli to measure RRP depletion. Bottom: Average responses across 12 cells for control conditions (0.5 µ m TTX and 3 µ m strychnine; black traces) and following addition of 50 µ m TPMPA (gray traces) to block GABAC receptors. (B) Average charge transfer of the transient peak in response to ϕ 2 in control (black symbols) and during GABAC blockade (gray symbols), plotted against the ϕ 1 and normalized to the maximal response in control. Error bars indicate standard deviation (n = 12). (C) Top: intensity of the light stimulus over time for a family of light stimuli to measure contrast gain. Bottom: Average responses across 12 cells for control conditions (0.5 µ m TTX and 3 µ m strychnine; black traces) with the addition of 50 µ m TPMPA (gray traces) to block GABAC receptors. (D) Average charge transfer of the transient peak in response to ϕ 2 in control (black symbols) and during GABAC blockade (gray symbols), plotted against the ϕ 1 and normalized to the maximal response in control. Error bars indicate standard deviation (n = 12). Asterisks indicate P values that reached significance following Bonferroni correction (i.e., α = 0.01 **P < 0.01). Solid lines show sigmoid fits for qualitative comparisons between the two distributions.

Discussion
Here, we show that lateral and reciprocal presynaptic inhibition, mediated by pharmacologically separable populations of interneurons, play distinct roles in modulating synaptic release and contrast/luminance coding at RBC synapses in rat retina. We show that reciprocal but not lateral feedback synapses onto RBC terminals equalize the contrast gain across a range of background luminance. Furthermore, we demonstrate that presynaptic GABAC receptors on RBC terminals, activated by reciprocal feedback from A17 amacrine cells, play the primary role in extending the range of contrast computation.
Computational roles of presynaptic inhibition
These results indicate that reciprocal synaptic inhibition from the A17 amacrine cell expands the range of luminance over which RBC synapses encode Weber contrast. In addition, reciprocal feedback inhibition onto RBC synaptic terminals maintains the contrast responses (contrast gain) at a consistent level across a range of luminance. Ganglion cell recordings and psychophysical tests of luminance perception both demonstrate that contrast gain is largely constant across a wide range of background luminance (Enroth-Cugell & Shapley, Reference Enroth-Cugell and Shapley1973), suggesting that this function may be involved in a fundamental optimization of the contrast signal to meet downstream demands in the visual system. This work contributes to our understanding of the mechanisms that may underlie this optimized contrast signaling.
The A17 amacrine cell’s role traditionally has been thought to mediate center surround inhibition (Bloomfield, Reference Bloomfield1992; Nelson & Kolb, Reference Mitchell and Silver1985; Völgyi et al., Reference Veruki, Zhou, Castilho, Morgans and Hartveit2002; Zhang et al., Reference Wilson, Runyan, Wang and Sur2002); more recent evidence suggests, however, that A17 output synapses operate as independent reciprocal feedback processors (Grimes et al., Reference Grimes, Schwartz and Rieke2010), contrary to their proposed role in integrating surround information. A subsequent study suggested a role for A17-mediated feedback in resolving weak stimuli near the visual threshold (Grimes et al., Reference Grimes, Zhang, Graydon, Kachar and Diamond2015). Earlier work indicated that reciprocal GABAergic feedback shapes the time course of bipolar cell release in salamander and rabbit retina (Dong & Hare, Reference Dong and Hare2003; Dong & Werblin, Reference Dong and Werblin1998). The present study elaborates on this hypothesis, demonstrating how A17-mediated reciprocal inhibition can help compute changes in luminance over time (i.e., temporal contrast) in a perceptually relevant context.
Though our experimental results point to a clear computational task achieved by A17-mediated reciprocal feedback, they do not identify a particular role for the lateral inhibition provided by other GABAergic and glycinergic amacrine cells in the rod pathway. Blocking lateral inhibition exerted only a very minor effect on synaptic release from the RBC synapse and did not alter the shape, tuning, or operating range of the RRP–luminance relationship. Given the prominence of lateral inhibitory synapses on the RBC terminal (Sterling & Lampson, Reference Singer, Lassova, Vardi and Diamond1986), it seems likely that lateral inhibition influences a different computation that was not engaged in the experiments performed here. One additional possibility is that relevant lateral connections were severed during the slicing procedure, perhaps leading to a bias toward more local circuitry. Future experiments examining feedback inhibition in the wholemount retina may address this issue.
Computing Weber contrast as gain normalization
Gain normalization, a fundamental computational strategy employed in all sensory systems and many other neural circuits, enables a particular perceptual quality or stimulus feature to be represented equally (normalized) across a wide range of input strength (Carandini & Heeger, Reference Carandini and Heeger2012; Hong & Wilson, Reference Holt, Cooke, Neef and Lagnado2013). The Weber contrast computation in RBC terminals is a straightforward example of this strategy, because the signal representing a perceptually relevant feature (in this case, the luminance change in space-time) is normalized to the intensity (luminance) of the background on which the signal occurs, resulting in a perceptually equal response to a percent change contrast stimulus independent of background lighting conditions (Shapley & Enroth-Cugell, Reference Sagdullaev, McCall and Lukasiewicz1984).
Inhibition has been implicated in gain normalization elsewhere in the brain, but universal rules (if any) for inhibition’s role remain incompletely resolved (Kepecs & Fishell, Reference Ke, Wang, Borghuis, Cembrowski, Riecke, Kath, Demb and Singer2014; Mitchell & Silver, Reference Kullmann, Ruiz, Rusakov, Scott, Semyanov and Walker2003; Roux & Buzsaki, Reference Pan and Lipton2015; Wilson et al., Reference Whittle and Lawrence2012). Interestingly, the reciprocal inhibition described here does not strictly perform subtraction or division, two computations most typically associated with inhibition and neural adaptation, but rather a combination of the two. In the RBC–A17 circuit, the dynamics of reciprocal inhibition seems specifically tuned to boost or suppresses contrast signals as needed to establish more consistent contrast gain over the operating range for the RBC ribbon synapse.
Distinct roles for different components of feedback inhibition
While it is well established that different inhibitory interneurons perform distinct tasks, the work presented here demonstrates that different inhibitory receptors within the same synapse also may play distinct roles, possibly increasing the computational capacity of a single synapse. At synapses between ON cone bipolar cells and ganglion cells, activation of presynaptic GABAC receptors reduces the extent of multivesicular release and selectively limits activation of perisynaptic N-methyl-D-aspartate (NMDA) receptors on ganglion cell dendrites (see also Sagdullaev et al., Reference Roux and Buzsaki2006). Although both A17s and AII amacrine cells express functional NMDA receptors (Veruki et al., Reference Sterling and Lampson2018), their postsynaptic responses are mediated exclusively by AMPA receptors (Singer & Diamond, Reference Shapley and Enroth-Cugell2003; Chávez et al., Reference Chávez, Singer and Diamond2006; Veruki et al., Reference Sterling and Lampson2018). Because blocking the GABAC receptor–mediated component of reciprocal inhibition causes effects that are similar to those observed when all reciprocal feedback inhibition is blocked (cf. Figs. 2D and 5D), it appears that GABAC receptors are the primary effectors that modulate contrast gain at the RBC synapse. Effects of GABAA receptor blockade alone are difficult to interpret due to GABAA receptor–mediated inhibition between amacrine cells (Eggers & Lukasiewicz, Reference Eggers and Lukasiewicz2011). GABAA and GABAC receptors may underlie distinct parallel functions at RBC synapses, but our stimulus protocols may not have engaged those mediated by GABAA receptors. Further experiments are required to fully understand the roles of these receptors in RBC signaling.
Acknowledgment
We thank Dr. Wei Li for helpful comments on the manuscript. This work was supported by the NINDS Intramural Research Program (1ZIANS003039 to JSD).