


Introduction
Mild cognitive impairment (MCI) is characterized by memory or cognitive deficits that do not affect daily function (Langa and Levine, Reference Langa and Levine2015). There are two primary subtypes of MCI, amnestic and non-amnestic MCI (Mariani et al., Reference Mariani, Monastero and Mecocci2007). Amnestic MCI is predominantly a decline in memory, while non-amnestic MCI is impairment in other non-memory cognitive domains, such as attention, visuospatial functioning, language, or executive functioning (Csukly et al., Reference Csukly2016; Ganguli et al., Reference Ganguli2010).
Prevalence estimates of MCI range between 16% and 20% worldwide, primarily affecting older adults (Roberts and Knopman, Reference Roberts and Knopman2013). Persons with MCI and depression have a higher rate of progression to Alzheimer’s disease than MCI patients without depression, with progression rates of 31% and 13.5%, respectively (Ma, Reference Ma2020).
Ultimately, comorbid depression with MCI affects 32% (95% Cl 27, 37) of MCI patients (Ismail et al., Reference Ismail2017), and individuals experiencing both have difficulty with immediate and delayed memory tasks in comparison with non-depressed persons with MCI (Ismail et al., Reference Ismail2017). Additionally, persons with both MCI and depression typically have lower processing speeds and show a decrease in executive function, flexibility, and lexico-semantic function than MCI patients without depression (Ma, Reference Ma2020). Unfortunately, these patients more frequently experience a poorer quality of life than MCI patients without depression (Ismail et al., Reference Ismail2017). Furthermore, depressive symptoms in MCI are associated with greater amyloid-β burden (Krell-Roesch et al., Reference Krell-Roesch2019; Miao et al., Reference Miao2021).
Given the substantial burden that MCI patients experience when facing cooccurring depressive symptoms, it is crucial that healthcare practitioners be able to detect depressive symptoms accurately. Depressive symptoms are currently assessed clinically using various different rating scales. However, the accuracy of these tools, in persons living with MCI, is not fully elucidated. The objective of our systematic review is to determine which tools for detecting depressive symptoms are the most accurate and feasible among outpatients with MCI, compared with a reference standard clinical diagnosis of depression.
Current publications in the IPG examine the prevalence of depressive symptoms among persons with MCI or elaborate on the prevalence of MCI amongst persons with geriatric depression. However, there is a lack of studies currently characterizing how efficacious depression detecting tools are in the context of MCI. Many of these articles feature common depression detection tools yet do not explore how accurate they are. Our study serves as a benchmark for future research endeavors, to develop novel tools specifically for patients with MCI, or conduct diagnostic accuracy studies on existing tools.
Methods
The protocol has been registered with PROSPERO (Making the Case for Investing in Mental Health in Canada, 2013) (CRD42016052120). The study is reported as per the Preferred Reporting Items for Systematic Reviews and Meta-Analyses (PRISMA) statement and guidelines (Moher et al., Reference Moher2015).
Search strategy
A literature search strategy was developed in conjunction with an experienced librarian. The databases MEDLINE, EMBASE, PsycINFO, and Cochrane Database for Systematic Reviews were searched from inception until April 25, 2021. They were searched using clusters of terms (key words and search terms specific to each database). The main search clusters were MCI, depression, and diagnostic accuracy terms. Within each cluster, keywords and specific search terms were combined using “or,” and clusters were then subsequently combined using “and.” The specific MEDLINE search used is shown in Appendix 4 (see Appendix 4 published as supplementary material online attached to the electronic version of this paper at https://multimediafluids.uam.elogim.com/core/journals/international-psychogeriatrics). All relevant terms describing depressive symptoms were included in the search, in addition to related derivatives of MCI. A gray literature search was also conducted from inception to January 10, 2021 (Appendix 3) (see Appendix 3 published as supplementary material online attached to the electronic version of this paper at https://multimediafluids.uam.elogim.com/core/journals/international-psychogeriatrics). All languages were included in this search. The organizations searched include mental health organizations, cognitive sites, general gray databases, search engines, international databases, and theses (Moher et al., Reference Moher2015).
Selection and eligibility
All abstracts were assessed for eligibility, in duplicate, by two independent authors (B.W and Z.G). We have defined MCI based on adult outpatients using Petersen criteria (Petersen et al., Reference Petersen1997) or an NIA-AA diagnosis of MCI (Albert et al., Reference Albert2011), or a tool designed to assess MCI. Studies must use any depression detection tool (i.e. Geriatric Depression Scale (Yesavage and Sheikh, Reference Yesavage and Sheikh1986), Neuropsychiatric Inventory Scale (Cummings et al., Reference Cummings1994), and so forth), or depressive symptoms assessment as a way to detect depressive symptoms, compared to a reference standard. Reference standards included were a clinician’s diagnosis, any diagnosis of depression from any version of the Diagnostic and Statistical Manual of Mental Disorders (DSM) (American Psychiatric Association, 2013) (i.e. DSM IV, V, and so forth) or the International Classification of Diseases (ICD) (The ICD-10 Classification of Mental and Behavioural Disorders, 1992) (i.e. ICD 9, 10, and so forth).
No language or age restrictions were used. At abstract screening, an article was included if it discussed MCI and a depression detection tool. Any abstract included by either author was included for full text. At full-text screening stage, articles were included if they looked at a tool compared to a reference standard and reporting of diagnostic accuracy outcomes. The full texts were reviewed in duplicate by two independent authors. All non-English abstracts were translated using the online translation software Google Translate and similarly assessed at the full-text stage using this software.
Assessment of risk of bias
A risk of bias assessment was completed in duplicate by two independent authors (Z.G and B.W) using the Quality Assessment of Diagnostic Accuracy Studies 2 (QUADAS-2) tool (Whiting et al., Reference Whiting2011). The QUADAS-2 is an improved version of the QUADAS tool and is designed specifically for systematic reviews of diagnostic accuracy studies (Whiting et al., Reference Whiting2011). Therefore, assessment of the quality of included studies is appropriate using the QUADAS-2. The QUADAS-2 has four domains, including Patient Selection, Index Test, Reference Standard, and its Flow of Timing (Whiting et al., Reference Whiting2011).
Data extraction and synthesis of evidence
The data extraction criteria were created together by two authors (Z.G and B.W). The data were then extracted by one author (B.W) and verified by another (Z.G). Specific information extracted is outlined in Table 1. These elements include demographics such as total sample size and the percentage of females in the total sample or MCI subgroup. In addition, the prevalence of depression based on the reference standard, specific index tool used and its cutoff value, and the sensitivity, specificity, positive and negative likelihood ratios (positive likelihood ratio [PLR] and negative likelihood ratio [NLR], respectively), and positive predictive value and negative predictive value were extracted.
Data extraction information obtained from each included article

GS, gold standard; NLR, negative likelihood ratio; NPV, negative predictive value; NR, not reported; PLR, positive likelihood ratio; PPV, positive predictive value; SN, sensitivity; SP, specificity.
Results
Database searches
The database search generated 11,190 abstracts, and upon removing duplicates, 8,748 remained. 2,542 records were identified through the gray literature search. 10,625 records from all sources were excluded at level 1 abstract screening, because articles lacked an MCI population or subpopulation, or did not report a depression assessment tool. 665 records were then included at full-text screening. At this stage, articles were excluded because they did not report the diagnostic accuracy of their index tools (sensitivity, specificity, or likelihood ratios) (n = 73), did not have a reference standard diagnosis of depression (n = 275), or the article found was a conference abstract (n = 184). The latter represents abstracts where the full-text version was searched for but could not be found. Authors of included studies that did not report their sensitivity and specificity measures or prevalence of depression in the MCI subgroup based on the reference standard were emailed for verification or were calculated by the authors if enough information was given. Two out of four contacted authors responded. The exclusion criteria are listed in the PRISMA diagram (Figure 1). From full-text screening, six articles were included for qualitative analysis.
PRISMA diagram depicting the review flow (Moher et al., Reference Moher2009). 11,290 articles were screened in level 1 screening, from which 665 remained. After level 2, full-text screening, six articles were chosen for qualitative analysis.

Summary of included studies
Six studies were included in the final qualitative synthesis, with dates ranging from 2006 to 2011 (Artero et al., Reference Artero2008; Boyle et al., Reference Boyle2011; Di Iulio et al., Reference Di Iulio2010; Dierckx et al., Reference Dierckx2007; McCabe et al., Reference McCabe2006; Ros et al., Reference Ros2011). All included articles were written in English. The total percent female ranged from 56.50% to 66.70% (Artero et al., Reference Artero2008; Boyle et al., Reference Boyle2011; Di Iulio et al., Reference Di Iulio2010; Dierckx et al., Reference Dierckx2007; McCabe et al., Reference McCabe2006; Ros et al., Reference Ros2011), whilst the sample size ranged from 113 to 6,892 individuals (Artero et al., Reference Artero2008; Boyle et al., Reference Boyle2011; Di Iulio et al., Reference Di Iulio2010; Dierckx et al., Reference Dierckx2007; McCabe et al., Reference McCabe2006; Ros et al., Reference Ros2011). The studies were conducted in France, Italy, Belgium, Australia, and Spain (Artero et al., Reference Artero2008; Boyle et al., Reference Boyle2011; Di Iulio et al., Reference Di Iulio2010; Dierckx et al., Reference Dierckx2007; McCabe et al., Reference McCabe2006; Ros et al., Reference Ros2011). The mean age of participants ranged from 70.1 ± 6.5 to 86.64 ± 6.59 years of age (Artero et al., Reference Artero2008; Boyle et al., Reference Boyle2011; Di Iulio et al., Reference Di Iulio2010; Dierckx et al., Reference Dierckx2007; McCabe et al., Reference McCabe2006; Ros et al., Reference Ros2011).
Five articles reported on a strict MCI diagnosis (Artero et al., Reference Artero2008; Di Iulio et al., Reference Di Iulio2010; Dierckx et al., Reference Dierckx2007; McCabe et al., Reference McCabe2006; Ros et al., Reference Ros2011), whilst 1 other article (Boyle et al., Reference Boyle2011) used a broader subgroup of patients experiencing cognitive impairment. The specific type of MCI was generally not mentioned among the articles; however, Di lulio et al. (Reference Di Iulio2010) reported on multidomain and amnestic MCI (Di Iulio et al., Reference Di Iulio2010). MCI was assessed by two studies using Petersen’s criteria of MCI (Di Iulio et al., Reference Di Iulio2010; Dierckx et al., Reference Dierckx2007). Other studies (n = 5) evaluated MCI using varying tools. Specifically, one study assessed MCI with cognitive tests such as the Benton Visual Retention Test, the Trail making Test, the Isaacs’ Set Test, and a word recall test with both delayed free recall and recall with semantic prompts (Artero et al., Reference Artero2008). Furthermore, one study used the SMMSE to assess MCI (McCabe et al., Reference McCabe2006). The other tools used to assess MCI were the MEC (n = 1) (Ros et al., Reference Ros2011) and the Six-Item Screen (Boyle et al., Reference Boyle2011).
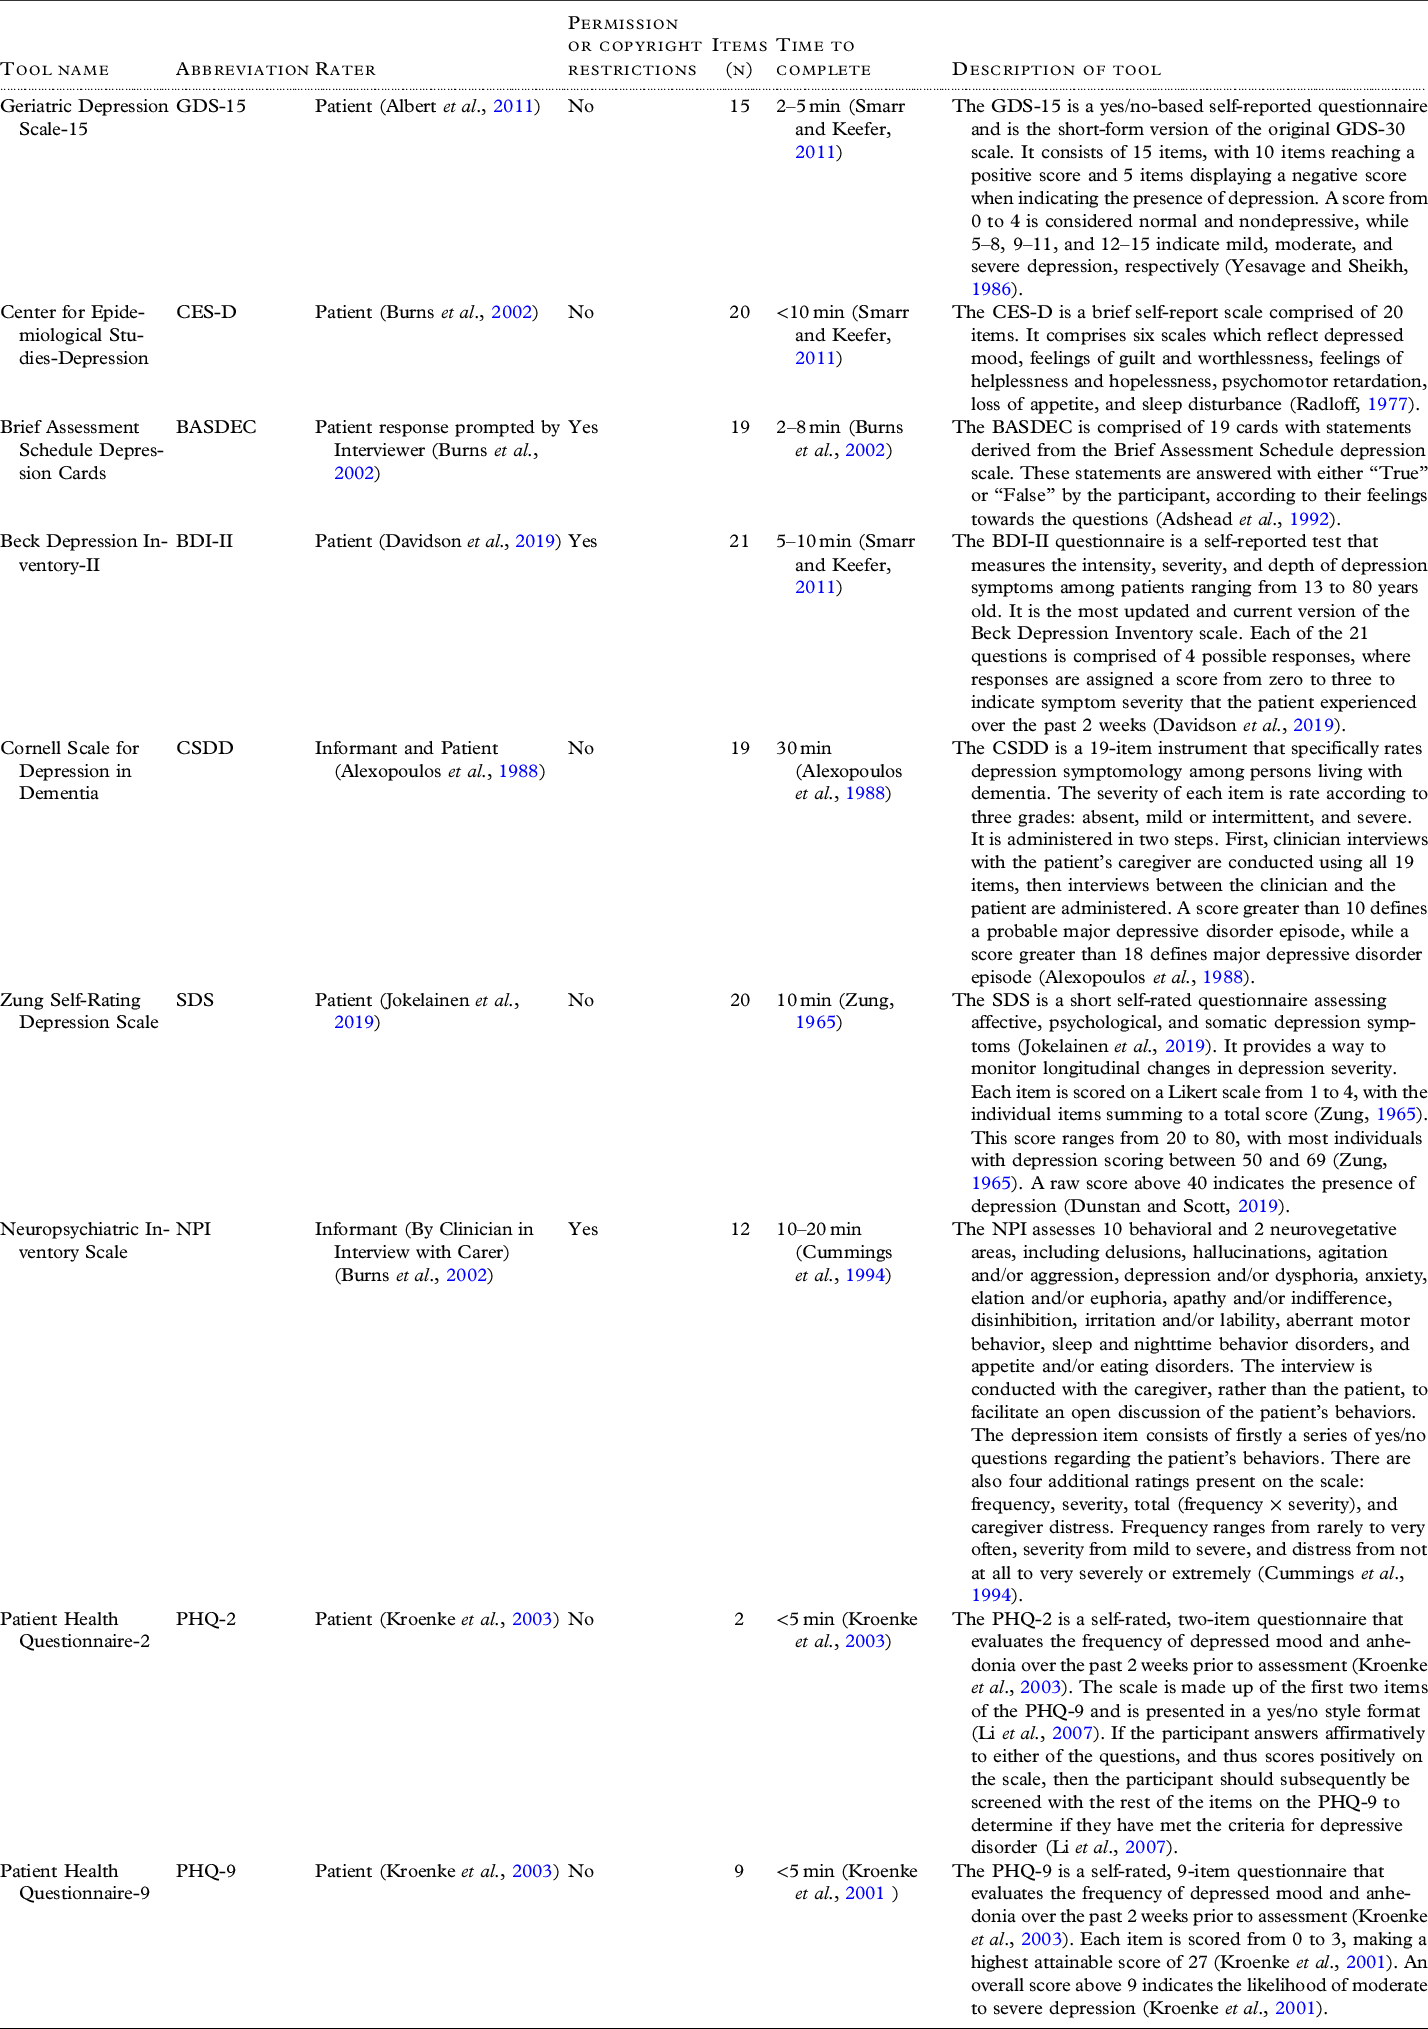
The depression tools evaluated in the included studies are the Geriatric Depression Scale (GDS-15) (n = 2) (Dierckx et al., Reference Dierckx2007; McCabe et al., Reference McCabe2006), Center for Epidemiological Studies-Depression (CES-D) (n = 2) (Artero et al., Reference Artero2008; Ros et al., Reference Ros2011), Brief Assessment Schedule Depression Cards (BASDEC) (n = 1) (McCabe et al., Reference McCabe2006), Beck Depression Inventory-II (BDI-II) (n = 1) (McCabe et al., Reference McCabe2006), Cornell Scale for Depression in Dementia (CSDD) (n = 1) (McCabe et al., Reference McCabe2006), Zung Self-Rating Depression Scale (SDS) (n = 1) (McCabe et al., Reference McCabe2006), the depression domain of the Neuropsychiatric Inventory (NPI) (n = 1) (Di Iulio et al., Reference Di Iulio2010), and the Patient Health Questionnaire-2 and 9 (n = 1) (Boyle et al., Reference Boyle2011). Descriptions of each tool are shown in Table 2.
Descriptions of each tool assessed in the included studies
Risk of bias assessment
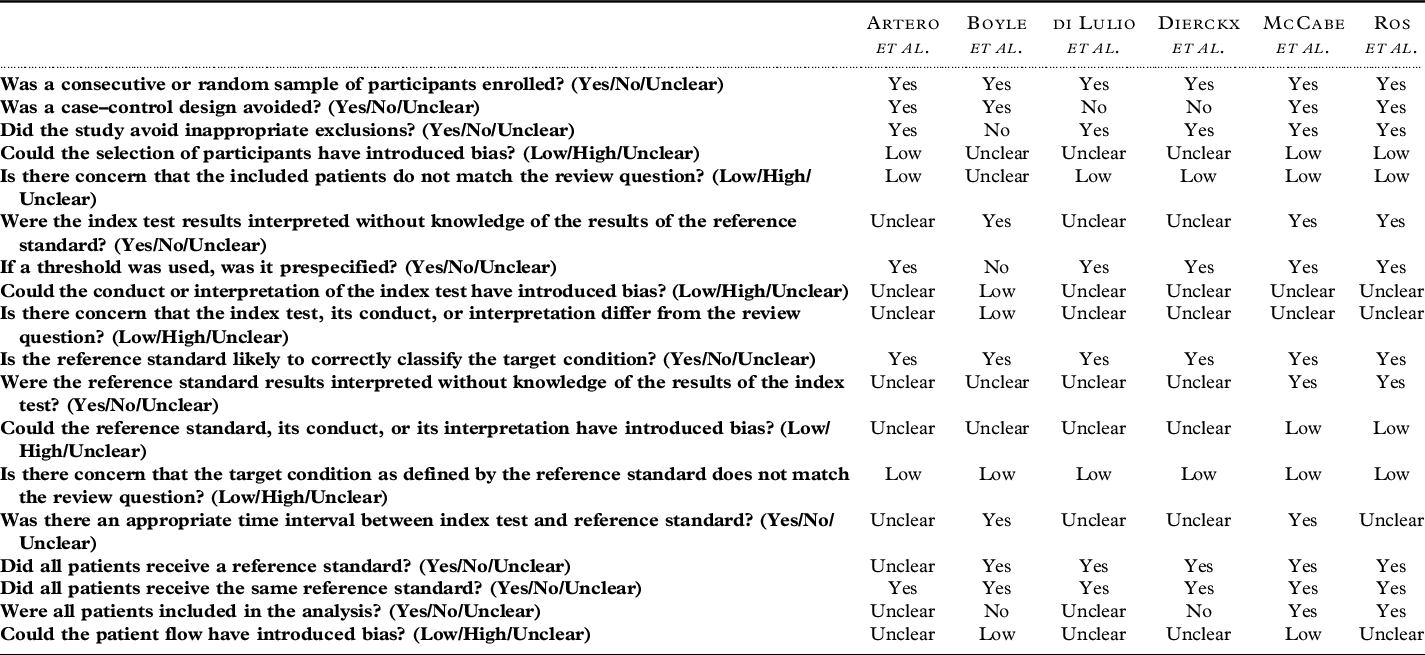
The risk of bias assessment is shown in Table 3. Most studies (n = 5) had a low risk that the included patients did not match the review question (Artero et al., Reference Artero2008; Di Iulio et al., Reference Di Iulio2010; Dierckx et al., Reference Dierckx2007; McCabe et al., Reference McCabe2006; Ros et al., Reference Ros2011). Multiple studies (n = 3) did not report if administrators of the index test were blind to the reference standard (Artero et al., Reference Artero2008; Di Iulio et al., Reference Di Iulio2010; Dierckx et al., Reference Dierckx2007). It was unclear in several studies (n = 4) if the reference standard was interpreted without knowledge of the index test (Artero et al., Reference Artero2008; Boyle et al., Reference Boyle2011; Di Iulio et al., Reference Di Iulio2010; Dierckx et al., Reference Dierckx2007). As a result, it was unclear whether administrators were blinded in either direction. Furthermore, multiple studies (n = 4) did not report a time interval between the index test and the reference standard (Artero et al., Reference Artero2008; Di Iulio et al., Reference Di Iulio2010; Dierckx et al., Reference Dierckx2007; Ros et al., Reference Ros2011). The flow and timing among studies were generally unclear. Overall included articles did not report blinding of reference standard and index test, and timing between tools clearly. This indicates that some of the included articles had some risk of bias which could affect the accuracy of the tools.
The QUADAS-2 risk of bias assessment for all included studies (n = 6)
Diagnostic accuracy of tools in included studies
Studies with MCI diagnosis as per Petersen or NIA-AA criteria
Prevalence. Each study had a unique prevalence of depression among MCI participants. Sample sizes in the MCI subgroups ranged from 37 to 1,626 MCI participants, with depression prevalence ranging from 3.1% to 51% as defined by the reference standard (Artero et al., Reference Artero2008; Di Iulio et al., Reference Di Iulio2010; McCabe et al., Reference McCabe2006; Ros et al., Reference Ros2011). Moreover, one included study did not report their depression prevalence rates as defined by the reference standard (Dierckx et al., Reference Dierckx2007).
GDS-15. There were two studies evaluating the diagnostic accuracy of the GDS-15 tool (Dierckx et al., Reference Dierckx2007; McCabe et al., Reference McCabe2006). Sensitivity measures ranged from 58% to 100% whilst specificity ranged from 85% to 92%. The highest PLR reported was 12.50, while the lowest NLR was 0. All three studies used a reference standard consisting of a clinical diagnosis based on DSM-IV criteria, administered by a physician.
BASDEC, BDI-II, CSDD, SDS. One study evaluated the diagnostic accuracy of the BASDEC, BDI-II, CSDD, and SDS tools (McCabe et al., Reference McCabe2006). The reported sensitivity was 100% across all tools, while the corresponding specificities were 86% (BASDEC), 92% (BDI-II), 94% (CSDD), and 82% (SDS) (McCabe et al., Reference McCabe2006). The reference standard used was a semistructured clinical diagnostic interview for DSM-IV (SCID-I) administered by a clinical psychologist and reviewed in consultation with a geropsychiatrist.
CES-D. Two studies reported on the diagnostic accuracy of the CES-D tool (Artero et al., Reference Artero2008; Ros et al., Reference Ros2011). Sensitivity values ranged from 86.25% to 84% while specificity ranged from 81% to 72.37%. Structured interviews with a physician using DSM-IV and ICD-10 criteria were used as reference standards.
NPI. One study evaluated the diagnostic accuracy of the NPI tool (Di Iulio et al., Reference Di Iulio2010). A sensitivity of 100% and a specificity of 56.96% were reported for the depression domain of the NPI, compared to a structured interview with a clinician as a reference standard. PLR and NLR values were 2.32 and 0, respectively.
Studies discussing “mild cognitive impairment” but not diagnosed by criteria
One included article stated they examined individuals with MCI but did not specify whether diagnoses were made based on specific criteria (Boyle et al., Reference Boyle2011).
Boyle et al. (Reference Boyle2011) measured the PHQ-2 and PHQ-9 for diagnostic accuracy in a population of persons living with general cognitive impairment (Boyle et al., Reference Boyle2011). The reference standard comparison was the Structured Clinical Interview for DSM-IV Psychiatric Disorders (SCID). An optimal cutoff of ≥3 and ≥10 were found for the PHQ-2 and PHQ-9, respectively (Boyle et al., Reference Boyle2011). For the PHQ-2, the sensitivity and specificity were reported as 78% and 74%, respectively (Boyle et al., Reference Boyle2011). The sensitivity of the PHQ-9 was 89%, while the specificity was 71% (Boyle et al., Reference Boyle2011). The values of other diagnostic accuracy measures obtained are recorded in Table 1.
Discussion
We were able to identify five articles reporting the diagnostic accuracy of various depression tools within a defined MCI population (Artero et al., Reference Artero2008; Di Iulio et al., Reference Di Iulio2010; Dierckx et al., Reference Dierckx2007; McCabe et al., Reference McCabe2006; Ros et al., Reference Ros2011), while one study by Boyle et al. (Reference Boyle2011) validated two tools using a broader definition of MCI (Boyle et al., Reference Boyle2011).
Seven tools were self-rated by patients (GDS-15 (Yesavage and Sheikh, Reference Yesavage and Sheikh1986), CES-D (Radloff, Reference Radloff1977), BASDEC (Burns et al., Reference Burns, Lawlor and Craig2002), BDI-II, SDS (Jokelainen et al., Reference Jokelainen2019), PHQ-2 (Kroenke et al., Reference Kroenke, Spitzer and Williams2003), PHQ-9 (Kroenke et al., Reference Kroenke, Spitzer and Williams2003), one was a caregiver and/or informant-rated scale (NPI) (Burns et al., Reference Burns, Lawlor and Craig2002), and the CSDD was both informant and patient-rated (Conradsson et al., Reference Conradsson2013) (Table 2). Moreover, we focused on the NPI as a tool to identify depressive symptoms, via its depression domain.
Currently, there is insufficient evidence to conclude which depression tool is most accurate within the context of MCI. Moreover, certain tools are not yet validated in the MCI population, such as the Hamilton Depression Rating Scale (HAM-D). At this time, the tool reported with the best balance and highest sensitivity and specificity was the CSDD by McCabe et al. (Reference McCabe2006), with a sensitivity of 100% and a specificity of 94% (McCabe et al., Reference McCabe2006). A sensitivity of 100% was also reported for the BASDEC, BDI-II, SDS, and the depression domain of the NPI (Di Iulio et al., Reference Di Iulio2010; McCabe et al., Reference McCabe2006), but specificity varied.
The CSDD was designed for the detection of depressive symptoms in persons with dementia and incorporates mood, physical symptoms, and collateral history (Alexopoulos et al., Reference Alexopoulos1988). The CSDD has previously been reported as a useful tool in the cognitively impaired population with high accuracy in persons with dementia (Goodarzi et al., Reference Goodarzi2016). The CSDD does take more time to complete; however, in practice, this has been reasonable to implement, given that prior implementation has shown to be effective (Goodarzi and Watt, Reference Goodarzi and Watt2020). As such, the CSDD may be reasonable to use in clinics with a high proportion of persons with MCI; however, given the limited amount of literature, additional testing must be done to support this inference and determine whether the same accuracy is seen in the context of MCI as in dementia.
The GDS-15, which is commonly used in older adults, is based solely on the patients’ responses (Yesavage and Sheikh, Reference Yesavage and Sheikh1986). There were two studies reporting on the accuracy of the GDS-15 tool (Dierckx et al., Reference Dierckx2007; McCabe et al., Reference McCabe2006); however, there was a significant range in the reported sensitivity from 58% to 100%. McCabe et al. (Reference McCabe2006) reported the highest sensitivity (100%) when administered with a cutoff of 6 (Dierckx et al., Reference Dierckx2007). More testing should be done to determine which diagnostic accuracy measures and cutoff point of the GDS-15 are most clinically relevant to the MCI population.
Limitations
Despite an exhaustive search, there were very few diagnostic accuracy studies identified that assess depression tools among persons living with MCI. Many studies used a depression tool but did not validate them, thus (n = 275) were excluded due to a lack of a reference standard or missing diagnostic accuracy outcomes (n = 73). Many studies evaluated a depression tool among the general geriatric population but did not include MCI as a subgroup.
The included studies varied in how they defined MCI, and most did not specify the MCI subtype (e.g. amnestic or non-amnestic impairment) (Artero et al., Reference Artero2008; Boyle et al., Reference Boyle2011; Dierckx et al., Reference Dierckx2007; McCabe et al., Reference McCabe2006; Ros et al., Reference Ros2011). As such, we lack evidence for validation of depression tools among different MCI subtypes or pathologies.
The risk of bias of included studies varied. Studies poorly described blinding of the index tests from reference standards, and similarly it was not clear what the interval was between measures. Both of these aspects can impact the study’s precision at determining the index test’s diagnostic accuracy. Accordingly, these unreported measures could have impacted the findings of our study.
The prevalence of depression was reported across studies. Despite having similar reference standards, the prevalence ranged from 3.1% to 51% (Artero et al., Reference Artero2008; Di Iulio et al., Reference Di Iulio2010; McCabe et al., Reference McCabe2006; Ros et al., Reference Ros2011). This range could be reflective of how studies examine different clinical care settings, variation in patient recruitment, or potential differences in MCI subtypes. For instance, Ismail et al. (Reference Ismail2017) reported that the prevalence of depression in patients with MCI was 25% in community-based samples, compared to 42% in clinic-based samples (Ismail et al., Reference Ismail2017). One proposed reason for this difference is that persons with depression are more likely to present to clinicians compared with non-depressed individuals, resulting in a higher reported prevalence of depression in a clinical population (Ismail et al., Reference Ismail2017).
The included reference standards were a clinician’s diagnosis, or any diagnosis of depression from any version of the DSM or ICD (The ICD-10 Classification of Mental and Behavioural Disorders, 1992). Amongst all studies, no collateral component was featured as part of the reference standard. As such, the reference standards are seen as patient-reported approaches to diagnosis. However, certain scales (i.e. CSDD (Radloff, Reference Radloff1977) and NPI (Cummings et al., Reference Cummings1994)) were completely or partially informant-rated scales (Table 2). There thus might be a discrepancy when using the reference standard to assess the diagnostic accuracy of informant-rated scales.
Our study has several strengths. We followed all PRISMA checklist and Cochrane methods for systematic reviews (Moher et al., Reference Moher2015). A gray literature search was conducted alongside the database search to exhaust the search further. However, despite conducting an exhaustive search, it is possible that we could have missed literature that could impacted the results of our study.
Future Directions
Given the current lack of literature, more research must be done to evaluate the diagnostic accuracy of common depression tools in the context of MCI. The HAM-D is a commonly used tool used among persons with neurodegenerative disorders and is often considered the gold standard of observer-rated depression rating scales (Burke et al., Reference Burke2019). However, there is a lack of literature characterizing its accuracy amongst persons with MCI. Therefore, future research may target the HAM-D amid other important tools (i.e. CSDD, GDS, and so forth) for more rigorous evaluation of diagnostic accuracy.
Future studies examining accuracy of depression tools in persons with MCI should ensure clear criteria are used to identify the diagnosis of MCI, as well as the specific subtype of MCI symptoms, and report the blinding of the index tool to reference standard. Given the findings of our review, future work should examine the use of tools such as the CSDD in the MCI population to corroborate the above findings.
Conclusion
There are few tools validated to evaluate depressive symptoms in individuals with MCI. The CSDD was reported to have a high sensitivity and specificity, whilst several other tools (i.e. BASDEC, BDI-II, SDS, and the depression domain of the NPI) reported high sensitivity but variable specificity. Additional research is needed to make a more rigorous conclusion on which tools are the most accurate at depression detection.
Acknowledgements
This project was funded by the Strategic Clinical Network (SCN) Summer Studentship Award as part of Alberta Health Services (AHS). We would also like to give a special thanks to librarian Lorraine Toews at the University of Calgary for assisting us with developing the search strategy.
Conflict of interest
BW has received funding via the Strategic Clinical Network (SCN) Summer Studentship Award with Alberta Health Services. ZG holds independent peer-reviewed project funding from the Canadian Institutes of Health Research (CIHR), Brenda Strafford Foundation, Hotchkiss Brain Institute (HBI), and O’Brien Institute of Public Health at the University of Calgary. ZI holds voluntary positions as Chair of the Canadian Conference on Dementia, and the Canadian Consensus Conference on the Diagnosis and Treatment of Dementia, but no conflict of interests are associated with either position.
Author contributions
Britney Wong was responsible for developing the search strategy and was a main abstract and full-text screener. She also wrote the manuscript. Zahinoor Ismail was responsible for abstract and full-text screening in duplicate with Britney Wong and provided edits to the manuscript. Zahra Goodarzi was responsible for developing the search strategy, screened abstracts and full texts in duplicate with Britney Wong, and provided edits to the manuscript.
Supplementary material
To view supplementary material for this article, please visit https://doi.org/10.1017/S1041610222000175




 Open access

