


In 2005, the conservative Anglican network ‘Global South’ held one of their meetings in Egypt. The opening words of their press communiqué affirmed that ‘103 delegates of 20 provinces in the Global South (comprising Africa, South East Asia, West Indies and South America), representing approximately two-thirds of the Anglican Communion, met for the 3rd Global South to South Encounter’.Footnote 2 A significant feature in this statement was its reference to their numeric strength, a recurring feature in their communications.Footnote 3 Five years later, at the GSE4 gathering, held in Singapore, the reference to numeric significance took a new and bolder dimension. The second paragraph of the communiqué affirmed:
Grateful for the gracious guidance of the Holy Spirit a total of 130 delegates from 20 provinces in the Global South (comprising Africa, West Indies, Asia and South America) gathered together. We represented the vast majority of the active membership of the Anglican Communion.Footnote 4
This statement is significant for at least three reasons. First, because it lists South America as a homogeneous unit, ignoring the fact that the numerically largest South American Anglican province, Brazil, is not part of the Global South.Footnote 5 Secondly, because it no longer affirmed that they represented a percentage of the Communion, but rather ‘the vast majority’. And thirdly, because it made a reference to ‘active membership’ of the Anglican Communion, in contrast to ‘nominal’ Anglicans. The latter point was directed toward the Church of England, which claims a membership of 26 million Anglicans, about a third of the Communion. In 2013, the Nairobi Global Anglican Future Conference (GAFCON), opened its communiqué with a similar reference to numbers:
We, the participants in the second Global Anglican Future Conference (GAFCON) – 1358 delegates, including 331 bishops, 482 other clergy and 545 laity from 38 countries representing tens of millions of faithful Anglicans worldwide – send you greetings from East Africa, a place of revival in the last century and of growth in the Anglican Church today.Footnote 6
Here, in addition to a reference to numeric strength, there is a reference to current numeric growth. The message is clear: Global South Anglicans represent not just the majority of Anglicans in the world, but also the growing churches of the Communion. These two elements have become a central part of conservative Anglican discourse. One of the implications of this emphasis is that there has been a demographic shift from North to South.
This focus on numbers has another dimension. There is a widespread interest, especially among some conservative American and British Anglicans, to offer an alternative reading of the Anglican Communion membership.Footnote 7 In this alternative reading, the official Church of England figures are dismissed as overinflated, the membership numbers offered by other putative liberal churches (like TEC or Brazil) are questioned, and the rest of the figures from the Anglican Communion, especially those from Africa, are accepted uncritically and unquestioningly. The figures resulting from their ‘recounting’ of the Anglican Communion deserve no serious attention. They are neither methodologically consistent nor statistically rigorous. The significant thing here is that numbers are used, at least on a global scale, as a key element in identity definition.Footnote 8 One might argue that numbers take a more prominent role than theology or even ecclesiology. In this rhetoric, numeric growth becomes a measurable scale of success for self-identified ‘orthodox Anglicans’ that, in turn, serves to reinforce and to validate their views.
Painting by Numbers
It seems that one cannot paint an accurate and up-to-date picture of the Anglican Communion without a reference to numbers. According to official Anglican Communion figures the estimated number of Anglicans in the world today is about 80 million. However, this figure needs to be qualified. The actual number of Anglicans is extremely difficult to know for a number of reasons. There are problems in accessing the data, in the reliability of the figures and in the sources. For instance, the Anglican Communion Office only has up-to-date statistical information from 6 of the 38 provinces.Footnote 9 And the membership details in official provincial websites are patchy.
In addition to the difficulties raised above, there are more complex issues to do with how Anglicans count their membership and who gets counted. Whereas in the Roman Catholic Church, membership is consistently counted by the numbers of baptized members, Anglicans around the world, as David Hamid points out, ‘do not even have a common understanding of what constitutes membership’.Footnote 10 For some it is baptism or confirmation, for others, as in North America, it is communicants in good standing or being registered in the parish electoral rolls. In Africa, membership is often connected with tribal affiliation.Footnote 11
The other difficult question is ‘who gets counted’. Of the 38 Anglican Communion provinces, 4 are ‘United Churches’. That is, ecumenical provinces in which different Protestant denominations, including Anglicans, joined together to become a single or united Church. This is the case of the United Churches of South India, North India, Pakistan and Bangladesh, which together have an estimated joint membership of over 4 million. Anglicans tend to include these 4 million in their figures; however, these churches are also affiliated to other international bodies, such as the World Methodist Council and the World Communion of Reformed Churches. The overt danger here of double, or even triple counting, is obvious.Footnote 12
Finally, as pointed out above, there is the issue of a new, broadly accepted, and generally unquestioned narrative of global growth/decline.Footnote 13 This narrative tells a story of Anglicanism’s success being largely due to its growth in developing, postcolonial nations. According to this story, Anglicans in Africa, Asia, and to a lesser extent Latin America, have experienced dramatic growth over the last few decades. A growth that, according to the narrators, is ongoing and unstoppable. At the same time, first-world, mostly postmodern nations have seen a steep decline in church membership and attendance. There has therefore been a shift of perceived ‘presence’, that is, a shift in the number of Anglicans present in each part of the world. This, in turn, has led to questions of who defines identity, how identity is defined and who decides what is Anglican and what is not.Footnote 14 The implications of this narrative for contemporary Anglican identity are clear. This perceived shift of presence has naturally led to a shift of power in the Communion, from the historic Anglo-Saxon ‘founding members’ present at the first Lambeth Conference of 1867, to the new putative majority of current members from the ‘Global South’. According to this narrative, numbers play a key role as identity shapers, and give Global South members a new moral authority in the Communion. Michael Doe warned about the challenges posed by this postcolonial dynamic when he affirmed that:
There is a disturbing tone in some of the statements from churches [from the Global South], which, partly because they are growing at a time when religion in the North may be more in decline, claim some superior authority to truth and to leadership of the Communion.Footnote 15
For every narrative, however, there is a counter-narrative. The counter-narrative I propose here is based on doctoral research into contemporary Anglican identity.Footnote 16 This counter-narrative accepts the overall story, but it qualifies it. It says that whilst it is true that most of the growth of recent decades has taken place in parts of Africa and Asia, there is anecdotal evidence that this growth has reached a plateau and in some cases has turned into decline, in certain parts of Africa.
In the case of Kenya, a recent survey on church attendance in the countryFootnote 17 has shown that the trend among Protestant churches is of a steady decline, especially among young people (under 24). The survey had the remit to ‘establish the number, size and location of existing Protestant churches in Kenya’,Footnote 18 including Anglicans. The findings showed that while in the capital city, Nairobi, the average church attendance was 16 per cent of the self-identified Protestant population, the national average was only 7 per cent.
In Uganda, too, the national trend among Anglican churches, based on anecdotal evidence, seems to be one of decline, rather than growth. This was pointed out by Archbishop Orombi at his installation as archbishop of the province of Uganda in 2004, when he recognized as one of the challenges facing Ugandan Anglicans, ‘the loss of spiritual direction’. For Orombi, among the signs of this loss of spiritual direction were that ‘many of our Christians have gone away from practical Christianity’, and that there has been a growth in ‘church attendance by convenience, i.e. Christmas, Easter, Funerals, Weddings only’.Footnote 19 This is also echoed by the bishop of the diocese of West Buganda, who affirms that, ‘[c]urrently the population of the Diocese is over 2 million people, of whom about 35% are baptized Anglicans. The sprouting Pentecostal churches, however, have greatly encroached on our congregational numbers.’Footnote 20 This reference is particularly interesting for it explains decline, not on the basis of social change, but on the grounds of inter-denominational competition.
The other part of this narrative comes from the West. While it is true that Anglican churches in Western nations have experienced a steady decline during the second half of the twentieth century, there are signs that this trend may have changed in the first decade of the twenty-first century. Decline has slowed significantly and in some cases, like England, it has reached a plateau in the last decade. According to research commissioned by the Archbishops’ Council, 73 per cent of churches in England have either remained stable or grown in the decade leading to 2010, with 27 per cent of churches declining.Footnote 21
Despite the above, the more fundamental question remains unanswered: how many Anglicans are there in the world today? Apart from the official figure of 80 million Anglicans, which remains largely unchallenged, very few people have offered alternative numbers. In 1997, Peter Brierly offered a figure of just over 53 million Anglicans, at a time when the widely accepted membership of the Communion was thought to be 70 million.Footnote 22 David Hamid, in his essay on ‘The Nature and Shape of the Contemporary Anglican Communion’, drew from official figures in 2001, and concluded that there were about 76 million Anglicans worldwide.Footnote 23 In both cases, the methodology employed for data gathering did not differentiate between methods of counting in the official figures. The end results were always mixed, and gave an inconsistent view of the membership of the Communion.
In order to clarify the above, in 2014, I carried out research into the membership of the Anglican Communion, distinguishing between two types of membership: outer and inner circles. I followed here Peter Brierly, the leading statistician of the British organization Christian Research. Brierly’s distinction between these two types of membership is a helpful way to analyze current demographics of the Anglican Communion.Footnote 24 The two types of membership are defined as follows:
∙ Outer circle membership: those who identify themselves as Anglican, either through national census or general affiliation. This group includes both, those who are active church members and those who are not actively involved in their local churches.
∙ Inner circle membership: those who are active church members. Brierly distinguishes between two distinct yet overlapping inner circles: one formed by those who are church members and one representing church attendees.Footnote 25 For clarity and simplicity, I have merged these two into one single inner circle group that includes both membership criteria: (a) regular church attendance,Footnote 26 that is, not those who only attend occasional offices (e.g. baptisms, weddings and funerals) and/or ‘high days’ (e.g. Christmas and Easter); and (b) registration in a local church electoral roll.Footnote 27
The research, therefore, tried to disentangle the mixed methods of counting across the Communion, by homogenizing the data into these two measurable categories. The outcome, however, remains an estimate. An informed approximation based on the latest available data and on the research methodology explained below. To my knowledge this is the first attempt to organize the data following this approach. The results paint two very different pictures with multi-layered implications.
Methodology
The research and data collection took place between May and August of 2014. All websites accessed as part of the research were active at the end of August that year, the date of completion of this research. The data gathering methodology employed would be best described as a ‘hybrid quantitative research method’. The following tools were used for data gathering and analysis:
(a) Enquiries directed to National Statistics/Census Bureaus in the countries where the Anglican Communion is present, to establish the overall number of self-identified Anglicans or the percentage of Anglicans in the population (outer circle membership).
(b) Enquiries directed to National/Provincial church offices, to establish up-to-date official membership figures and method of counting.
(c) Website data gathering and analysis (content-based), researching national, provincial, and diocesan websites to obtain official membership figures and method of counting.
(d) Website data gathering and analysis (photographic-based), researching diocesan and parish websites through photographic numeric analysis to establish average parish church membership.
Where it was not possible to establish reliable inner and outer circle membership data from official sources, a contextualized projection method was used. Based on the data extracted from the above (especially [c] and [d]), I made a series of projections to estimate inner circle membership. The projections were estimated applying one of the following two methods:
(a) Hybrid quantitative national projections, based on the results obtained from the case studies described below. These projections were the result of multiplying the estimated average size local church (X) by the number of local churches (parishes) in a country/province (Y), resulting in an estimated inner circle membership for that national/provincial church (Z). So, X * Y = Z.
(b) Average attendance national projection: this projection is established by multiplying the outer circle membership of the national church (A), by the average percentage of national church attendance (B), resulting in an estimated inner circle membership for that national/provincial church (C). So, A * B% = C.
Research Summary
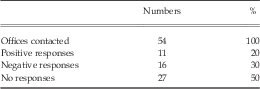
The research focused on 34 of the 38 provinces. Given the numerical complexities, the four united churches from India, Pakistan and Bangladesh were not included.Footnote 28Table 1 shows a summary of the national census offices contacted and the responses received.
National census offices contacted and responses
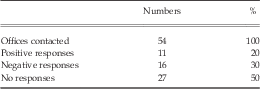
The following countries responded with the requested data (positive responses): Australia, Canada, Eire (Republic of Ireland), Jamaica, Mauritius, New Zealand, Northern Ireland, Philippines, Scotland, Seychelles and the USA. The following countries responded but were not able to offer the information requested: Argentina, Brazil, Chile, Costa Rica, England, Ghana, Hong Kong, Japan, Jordan, Korea, Malaysia, Rwanda, Singapore, South Africa, Tanzania and Zambia.
The following countries did not respond: Angola, Barbados, Bahamas, Botswana, Burundi, Congo, Cyprus, Ethiopia, Guatemala, Nicaragua, Madagascar, Malawi, Israel, Melanesia, Mexico, Mozambique, Myanmar, Namibia, Nigeria, Panama, Papua New Guinea, El Salvador, Sierra Leone, South Sudan, Trinidad and Tobago, Wales, Zimbabwe.
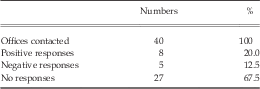
Table 2 shows a summary of the provincial/national church offices contacted and the responses received.Footnote 29
National church offices contacted and responses
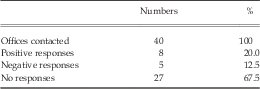
The following national/provincial churches responded with the requested data (positive responses): Church of Ireland, Church of England, Scottish Episcopal Church, The Episcopal Church (USA), Anglican Church of Canada, Anglican Church of Aotearoa New Zealand and Polynesia, Anglican Province of Southern Africa, and Igreja Anglicana Episcopal do Brasil. The following national/provincial churches responded but were unable or unwilling to offer the data requested: Bolivia (Southern Cone), Congo, Kenya, South Sudan, Trinidad and Tobago (West Indies). The rest of the provinces did not respond.
In addition to the provinces, I contacted the Lambeth-based Anglican Communion Office. They responded: ‘I’m afraid there are very few statistics regarding the Anglican Communion. Membership figures are almost impossible to pin down because Churches measure them in different ways.’Footnote 30
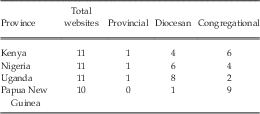
Table 3 shows a summary of four case studies of provincial churches, including the total number of websites analysed per church, and how many of these were provincial, diocesan, or congregational.
Summary of web-based church membership analysis
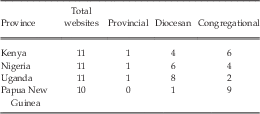
The website analysis sought to establish estimated inner circle membership figures for both local and national churches, through (a) content analysis and (b) photographic analysis. The content analysis focused on the statistical information provided by dioceses and official provincial sources. Of the four case studies, the three African churches provided sufficient membership data in their diocesan websites. This data, however, was not always easily accessible and, in most cases, required extensive and time-consuming digging in archival and synod reports. In the case of Papua New Guinea, official membership information was only available from the Anglican Communion website.
The photographic analysis was used as a contrasting and/or corroborating tool, alongside the web-content analysis. It focused on counting numbers of people attending services using the photographic galleries available. This type of analysis has some significant limitations. First of all, they are limited by the quality and resolution of the pictures, which can make the counting difficult. Secondly, in some cases the pictures only offer partial views of the churches, leaving sections of the congregation outside the photograph. Thirdly, they only provide, literally, snapshots of the life of an actual congregation at particular events. Fourthly, very often these pictures are not representative of their regular congregation size because they reflect ‘big events’ (baptisms, confirmations, mothers’ union celebrations, etc.). In this respect, the estimated figures may be overinflated. Finally, in the African context, only successful urban churches possess the resources to have an active website. These tend to be larger and wealthier churches, very different from the smaller rural counterparts. Again, these may not be representative of the whole. In all cases, I have offered a generous rather than conservative estimate.
Despite these limitations, in three of the four cases, the photographic analysis corroborated the web-content analysis results (Kenya, Nigeria, Uganda). In one case, the photographic analysis showed serious discrepancies with the official figures (Papua New Guinea). In order to illustrate how case studies were conducted, I offer a summary of the three African churches analysed.
Kenya
The official membership figures of the Anglican Church of Kenya are difficult to ascertain. In their provincial website they state over 5 million members in the country.Footnote 31 There is, however, no description of how membership is counted. When asked for this information, the central office of the Anglican Church of Kenya responded with a short email, requesting further clarification about the research, and showing reluctance to offer any information. I received no response to my follow-up clarification response.
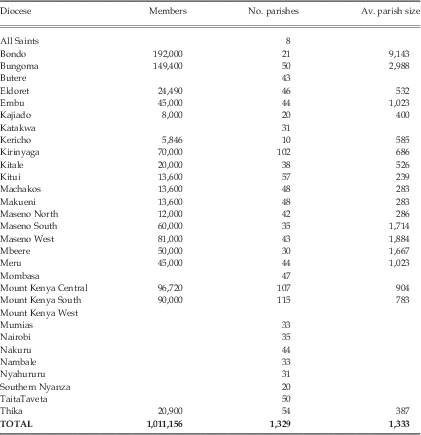
If you carry out a diocese by diocese membership count, official figures look very different. All 31 dioceses listed on the Anglican Church of Kenya website provide the number of parishes within each diocese. Eighteen of them provide, in addition, diocesan membership figures.Footnote 32 See Table 4.
Summary of Anglican Church of Kenya membership

The figures in Table 4 give us the following average results:
∙ Average membership per diocese: 55,366
∙ Average membership of each parish: 1,333
If we were to extrapolate these official figures to the rest of the Anglican Church of Kenya, we would obtain the following results:
∙ Total membership extrapolating diocesan average (55,366*31) = 1,627,591
∙ Total membership extrapolating parish size average (1,333*1,339) = 1,772,125
Whichever extrapolation criteria we use, the discrepancy between the official figures is significant. The projected estimates drawn from the diocesan data provided show an overall membership of about a third of the official 5 million given by the province. If compared with the official figure given by the 2004 Church of England Year Book of 2.5 million Anglicans in Kenya,Footnote 33 the current estimate is about 800,000 lower.
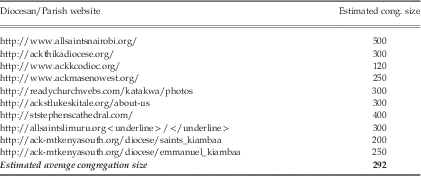
The second stage of the research was to ascertain whether the average parish size figure (1,333), resulting from dividing the overall number of Anglicans into the number of parishes, reflected the inner or the outer circle membership of the local church. A photographic analysis of ten parish and diocesan websites was carried out, estimating congregational attendance from the images provided. Table 5 shows the results.
Summary of web-based photographic analysis of Anglican Church of Kenya
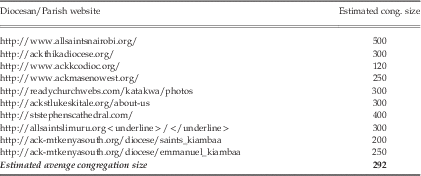
When contrasting the average parish membership figure (1,333) with the photographic evidence analysed above (292), at a first glance, it would seem reasonable to assume that (1) the higher official figure refers to the outer circle membership, and (2) the lower estimated figure is likely to reflect the inner circle. Both assumptions carry their own set of difficulties.
In the case of the official parish membership (1,333), this average figure is the result of what appears to be mixed inner and outer circle data. For example, some dioceses, like Kitui, Machakos, Makueni and Maseno North, all declare average parish membership of between 238 and 285, all of which are likely to be inner circle figures. In contrast, other dioceses, like Bungoma or Bondo, show figures of 3,000 and 9,000 average parish memberships respectively, more consistent with general outer circle statistics.Footnote 34 That there is no consistency in the method and criteria for counting membership should not surprise us. This is not unique to Kenya, but a systematic difficulty across the Anglican Communion. So, given that the estimated outer circle figure is based on a mixture of inner and outer circle counting methods, I propose here to take into account both sets of official figures, and to establish the average of the two as the outer circle estimate. Based on this formula the Anglican Church of Kenya would have an outer circle membership of ([1.7 + 5]/2 =) 3.3 million people.
On the other hand, the average figure resulting from the photographic analysis (292) is the best estimation based on a very limited sample. An initial projection of the inner circle membership, based on this figure, would result in an estimated 388,000 active Anglicans in Kenya, that is, just under 12 per cent of the estimated outer circle figure. This percentage, however, does not seem to reflect actual trends in the country.
As pointed out above, a recent survey on church attendance in Kenya has shown that the trend among Protestant churches is of a steady decline, with the national average reaching 7 per cent of the self-identified Christian population.Footnote 35 If we were to apply this figure to the outer circle estimate (3.3 million * 7%), the result would be of just under 231,000 active Anglicans. The average size of an Anglican parish in Kenya would be of 173 members. For the sake of methodological consistency, and to do justice to both sets of data, I will use both average size figures ([292+173]/2 =) 233, as the best average parish estimate. On the basis of this estimate, the inner circle membership of the Anglican Church of Kenya would be of just under 310,000 Anglicans, 9.3 per cent of the outer circle membership.
Nigeria
The Church of Nigeria (Anglican Communion) officially states 18 million members within the 14 provinces and 161 dioceses that form the national church.Footnote 36 There is no reference in the official national church website as to how the membership is counted and the national office of the Archbishop of all Nigeria did not respond to the request for clarification on this or any other point.
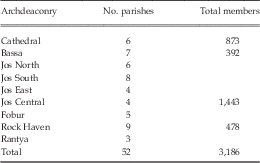
With the exception of the missionary diocese of Damaturu, which is not representative of the national church, Jos is the only diocese with publicly available membership data at the time of this research. According to the Jos Diocesan Synod report,Footnote 37 the total number of parishes across their nine archdeaconries was 52, with an average of just over five parishes per archdeaconry. Four of the nine archdeaconries provided valuable statistical data concerning the inner circle membership of each of its parishes based on the criteria of regular attendance. The results are shown in Table 6.
Summary of Diocese of Jos (Nigeria) membership
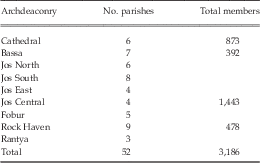
Although the above data is incomplete – only four of the nine archdeaconries have provided accurate membership information – it is possible to extrapolate the available data to estimate the average size of a parish church in the diocese. The figure resulting from dividing the available membership figure (3,186) by the number of churches who have provided this information (26), is 123. Therefore, the average size of a parish (inner circle) in the Jos diocese is 123 members.
If the Jos Diocese inner circle membership was representative of the entire country, the Church of Nigeria would have an estimated inner circle membership of (123 * 5,768 =) 709,464 Anglicans. The average regular church attendance of the Nigerian Anglican population would be approximately 4 per cent. However, extrapolating one set of diocesan statistics to all 161 dioceses in the country, on its own, is neither rigorous nor convincing. An added difficulty with Jos is that, although it is an established diocese in a largely Christian part of the country, the city has a history of recurring conflicts between Christians and Muslims. It is hard to know how much impact their social and religious context has on church membership. It is certainly much higher than the average size congregation of the missionary diocese of Damaturu, which is barely 35 members per church.Footnote 38
The photographic analysis conducted for Nigeria, based on 11 websites, showed an average congregation size of 272. This figure is about double the average congregational size of the Jos Diocese. If one were to use this estimate as a base of the total inner circle membership of the Church of Nigeria, the overall figure would be 1,568,896 Anglicans.
For the purpose of this study, and in order to do justice to both sets of data, I propose to use an average between the two ([123 + 272]/2 =) 197. This figure constitutes the estimated inner circle parish church membership in an average Nigerian Anglican church. When extrapolated to the whole country, the total inner circle membership of the national church is of 1,136,296 Anglicans, or 6.3 per cent of the outer circle.
Uganda
According to the National Census Bureau about 8 million Ugandans consider themselves Anglican. This represents about 20 per cent of the total population. It also reflects the outer circle membership of the church. To establish the inner circle membership I analysed both the data provided by diocesan websites,Footnote 39 regarding actual church attendance, and a random selection of ten diocesan and parish websites from across the country.
The result of this particular analysis is an average congregation size of 200 members. If we were to extrapolate this to estimate the inner circle membership of the national church, the following would be the result: 200 * 3,978 (parishes in the country)Footnote 40 = 795,600 members. This figure represents 9.9 per cent of the outer circle membership, a very similar percentage to the Church of Kenya (9.3 per cent) and slightly higher than the Church of Nigeria (6.3 per cent).
African Projections
In order to establish outer and inner circle figures across the rest of the African countries I used the following criteria. For the outer circle, I assumed that official figures provided by the national churches reflected this extended membership. This assumption was based on the fact that all of these figures, when divided by the number of churches, resulted in disproportionately high and unrealistic parish memberships of thousands rather than hundreds. These figures were also inconsistent with the inner circle averages estimated for the three African countries analysed above. Given that there is no way to contrast or verify the accuracy of the outer circle figures, I took these at face value, as in the rest of the Anglican Communion. I estimated the inner circle membership using the outer circle official figure as the starting point, and applying an ‘African Average Church Attendance’ (AACA) of 8.5 per cent.Footnote 41 The resulting projections yielded average congregation sizes consistent with the three analysed nations.
How Many Anglicans or the Myth of Numbers
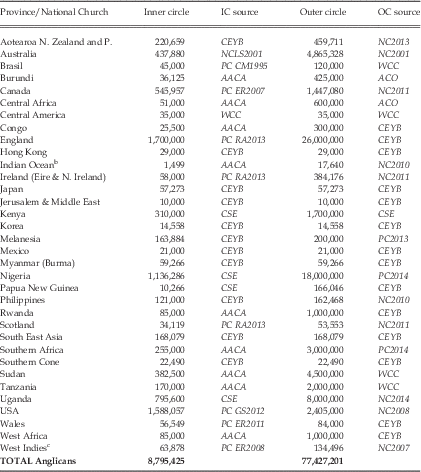
Table 7 summarizes the estimated inner and outer circle membership figures in the Anglican Communion drawn from this research. For outer circle statistics, where the official church figures are different from those provided by government census bureaus, the higher of the two has been adopted. For inner circle estimates, the criteria used were as follows: (a) official ‘active membership’ figures provided by national/provincial churches; and (b) projections based on outer circle figures and percentage estimates of average church attendance drawn from this research. In some cases, when the only available figure is inner circle, the same figure is used for the outer circle.Footnote 42
Summary of Anglican Communion inner and outer circle membershipFootnote a
a The sources listed here are: AACA: ‘African Average Church Attendance’ Projection; ACO: Anglican Communion Office (http://www.anglicancommunion.org/); CEYB: Church of England Year Book 2004 (London: Church House Publishing, 2004); CSE: Case Study Estimate based on the conclusions of this research paper; NC (Year): National Census (Year); NCLS: Survey conducted by Australia’s National Church Life Survey in 2001 (http://www.ncls.org.au/default.aspx?sitemapid =131); PC(Year): Provincial Church (Year); PC CM(Year): Provincial Church Confirmed Members (Year); PC ER(Year): Provincial Church Electoral Role (Year); PC RA(Year): Provincial Church Regular Church Attendance (Year); PC GS(Year): Provincial Church Communicants in Good Standing (Year); WCC: World Council of Churches (http://www.oikoumene.org/en).
b Outer circle figures are estimated based on the national census data provided by Mauritius (3,102) and the Seychelles (5,585), and extrapolated to the whole province.
c Both inner and outer circle figures are estimates based on Jamaican census and diocesan statistics, projected to the rest of the province on a population basis, where Jamaica represents 51 per cent of all the West Indies. See: http://www.anglicandiocesejamaica.com/content/aboutus/history.html (accessed 15 August 2014).
The first observation from the data in Table 7 is that the inner circle constitutes about 11 per cent of the outer circle membership. In other words, about one in ten Anglicans is an active member in their local church. What follows is an analysis of the data per continent, by culture and by alignment.
Membership Statistics by Continent
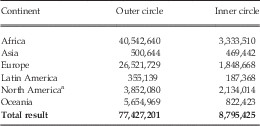
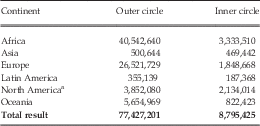
Table 8 shows both outer and inner circle membership by continents.
Summary of Anglican Communion membership by continent
a USA and Canada. It does not include Mexico, which is integrated into Latin America.
The proportion in the relationship between outer and inner circle is not the same in all continents. Europe and Africa represent the highest contrast between the two figures. In Europe, where the predominant national church is the Church of England, the inner circle represents 7 per cent of the outer membership. In Africa, the figure is similar, with just over 8 per cent of the outer circle membership being active members. In Asia the inner circle is about 90 per cent of the outer circle. This shows that their method of counting members is based on active membership. In North America and Latin America, the inner circle represents just over 50 per cent of the outer circle. Finally, in Oceania about 14 per cent of the outer circle are active members of the church.
The differences between outer and inner circle membership in a cross-continent comparative analysis are clearly depicted in Figure 1. The most striking difference in both graphs is the membership percentage of Africa in relation to the wider Communion. In the inner circle, Africa, while being the largest single group of Anglicans, loses its predominance. The second most striking element is the place of North America in each chart. While in the outer circle its numeric and proportional significance is very low, in the inner circle it represents a quarter of Anglicans worldwide.
Outer and inner circle membership by continent
Membership Statistics by Culture
Figure 2 shows the outer and inner circle membership classified into ‘cultures’. For the sake of simplicity, four cultural groups have been identified: (1) Africa; (2) Western (Europe, North America, Australia and New Zealand); (3) Asia and non-Western Oceania; and (4) Latin America.
Outer and inner circles by culture
According to the outer circle membership, there is a general split between Africa and the Western world, with the Africans representing just over half of the Communion, while Western Anglicans represent just under half. Asia and Latin America are numerically insignificant in the outer circle membership. In the inner circle the picture is very different. The Western section is by far the largest of the four, with more than half of the total. Africa is still a significant section, with over a third of the overall inner circle membership, and Asia and Latin America combined are nearly a tenth of the Anglican Communion.
Membership Statistics by Alignment
This is one of the most difficult exercises of this research. For the sake of simplicity I have distinguished here between Global South and Global (non-affiliated) Anglicanism. This is an artificial distinction that describes two distinct groups of Anglican Provinces around the debate on sexuality.
(1) Global South: those predominantly conservative provinces which have aligned together under the GAFCON umbrella to stand for what they describe as ‘orthodox Anglicanism’.
(2) Global (non-affiliated) Anglicanism: those provinces which are not aligned with the Global South. They often represent the full breadth of Anglican theological and ecclesiological diversity. While the Global South is an actual name adopted by the conservative provinces, Global (n.a.) Anglicanism does not exist as such, and it is not a homogeneous or organized group with a particular agenda. Figure 3 illustrates the geography of contemporary Anglicanism.
Anglican Communion world map by alignment
Figure 3 shows the provincial/national churches ecclesiological alignments. In the American continent, it includes the dioceses of the 9th Province of the USA Episcopal Church (Colombia, Dominican Republic, Ecuador, Honduras, Puerto Rico and Venezuela). In Europe, it includes the Church of England Diocese in Europe, which covers from Morocco to Vladivostok, and from Scandinavian countries to Turkey. In Asia, I have also included the United Churches of North India, South India, Pakistan and Bangladesh, which are not included in the statistical research.
Because the criteria here is ‘provinces’ or ‘national churches’, the map does not show those dioceses within a particular province which are not aligned with their province. The two most representative examples are Sydney diocese in Australia, firmly aligned with the Global South, and the diocese of Uruguay in the Southern Cone, theologically aligned to Global (n.a.) Anglicans. Neither does it show the North American groups that have aligned themselves with the GAFCON.
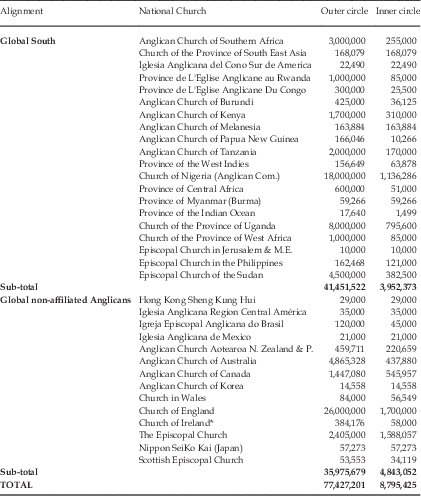
The case of South Africa is also significant, for although historically it has been theologically diverse and in some instances a liberal church, it chose, nevertheless, to align itself with the Global South. Table 9 shows the outer and inner circle memberships of the Anglican Communion by national church and alignment.
Summary of Anglican Communion membership by alignment
The figures in Table 9 are illustrated visually in Figure 4. They are analysed per continent and per culture. The figure shows the inner circle Global South and Global (n.a.) Anglican cross-continent distribution, by percentage.
Inner circle by continent and alignment
The most striking thing here is that, statistically and proportionately, the Global South is not a particularly global phenomenon. The overwhelming majority of its members are in Africa, with a small minority present in Asia, Oceania and Latin America. No provinces are represented from Europe and North America. In the case of Global (n.a.) Anglicanism, the predominant group is formed by the North American churches, followed by the European ones, Oceania and, in a small proportion, Asia and Latin America. Global (n.a.) Anglicanism is therefore overwhelmingly Western.
The total membership differences between Global South and Global (n.a.) Anglicanism are particularly noticeable when contrasting outer and inner circle statistics side by side. Figure 5 is based on the two sets of membership data by percentage (on left column).
Outer and inner circle by alignment
It is clear from the data in Figure 5 that (a) in the outer circle the Global South appears to be slightly larger; (b) in the inner circle the reverse is true, Global (n.a.) Anglicanism is the larger group; and (c) that in both cases, the percentage figures are reasonably close. Whichever membership counting method we use, the divide is real but also fairly even.
When we take into account the culture dimension, the results show that the most significant division in the Communion is between two principal cultural contexts: Western and African. The other cultures, while playing their part, numerically can only be described as minor players. The following graph shows both outer and inner circle results by alignment and culture groups, by percentage.
In Figure 6, whereas the outer circle figures seem to be fairly evenly divided between the two cultural groups, the inner circle offers a mixed picture. The overwhelmingly predominant culture in Global (n.a.) Anglicanism is Western, with only 2 per cent of members being in Latin America and Asia. In the Global South, the predominant cultural group is African with a small, but not insignificant percentage of Asian and non-Western Oceania Anglicans. Figure 7 shows the same data with absolute membership figures.
Outer and inner circles by alignment and culture (in percentages)
Outer and inner circles by alignment and culture (in numbers)
Conclusions
The statistical data shown in this paper seeks to offer an updated estimate of the membership of the Anglican Communion, based on a fundamental distinction between outer and inner circles’ memberships. The research has tried to disentangle the mixed methods of counting across the Communion, in order to homogenize the data into these two categories. The results show that, although the general direction in recent decades has been of a North to South demographic shift, currently the narrative is more accurately described as one of North and South. The demographic weight of both groups challenges the commonly accepted growth/decline narrative, and raises significant questions concerning how Anglicans can affirm both unity and diversity.