





Introduction
The crystalline ice plant, Cryophytum crystallinum L. (Aizoaceae) (formerly Mesembryanthemum crystallinum), is an annual or biennial herbaceous succulent indigenous to South Africa (Adams et al. Reference Adams, Nelson, Yamada, Chmara, Jensen, Bohnert and Griffiths1998; Moran Reference Moran1950; Olckers et al. Reference Olckers, Coetzee, Egli, Martin, Paterson, Sutton and Wood2021; Zaghloul et al. Reference Zaghloul, Soliman and Heikal2019). The species has been introduced to multiple regions around the world, both intentionally and unintentionally, and has become naturalized in the Mediterranean region, the United States, Mexico, Chile, the Caribbean, and Australia (Adams et al. Reference Adams, Nelson, Yamada, Chmara, Jensen, Bohnert and Griffiths1998; Olckers et al. Reference Olckers, Coetzee, Egli, Martin, Paterson, Sutton and Wood2021; Vivrette and Muller Reference Vivrette and Muller1977). Invasions of C. crystallinum have negatively affected biodiversity and ecosystem functioning in the coastal grasslands of California (Lara-Resendiz et al. Reference Lara-Resendiz, Galina-Tessaro, Sinervo, Miles, Valdez-Villavicencio, Valle-Jimenez and Méndez-de La Cruz2021; Vivrette and Muller Reference Vivrette and Muller1977), Australian pastures (Kloot Reference Kloot1983), and Egypt’s coastal deserts (El-Ghareeb Reference El-Ghareeb1991).
Cryophytum crystallinum plants have large epidermal bladder cells that accumulate salts absorbed from the soil. These highly concentrated salts leach out into the soil when the plant dies, making the environment uninhabitable to surrounding non-halophytic plant species. This process allows C. crystallinum to dominate the communities where it has invaded (De La Cruz et al. Reference De La Cruz, Salgado-Luarte, Stotz and Gianoli2023; Olckers et al. Reference Olckers, Coetzee, Egli, Martin, Paterson, Sutton and Wood2021). The plant reproduces both sexually and vegetatively, with trailing stems producing shallow fibrous roots wherever they come into contact with the soil (Woodward and Quinn Reference Woodward and Quinn2011). Each individual plant produces numerous fruits containing up to several hundred seeds (Woodward and Quinn Reference Woodward and Quinn2011). Seeds are dispersed primarily by mammals, including rodents, rabbits, and deer, with passage through the digestive tract aiding germination through scarification. Cryophytum crystallinum has a genome size of approximately 250 to 300 Mbp (2n = 18 chromosomes), although ploidy levels vary from 2N to 128N among different tissue types (Adams et al. Reference Adams, Nelson, Yamada, Chmara, Jensen, Bohnert and Griffiths1998).
Owing to C. crystallinum’s high stress and salt tolerance, it often invades arid regions with high levels of salinity and disturbance (Abd El-Gawad and Shehata Reference Abd El-Gawad and Shehata2014; De La Cruz et al. Reference De La Cruz, Salgado-Luarte, Stotz and Gianoli2023; Olckers et al. Reference Olckers, Coetzee, Egli, Martin, Paterson, Sutton and Wood2021). The species occurs in high densities in California, from Santa Barbara southward on the coast of mainland California. It is also found on all eight of the Channel Islands off the California coast and on both the mainland Baja California Peninsula and its islands on the western coast of Mexico (PJM, personal observation). It has been suggested that C. crystallinum was introduced to North America during the early Spanish settlement through a single introduction event (Moran Reference Moran1950).
Cryophytum crystallinum is considered a suitable target for biological control in the United States (Olckers et al. Reference Olckers, Coetzee, Egli, Martin, Paterson, Sutton and Wood2021). Three candidate weevil biological control agents have been identified in South Africa, namely: Lixus carinerostris (Curculionidae: Lixinae), Calodemas prolixus (Curculionidae: Lixinae), and an unidentified weevil (Curculionoidea: Urodontidae) (Louw Reference Louw1993; Olckers et al. Reference Olckers, Coetzee, Egli, Martin, Paterson, Sutton and Wood2021). To further investigate a prospective classical biological control program for C. crystallinum, identifying the source population(s) of the invasion may improve the likelihood of finding coevolved natural enemies that are well adapted to the target weed and therefore suitable candidates for biological control (Goolsby et al. Reference Goolsby, De Barro, Makinson, Pemberton, Hartley and Frohlich2006; Nawaz et al. Reference Nawaz, McCulloch, Cappadonna, Brookes and Walter2025; Paterson et al. Reference Paterson, Downie and Hill2009). Such prospecting represents an initial step in the classical biological control pipeline, and any candidate agents identified would undergo rigorous host-specificity testing and risk assessment under quarantine conditions before being considered for release. These subsequent stages are beyond the scope of the present study.
Genetic tools are frequently used in the invasion biology and biocontrol literature to match invasive populations to their source of origin and to uncover population-level structuring within an invasive species complex (Gaskin Reference Gaskin2024; Goolsby et al. Reference Goolsby, De Barro, Makinson, Pemberton, Hartley and Frohlich2006; Paterson et al. Reference Paterson, Downie and Hill2009; Reid et al. Reference Reid, Naidu, Paterson, Mangan and Coetzee2021; Sutton et al. Reference Sutton, Paterson and Paynter2017; van Steenderen et al. Reference van Steenderen, Sandenbergh, Brookes, Moran, Cristofaro, Hoyer and Paterson2025). The present study aimed to investigate the source and introduction history of invasive C. crystallinum populations in the United States and Mexico using a double digest restriction site–associated DNA sequencing (ddRADseq) population genetic technique for single-nucleotide polymorphism (SNP) analysis. Specifically, we sought to resolve the phylogeographic structure of C. crystallinum across its native and invasive ranges and identify the most likely source population(s) for the North American invasion. Our predominant a priori prediction was that the invasive populations would show the closest genetic match to populations from southern Africa, which is consistent with the species’ known native distribution.
Materials and Methods
Field Surveys and Sample Collection
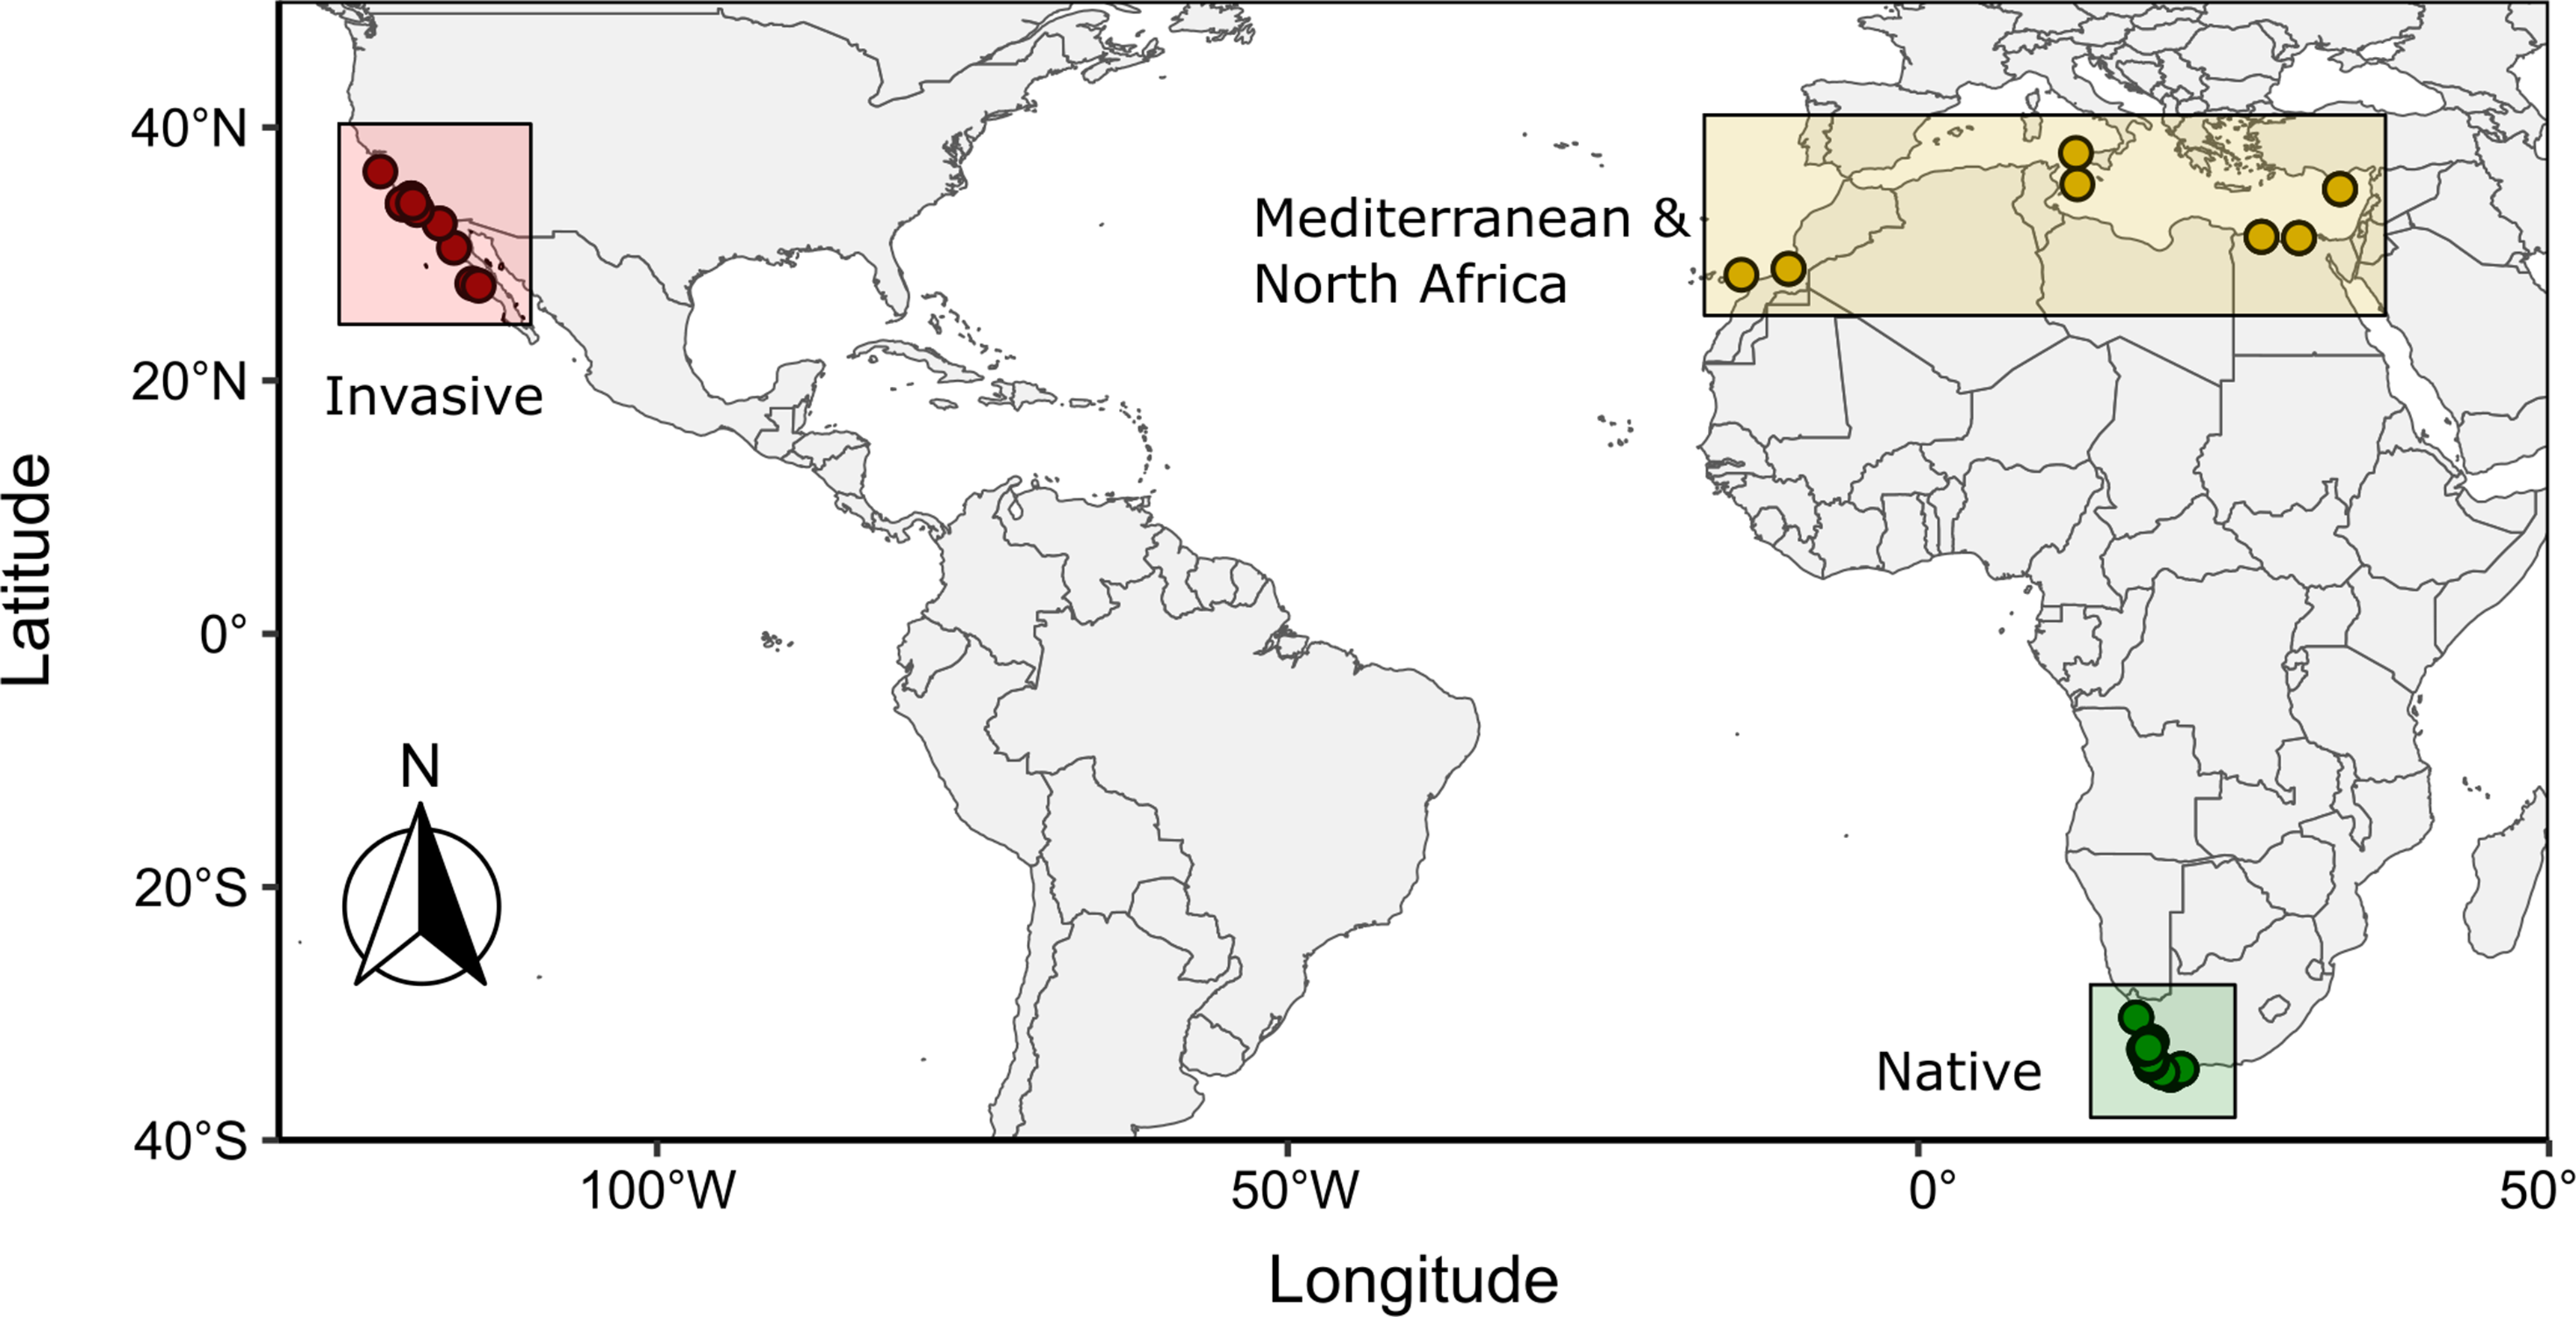
A total of 115 Cryophytum crystallinum samples were sourced from the plant’s native range in South Africa (n = 64; 13 sites), the Mediterranean region (n = 19; 7 sites), and the invaded range in North America (n = 32; 13 sites) (Figure 1; Supplementary File S1). The sites represent all the regions where the plant is present, except for Iran, the Arabian Peninsula, and Australia. The 13 sites within South Africa are spread across most of the plant’s distribution in the country, namely along the west and south coasts. Gerbaulet and Hartmann (Reference Gerbaulet, Hartmann and Hartmann2017) describe the distribution of C. crystallinum as occurring between Namaqualand in the Northern Cape down to the Cape Peninsula in the Western Cape, and toward Gqeberha (Port Elizabeth) in the Eastern Cape. We treated Gerbaulet and Hartmann (Reference Gerbaulet, Hartmann and Hartmann2017) as the most up-to-date authority on the distribution of C. crystallinum, because this study includes data from all available herbarium samples.
Cryophytum crystallinum sample collection areas for the present study, showing the plant’s native range in South Africa and invaded ranges in the Mediterranean, North Africa, and North America (specifically California and Mexico).

The present work included six surveys covering the whole western coast of South Africa from Cape Town to the border of Namibia over a 5-yr period. Despite these efforts, no plants, except those with intermediate morphological characteristics at Hondeklip Bay, were found farther north on the west coast. The plant was also absent in frequent surveys on the southeast coast between Gqeberha and Mossel Bay. There are no verified records of the species in either of these areas on iNaturalist, but because we found C. crystallinum at multiple other recorded sites within the areas, we assumed that the whole distribution of the species in South Africa was sampled. All the plants recorded in the Northern Cape were identified as the close relative, ice plant (Mesembryanthemum guerichianum Pax; syn.: Cryophytum guerichianum Pax). According to Gerbaulet and Hartmann (Reference Gerbaulet, Hartmann and Hartmann2017), the two species are morphologically similar, but differ in flower size and stem shape. The only specimens collected in the Northern Cape occurred in Hondeklip Bay and appeared to display characteristics of both species. These were therefore included in the present analyses.
DNA Extraction and Sequencing
The laboratory protocols followed those presented in van Steenderen et al. (Reference van Steenderen, Sandenbergh, Brookes, Moran, Cristofaro, Hoyer and Paterson2025), with the exception that samples were normalized to concentration pools of <1, 1, 2, and 4 ng µl−1. The Adapterama III methodology (Bayona-Vasquez et al. Reference Bayona-Vasquez, Glenn, Kieran, Pierson, Hoffberg, Scott, Bentley, Finger, Louha, Troendle, Diaz-James, Mauricio and Faircloth2019) was used to prepare RADseq libraries, utilizing the ClaI and EcoRI iTru i5 and iTru i7 internal indexes, respectively. Restriction digestion was performed using the MspI read 1 and EcoRI-HF read 2 enzymes, and the ClaI read 1 adapter dimer-cutting enzyme. The external index pair iTru5 01 A and iTru7 101 01 was added during final library PCR preparation. Sequencing (NovaSeq X plus 10B 2×150 instrument; 1 lane, with 2–2.5 B PE per lane) and size-selection (525 bp ± 10% using a Blue Pippin) were outsourced to Admera Health (https://www.admerahealth.com/).
RADseq Bioinformatics
All bioinformatic analyses were performed on a Linux system via the Centre for High Performance Computing (CHPC) Lengau cluster hosted by the South African Council for Scientific and Industrial Research (CSIR). Following the methodology in van Steenderen et al. (Reference van Steenderen, Sandenbergh, Brookes, Moran, Cristofaro, Hoyer and Paterson2025), all samples were initially checked for quality using FastQC (Andrews Reference Andrews2010). Sample files were demultiplexed using the process radtags function in Stacks (Catchen et al. Reference Catchen, Hohenlohe, Bassham, Amores and Cresko2013), where final read lengths were truncated to 140 bp. Failed reads were discarded using the filter-illumina parameter, and barcode-dist was set to 2. Demultiplexed sample files were normalized by randomly subsampling reads using the reformat.sh script from the BBMap package (Bushnell Reference Bushnell2014). This approach preserves paired-end read compatibility and equalizes coverage across samples. A total of 95 samples were used for downstream processing.
Because a reference genome was available for C. crystallinum (Sato et al. Reference Sato, Kondo and Agarie2024) (https://www.ncbi.nlm.nih.gov/datasets/genome/GCA_030267885.1/), demultiplexed sample fragments were aligned to this indexed reference and sorted using bowtie2 (Langmead and Salzberg Reference Langmead and Salzberg2012) and samtools (Li et al. Reference Li, Handsaker, Wysoker, Fennell, Ruan, Homer, Marth, Abecasis and Durbin2009). The Stacks ref map.pl and populations functions (no filtering, except r = 0.75) were subsequently run, where final SNP files were exported to R (R Core Team 2025) for downstream processing.
The SNP filtering was conducted using the SNPfiltR (DeRaad Reference DeRaad2022) and vcfR (Knaus and Grunwald Reference Knaus and Grünwald2017) packages in R. The dartR package (Gruber et al. Reference Gruber, Unmack, Berry and Georges2018) was used to convert filtered vcf files into fastSTRUCTURE format. All SNPs were filtered such that data with a genotype quality value less than 35 (4.76% of the data) and a depth less than 5 (22.41% of the data) were discarded using the hard_filter function. A further 11.9% of heterozygous genotype calls were converted to missing data following an allele balance ratio check using the filter_allele_balance function. Genotypes with an allele balance outside the default range of 0.25 to 0.75 were converted to missing data, as true heterozygous genotypes are expected to have an allele balance close to 0.5, whereas strongly imbalanced genotype calls are more likely to result from sequencing or genotyping errors. Next, SNPs with a mean depth above 100 were removed using the max_depth function, equating to 6.68% of the data. Missing data were then assessed for each sample using the missing_by_sample function, with a cutoff value of 0.9. This threshold represents the maximum proportion of missing genotype calls allowed per sample, thereby removing samples with genotype calls at fewer than 10% of loci (i.e., >90% missing data). This lenient threshold was applied as an initial quality-control step to exclude only samples with extremely poor sequencing success while retaining samples that could be improved through further filtering. This step removed four samples, leaving 91 samples for downstream analyses. Thereafter, SNPs with a minor allele count <3 were removed (60.33% of SNPs). A final locus-level filter excluded SNPs with >20% missing data (missing data cutoff = 0.8), using the missing_by_snp function. The resulting filtered dataset comprised 91 samples and 15,786 SNPs with 9% missing data overall and was used for clustering analyses and population-level statistical tests.
A fastSTRUCTURE (Wang Reference Wang2022) analysis was run, applying delta K-values between 1 and 10. The optimal delta K-value was determined using the inbuilt fastSTRUCTURE tests that assess model complexity that maximizes marginal likelihood and model components that best explain structure in data. Cluster assignment outputs (meanQ files) were plotted using a custom R script (available on the project GitHub repository). A principal component analysis (PCA) was run using the adegenet (Jombart Reference Jombart2008) R package. Input files for SplitsTree v. 4 (Huson and Bryant Reference Huson and Bryant2006) were generated with the StAMPP R package (Pembleton et al. Reference Pembleton, Cogan and Forster2013) and used to create a TCS network. Population statistics were generated using the poppr and hierfstat (F ST values) packages, which included hierarchical grouping according to (1) whether it was collected in the native South African range, the Mediterranean region, or the invaded range in North America, (2) the country of origin for each sample, and (3) sites within the native South African range. All F ST values included 95% confidence intervals, calculated using 10,000 bootstrap repeats. Population statistics and F ST analyses under the first two grouping schemes, as well as the PCA, excluded the outlier samples from Hondeklip Bay.
Data Availability
All Linux job scripts and associated R coding files are stored on a GitHub repository (https://github.com/clarkevansteenderen/RADseq_cryophytum_crystallinum), where a comprehensive workflow, customized R scripts, and tailored Stacks parameters are provided. The repository is also linked to a permanent Zenodo doi: https://doi.org/10.5281/zenodo. 17379330. Data are available on the NCBI Short Read Archive (SRA) under project ID PRJNA1304995.
Results and Discussion
RADseq Output
Demultiplexed samples comprised a total of 89,021,397 paired-end reads. Of these, 16.2% were excluded due to insufficient mapping quality, and 30.7% remained unmapped to the reference genome and were therefore not used for genotype calling. Average alignment success to the reference genome was 70 ± 18% (SD) across all samples (range: 13% to 93%), and poorly aligned samples were removed during downstream filtering. Following assembly, 118,223 loci were genotyped, with an average locus length of 232.1 bp and a mean per-sample sequencing depth of 50.6x ± 41.3x (range: 6.5x to 260.1x).
Population Structure
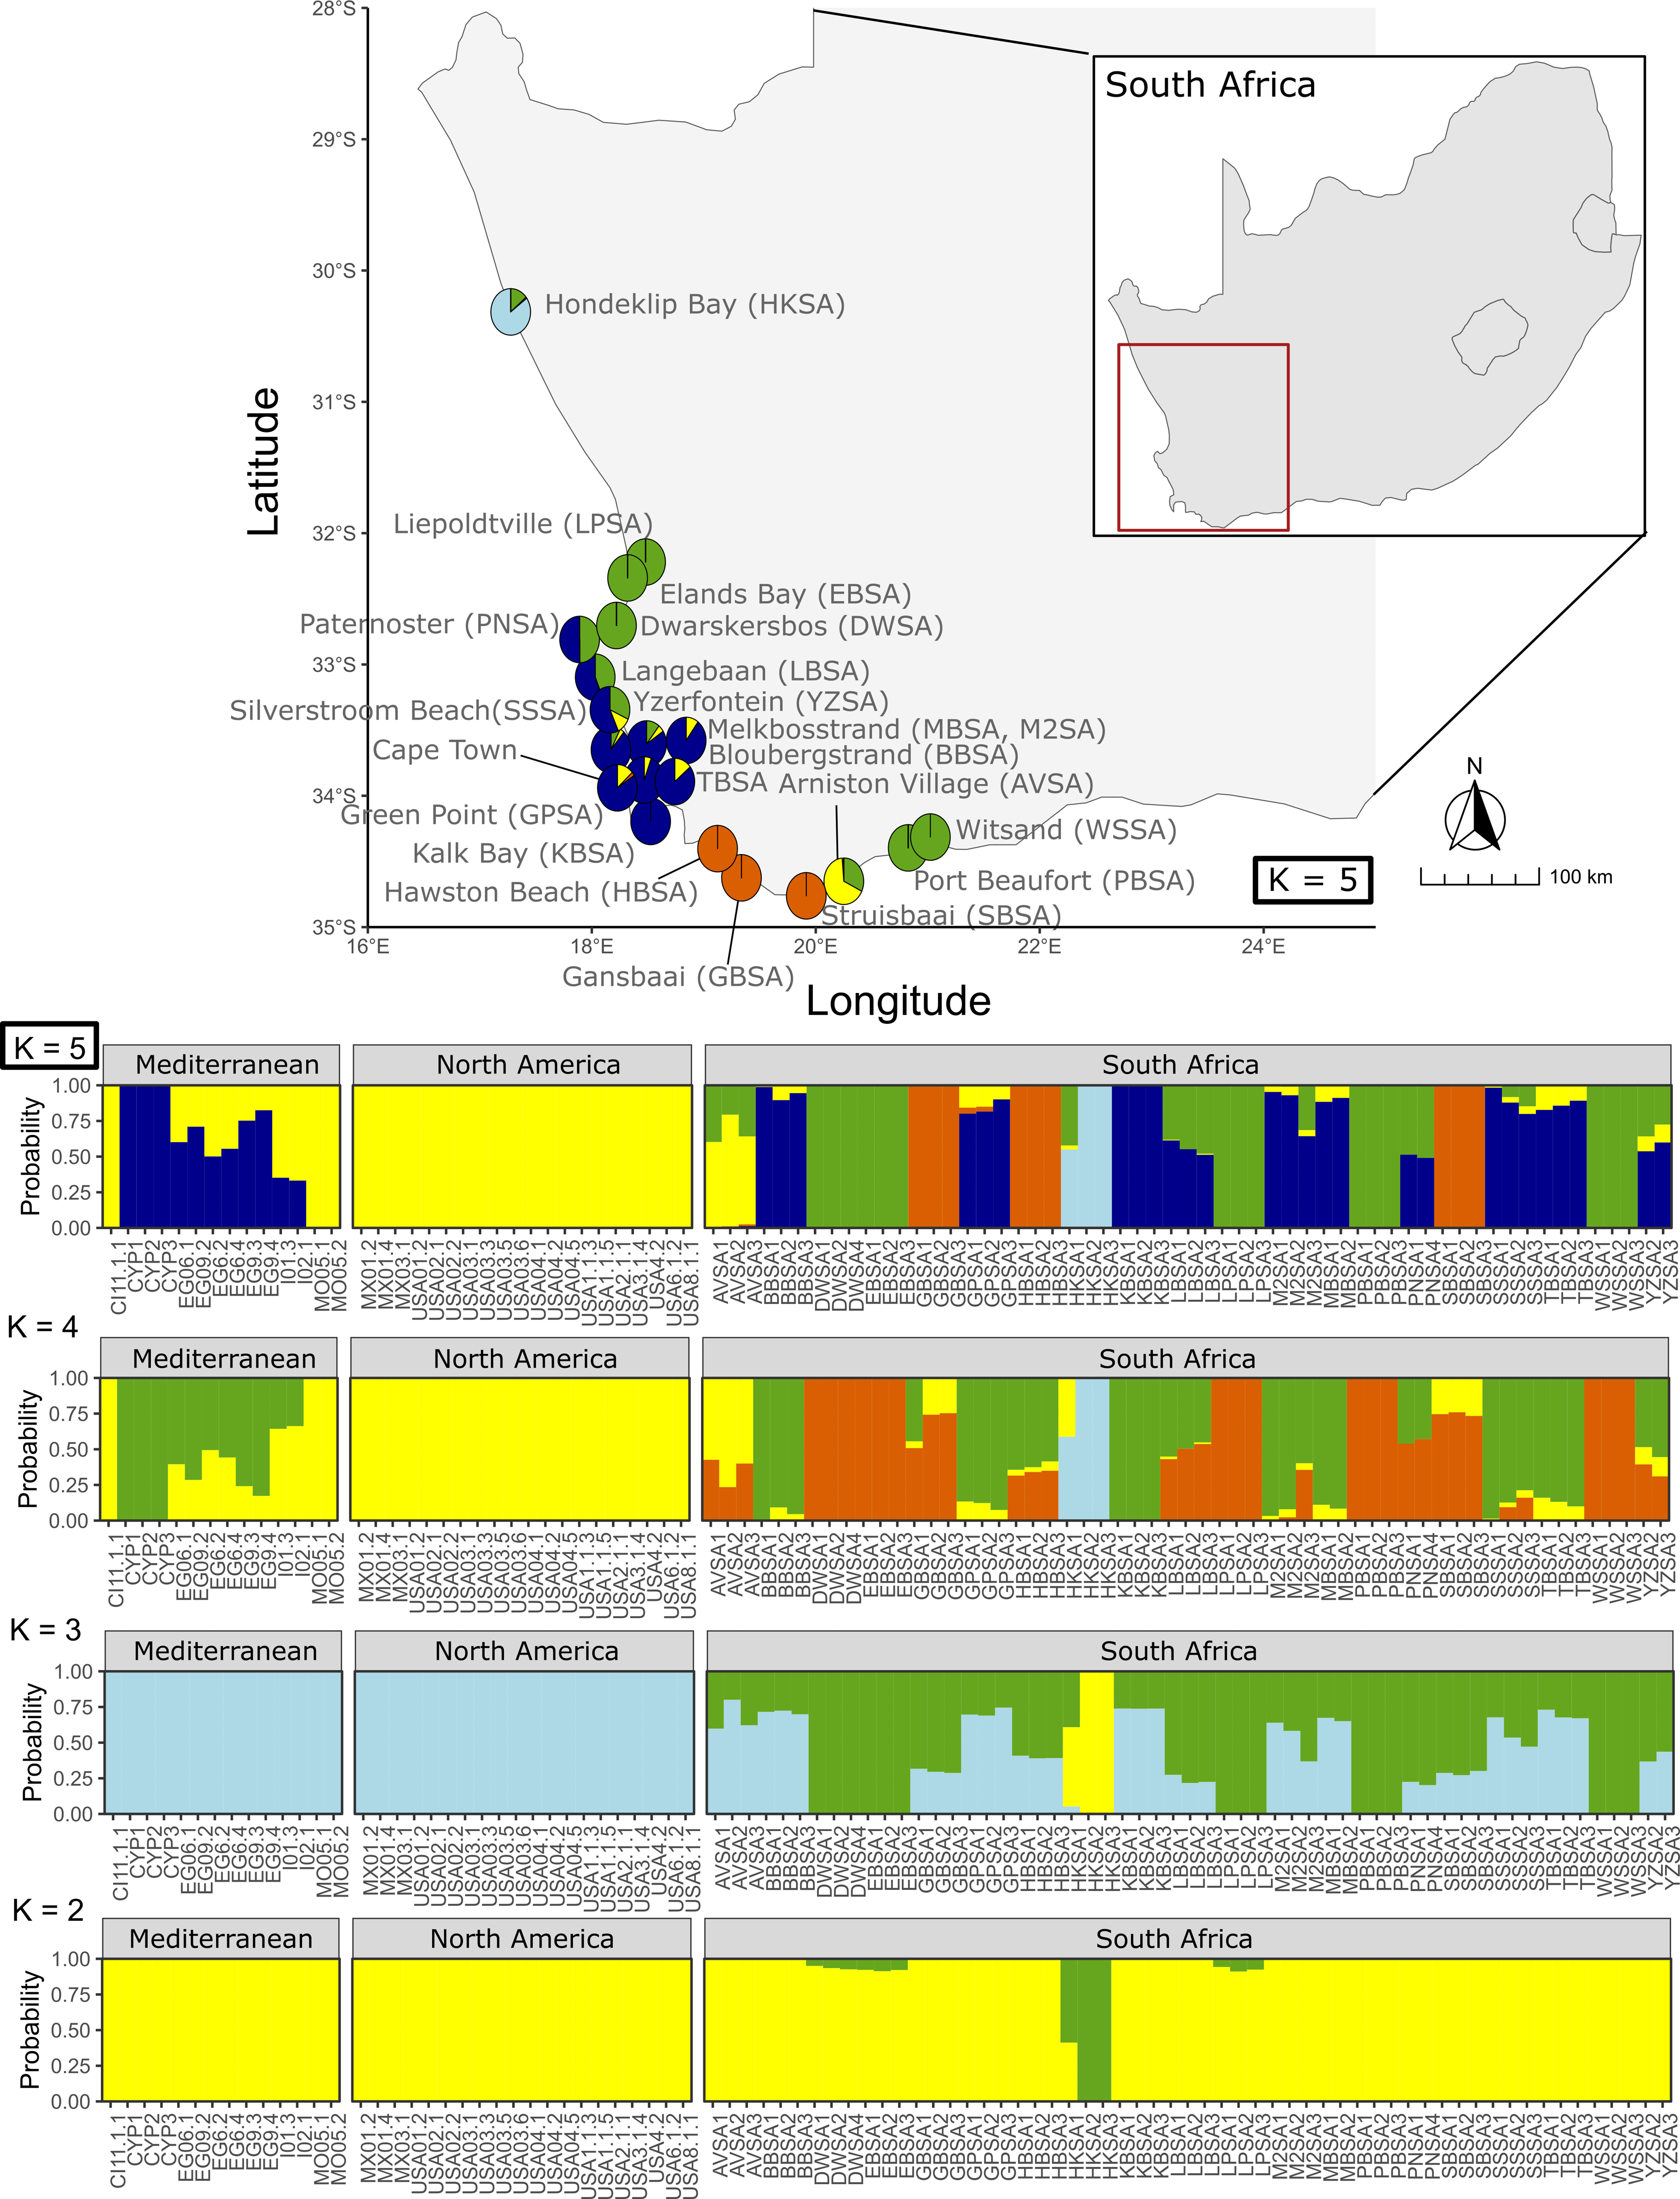
The fastSTRUCTURE results indicated that delta K = 5 best explained the genetic structure in the data. Under the delta K = 5 clustering structure, the North American invaded range (California and Mexico) matched the North African and Mediterranean samples to varying degrees, except those collected in Cyprus (Figure 2). The Mediterranean and North American clusters were most similar to those from Arniston Village in the native South African range, and also partly matched those from Blouberg Strand (BBSA), Green Point (GPSA), Melkbosstrand (MBSA and M2SA), the Table Bay nature reserve area (TBSA), and Yzerfontein (YZSA) (Figure 2). Pairwise F ST values revealed that the North American and Mediterranean populations were more similar to the native range than to each other (Table 1).
Cryophytum crystallinum fastSTRUCTURE output showing assignments to genetic clusters for delta K = 2 through to delta K = 5. Delta K = 5 was the optimal value that best explained population structure. The map of South Africa shows pie charts per collection site, summarizing the fastSTRUCTURE clustering results for delta K = 5 output. TBSA, Table Bay Nature Reserve, Sunset Beach.

F ST (fixation index) pairwise comparisons across Cryophytum crystallinum samples grouped by broad distributiona

Table 1. Long description
A table comparing genetic structure data across different regions. The table has three rows and three columns. The column headers are Introduced Invaded, Native, and Introduced. The row labels are Introduced, Invaded, and Native. The values in the table are as follows: Row 1: Introduced, 0.49/0.51, 0.18/0.20. Row 2: Invaded, 0.50, 0.32/0.34. Row 3: Native, 0.19, 0.33.
a Values below the diagonal are F ST values, and values above the diagonal are 95% confidence intervals (lower/upper) from 10,000 bootstrap repeats. Introduced, North Africa and the Mediterranean; Invaded, United States (California) and Mexico; Native, South Africa.
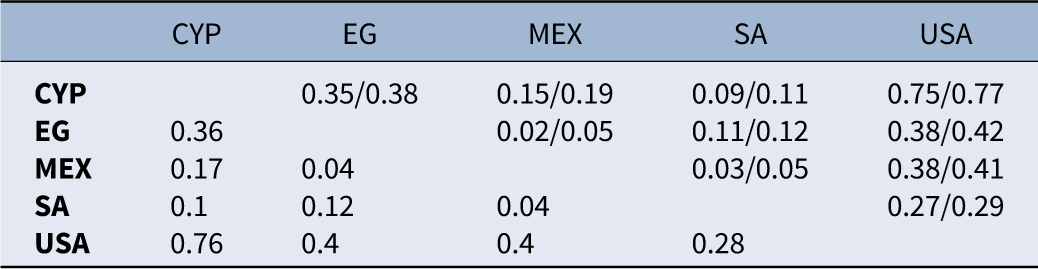
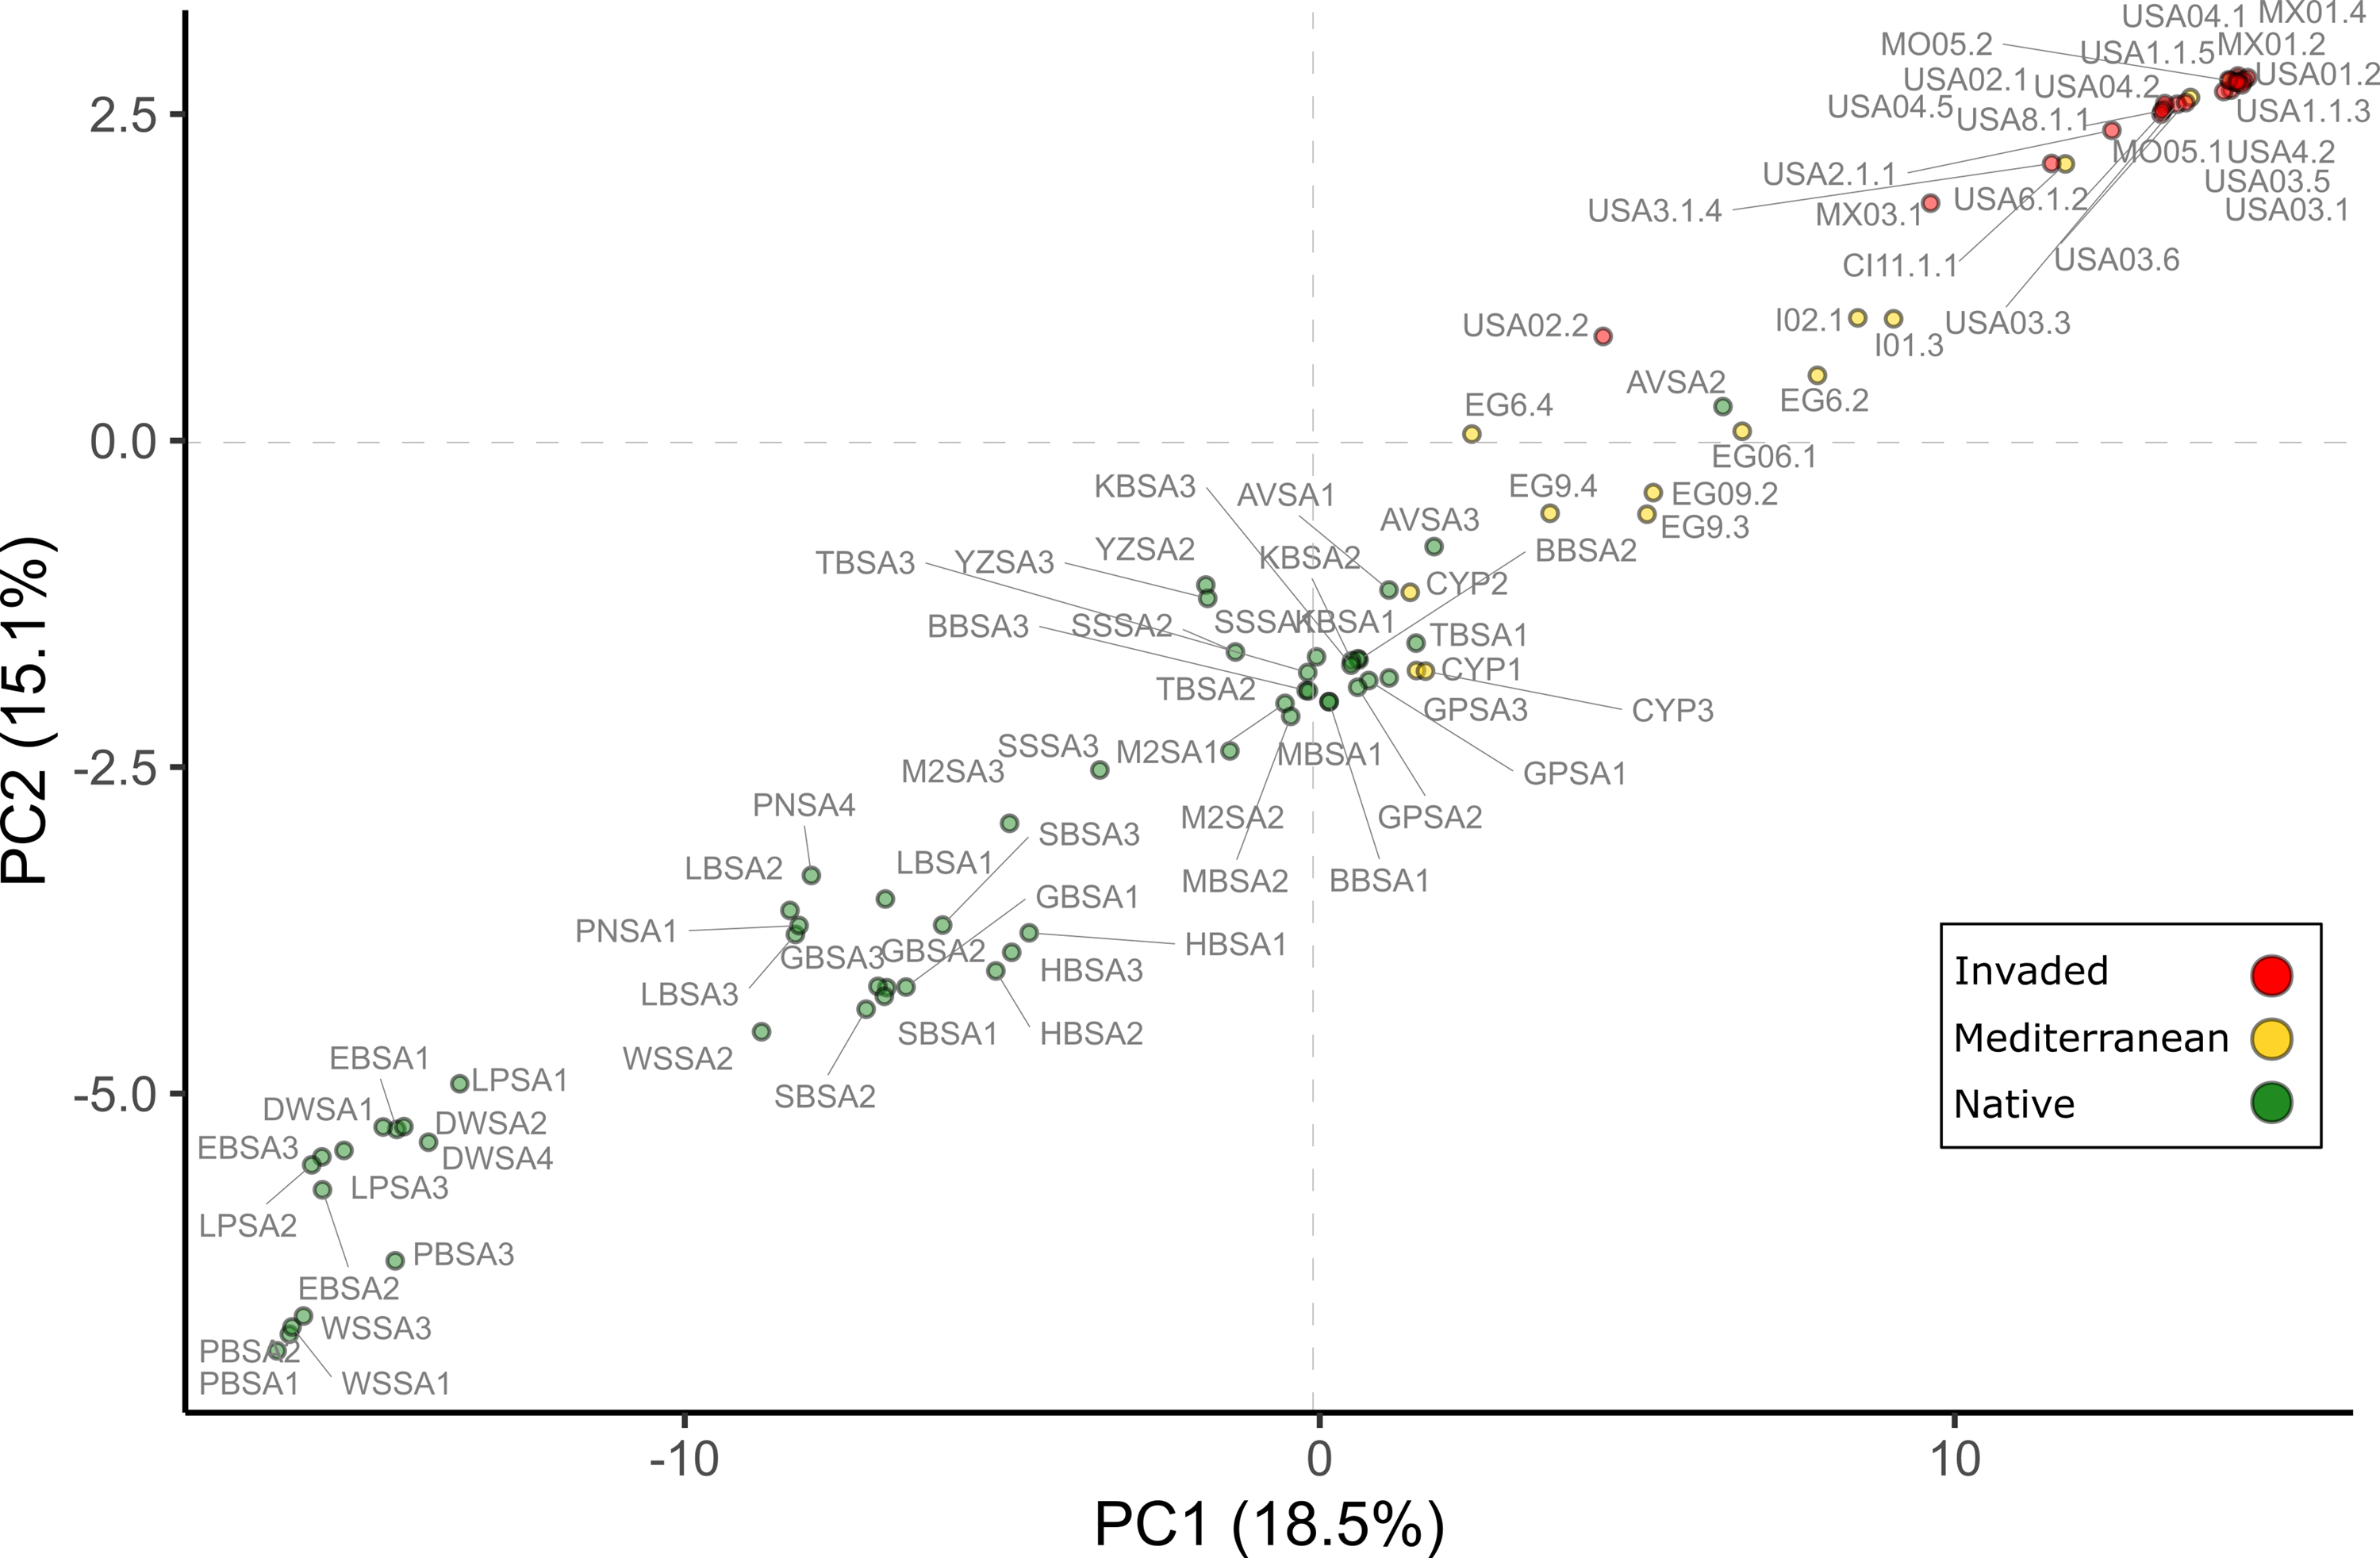
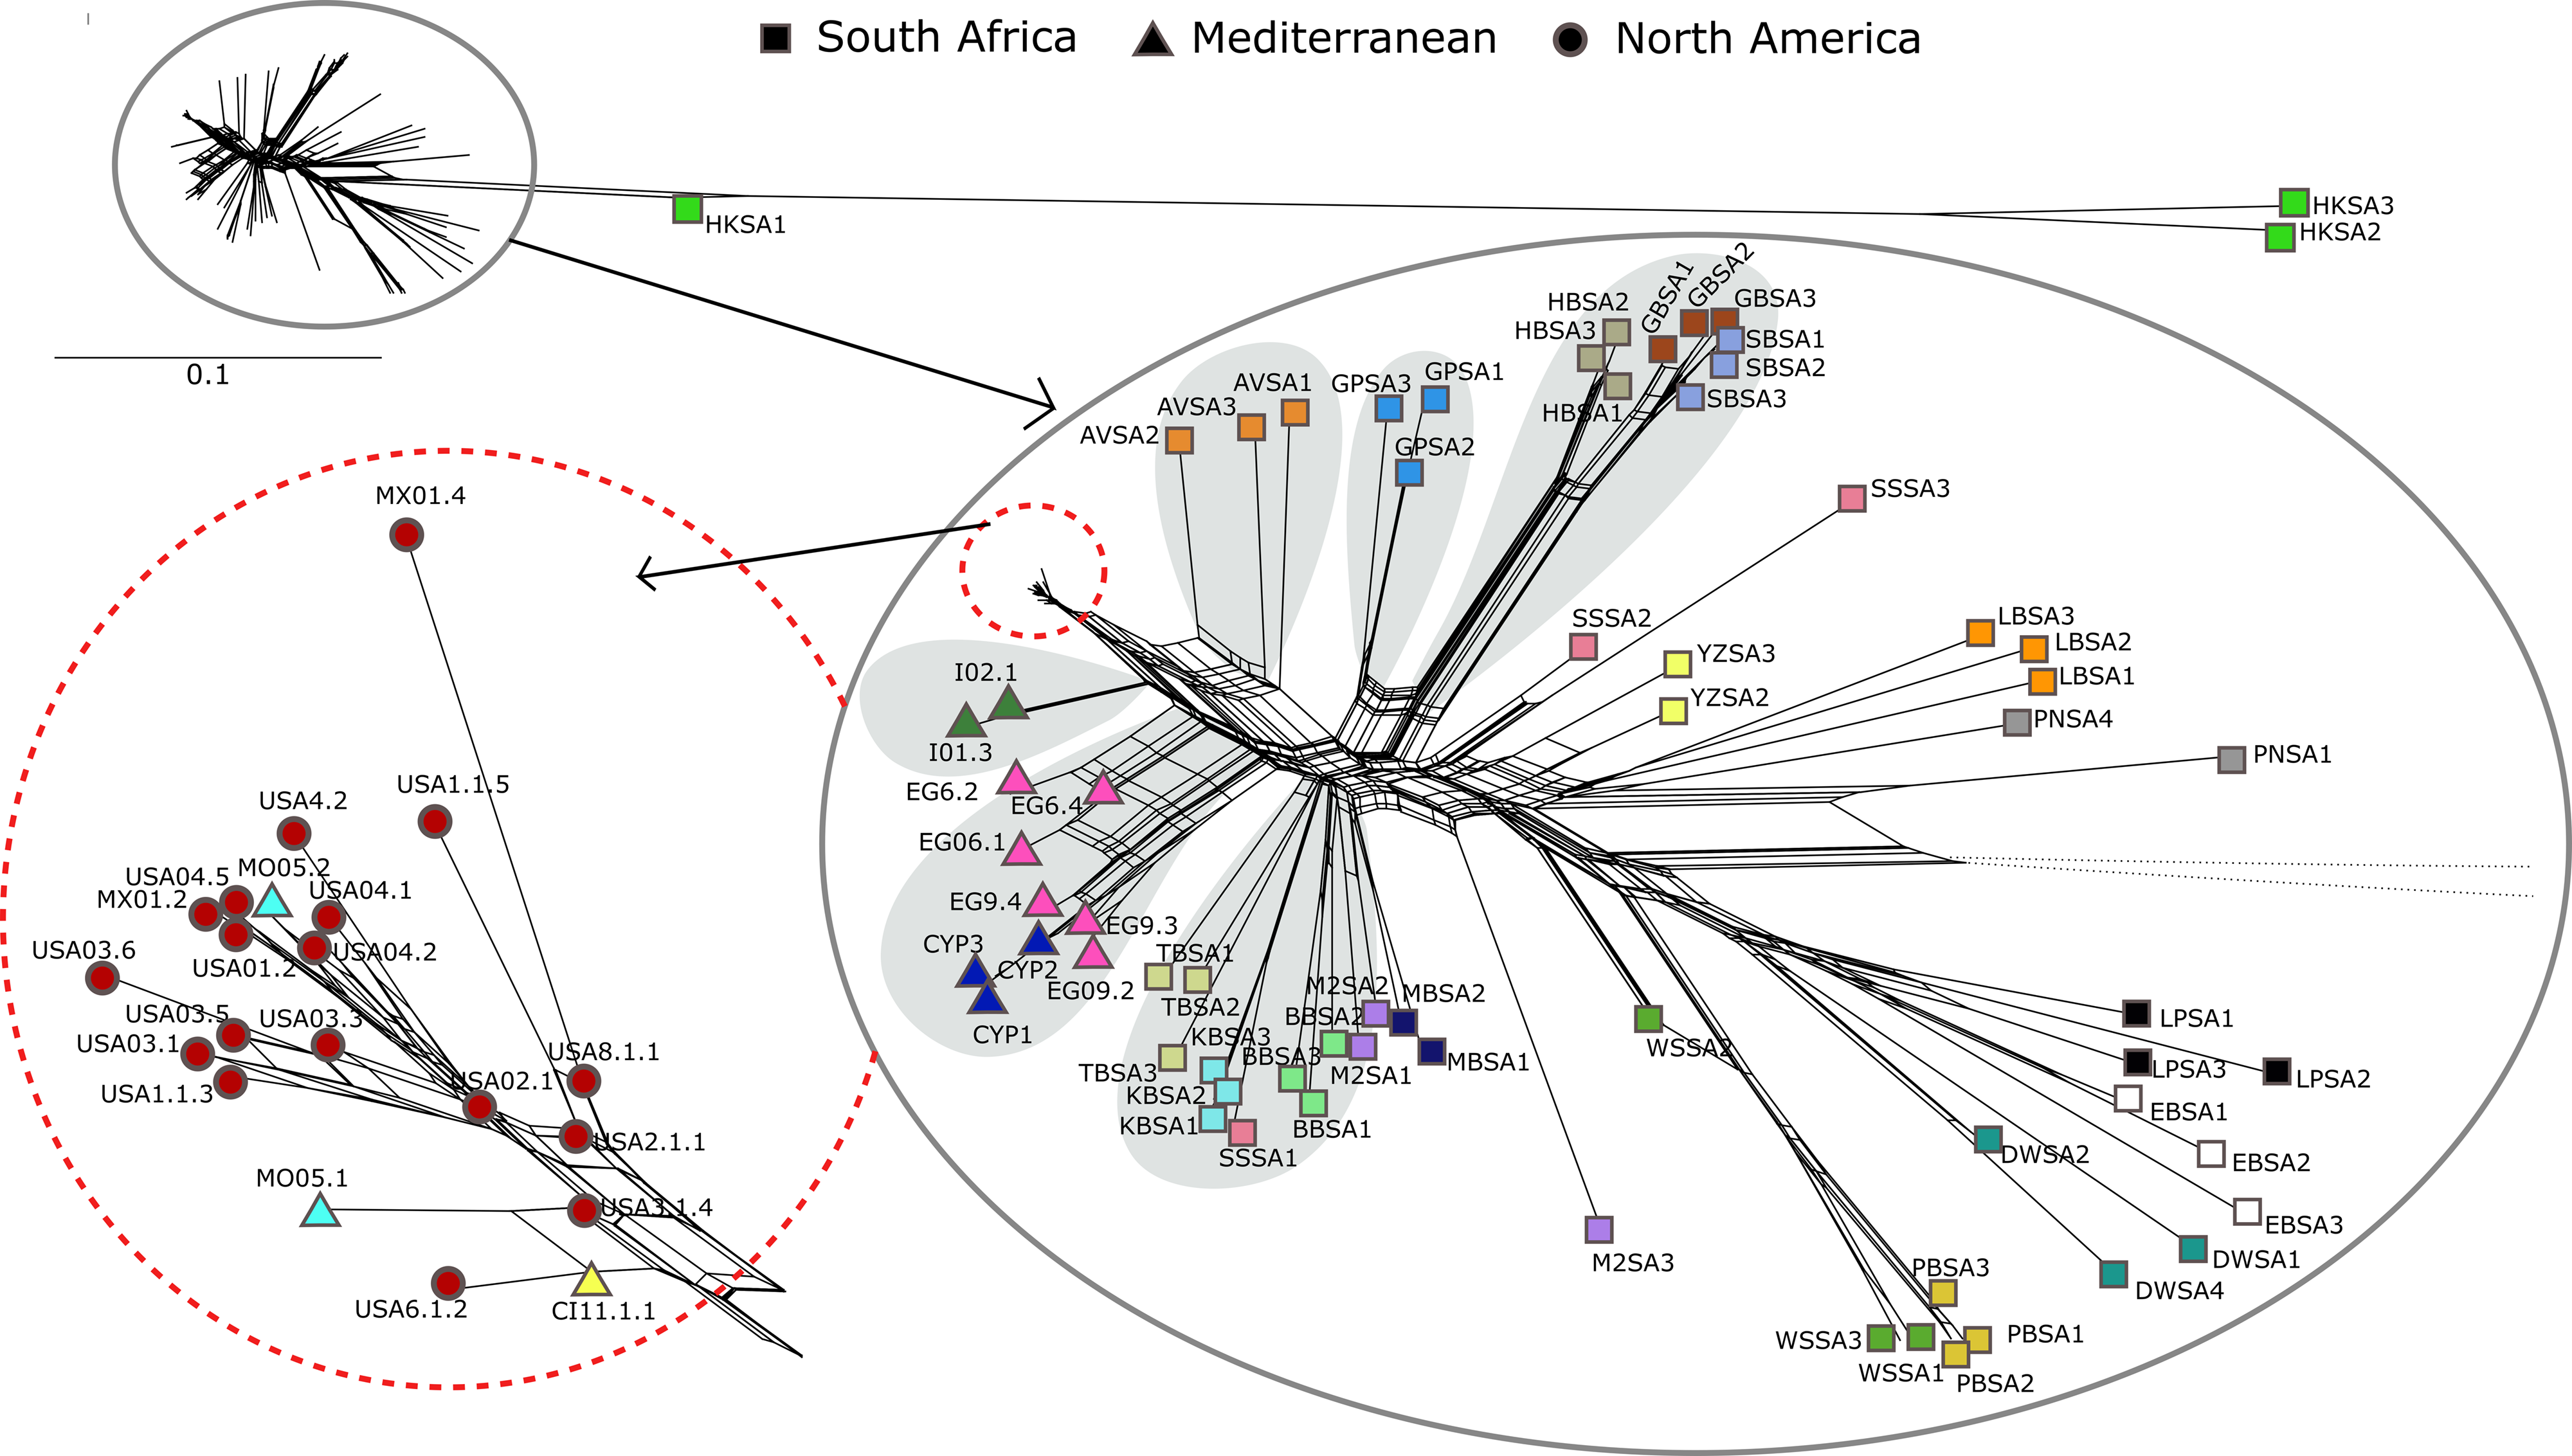
At the country level, the F ST values showed that the Californian population was most similar to those collected in South Africa and most distant from those from Cyprus (Table 2). The Mexican population was most similar to populations from Egypt and South Africa, and most distant from the Californian population (Table 2). Both the PCA and SplitsTree diagrams revealed that the populations from the Canary Islands and Morocco clustered with the invaded North American range and supported the close relationship of the invaded range samples to those from Arniston Village in the native South African range (Figures 3 and 4).
F ST (fixation index) pairwise comparisons across Cryophytum crystallinum samples grouped by countrya

Table 2. Long description
A table comparing FST values across Cryophytum crystallinum samples from different countries. The table has five rows and five columns, including headers. The columns are labeled CYP, EG, MEX, SA, and USA, representing different countries. The rows are labeled CYP, EG, MEX, SA, and USA. Each cell contains two FST values separated by a slash. Row-wise data: Row 1: CYP, 0.35/0.38, 0.15/0.19, 0.09/0.11, 0.75/0.77. Row 2: EG, 0.36, 0.02/0.05, 0.11/0.12, 0.38/0.42. Row 3: MEX, 0.17, 0.04, 0.03/0.05, 0.38/0.41. Row 4: SA, 0.1, 0.12, 0.04, 0.28. Row 5: USA, 0.76, 0.4, 0.4, 0.27/0.29.
a Values below the diagonal are F ST values, and values above the diagonal are 95% confidence intervals (lower/upper) from 10,000 bootstrap repeats. CYP, Cyprus; EG, Egypt; MEX, Mexico; SA, South Africa; USA, United States (California). Only the countries with more than two representative samples are shown.
A principal component analysis (PCA) showing the first two PC axes for the invaded range, Mediterranean, and native range Cryophytum crystallinum samples. See Supplementary File S1 for sample names.

Figure 3. Long description
Panel A: A scatter plot representing the principal component analysis (PCA) of Cryophytum crystallinum samples. The horizontal axis represents PC1 (18.5 percent) and the vertical axis represents PC2 (15.1 percent). The plot includes data points categorized into three groups: invaded (red), Mediterranean (yellow), and native (green). The data points are spread across the plot, showing clusters and patterns. The invaded group is concentrated in the upper right quadrant, the Mediterranean group is scattered around the center, and the native group is spread across the lower left and center quadrants. There are visible clusters and gaps within each group, indicating variations in the principal components.
A NeighbourNet SplitsTree diagram of the ddRADseq single-nucleotide polymorphism (SNP) data, showing enlarged sections of the South African (squares), Mediterranean (triangles), and North American (circles) populations. Shapes are colored to differentiate between sites. See Supplementary File S1 for sample names.

At the site grouping level, the Mexican population was most similar to populations from the South African sites of Arniston Village (AVSA), Silverstroom Beach (SSSA), Table Bay nature reserve (TBSA), Melkbosstrand (M2SA), and Langebaan (LBSA) (Supplementary File S2). The sites in the United States followed the same pattern but were not as similar to the native South African populations as the Mexican samples were (Supplementary File S2). Of the South African sites, the U.S. population was most similar to the Arniston Village (AVSA) population and least similar to Port Beaufort (PBSA) population (Supplementary File S2).
Population Statistics
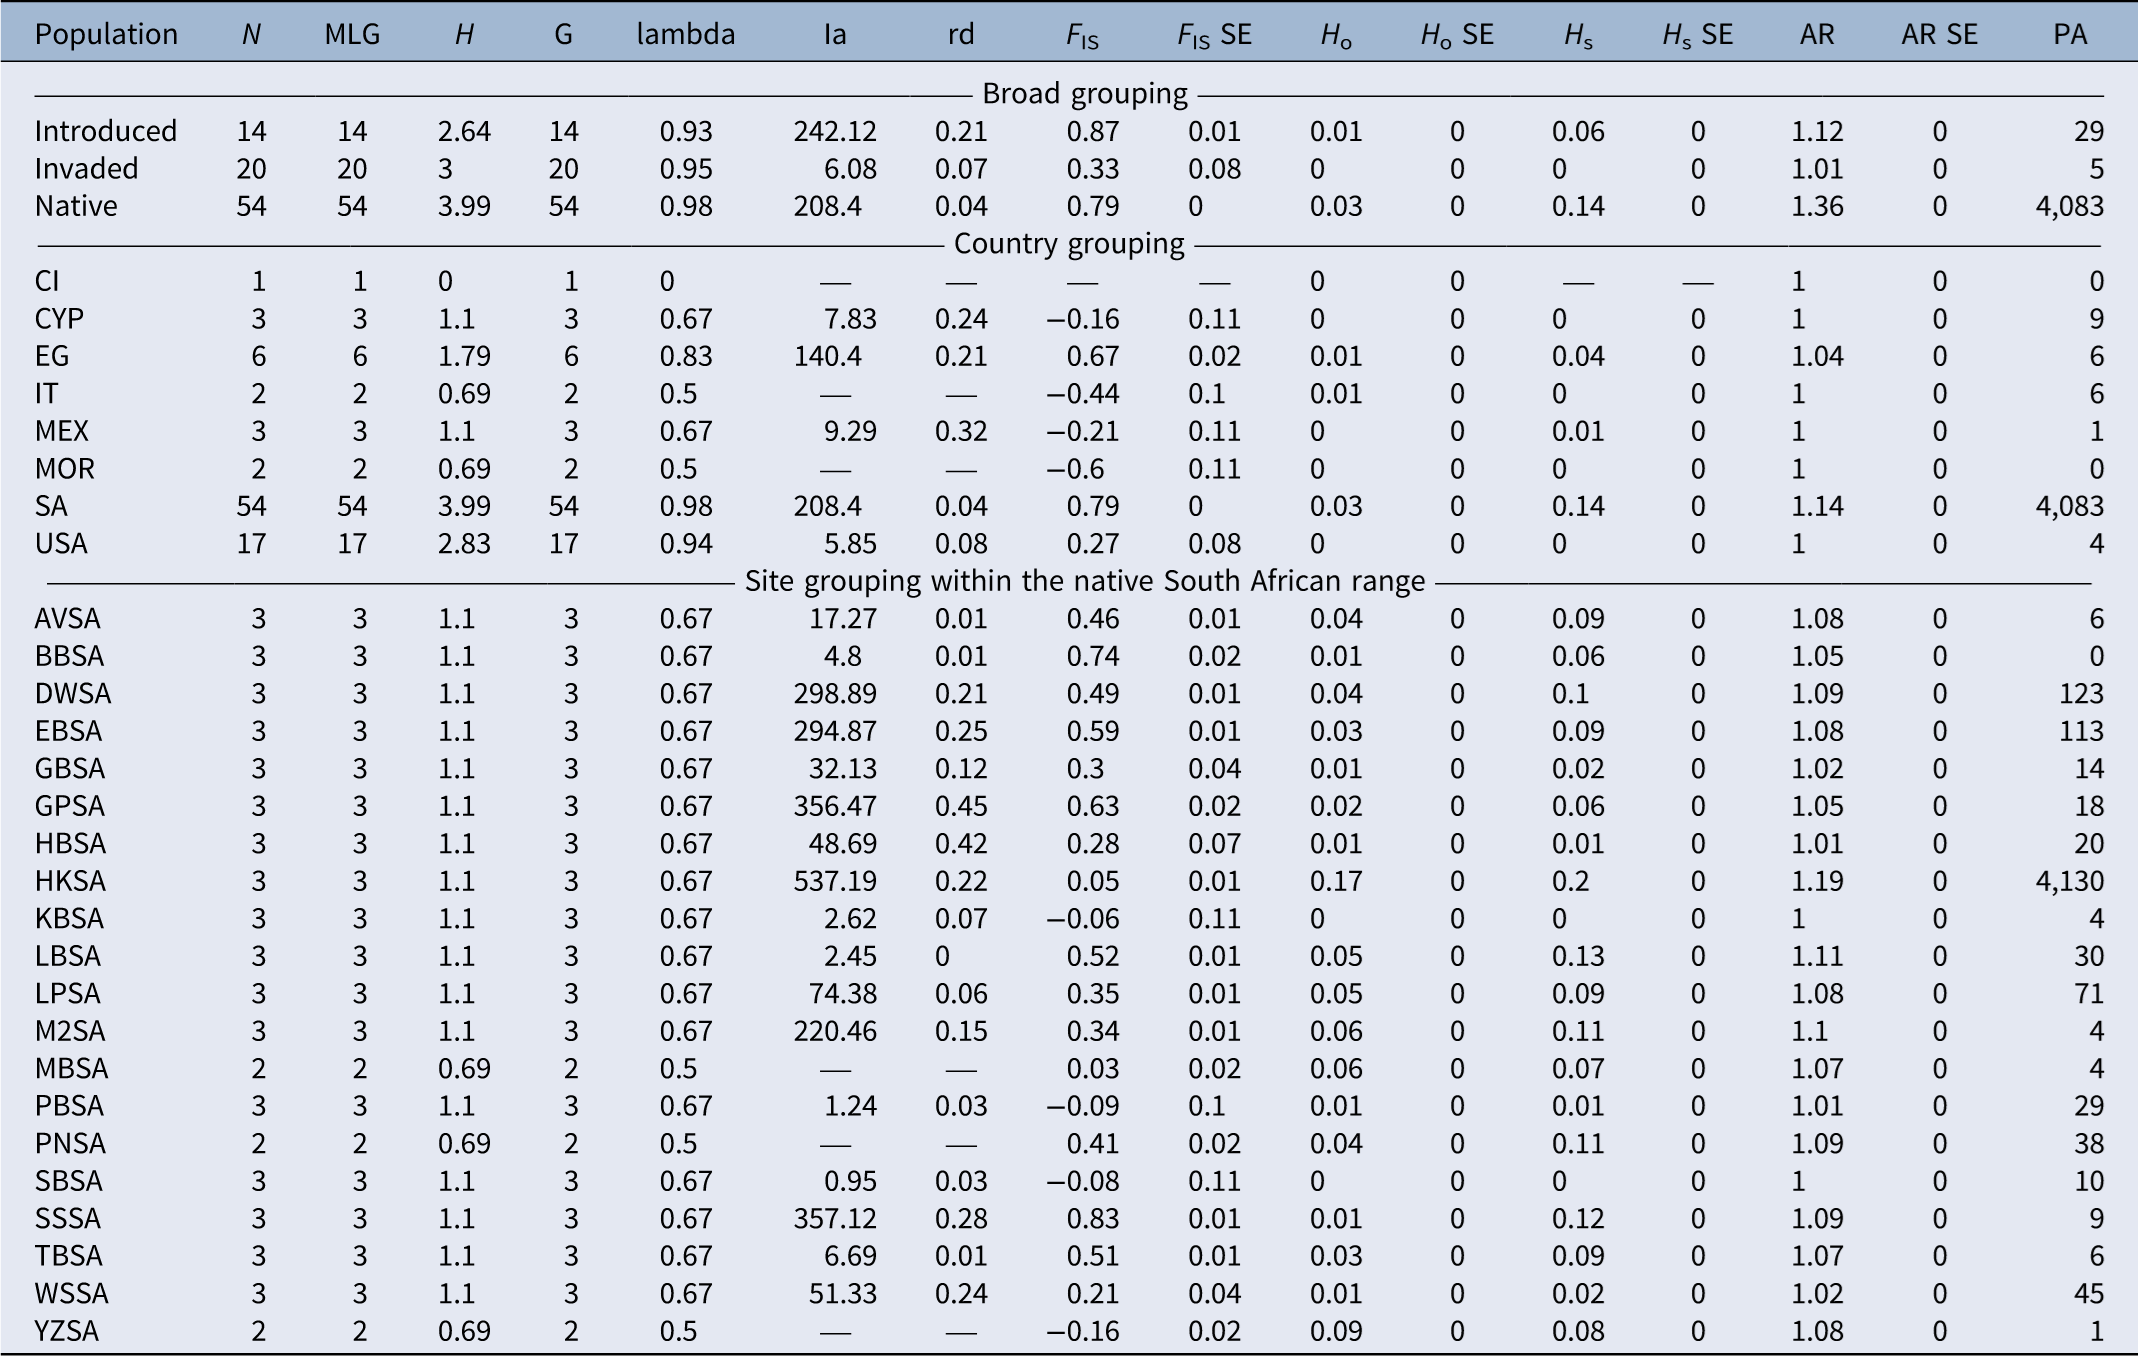
Under the broad grouping scheme (North American, Mediterranean, and native South African ranges), the South African populations showed the highest allele richness, number of private alleles, and diversity indices (Table 3). The Mediterranean populations showed the highest inbreeding coefficient and standardized index of association (Table 3).
Cryophytum crystallinum population statistics for the broader grouping strategya

Table 3. Long description
The table presents population statistics for Cryophytum crystallinum under various grouping strategies. It includes data for introduced, invaded, and native populations, as well as specific country and site groupings within the native South African range. The table has 14 columns and 37 rows, including headers and grouped rows. Column headers include Population, N, MLG, H, G, lambda, Ia, rd, Fis, Fis SE, Ho, Ho SE, Hs, Hs SE, AR, AR SE, and PA. Row labels include broad grouping categories such as Introduced, Invaded, and Native, as well as specific country groupings like CI, CYP, EG, IT, MEX, MOR, SA, and USA. Additionally, there are site groupings within the native South African range, labeled with abbreviations like AVSA, BBSA, DWSA, and so on. Each row provides specific values for the population statistics under the respective grouping strategy.
a AR, allele richness; F IS, inbreeding coefficient; G, Stoddard and Taylor’s Index; H, Shannon-Weiner Diversity Index; H o, observed heterozygosity; H s, expected heterozygosity; Ia, Index of Association; lambda, Simpson’s Index; MLG, multilocus genotypes; N, number of individuals; PA, private alleles; rd, Standardized Index of Association. SE, Standard Error of the mean. Invaded, USA (California and Mexico); Native, South Africa. CI, Canary Islands; CYP, Cyprus; EG, Egypt; IT, Italy; MEX, Mexico; MOR, Morocco; SA, South Africa; USA, United States of America. Refer to Supplementary File S1 for South African site acronyms. Missing values are denoted by a dash (—), where there were too few samples to compute a value.
The population statistics at the country level revealed output similar to that of the broad grouping scheme, except that the invaded range in the United States showed the highest diversity indices after the native South African range (Table 3). Although populations from Cyprus, Italy, Mexico, and Morocco showed some evidence of potential outbreeding (negative inbreeding coefficient [F IS] values), this could be an artifact of small sample sizes. Despite evidence of outbreeding, the Mexican population showed a high standardized index of association (Table 3).
The site-level population statistics showed a high degree of allele richness and private alleles in the samples collected in Hondeklip Bay (HKSA) (Table 3). Diversity indices were uniform across the native range sites, with only Melkbosstrand (MBSA), Paternoster (PNSA), and Yzerfontein (YZSA) showing slightly lower values. This is, however, more likely a result of smaller sample sizes for these sites. Of the remaining sites in South Africa, the highest private allele metrics were found in Dwarskersbos (DWSA), Elands Bay (EBSA), and Leipoldtville (LPSA). These sites all occur on the west coast, north of Cape Town (Figure 2).
Understanding the invasion history and population structure of a problem species is essential to management and monitoring programs, as this can assist in prioritizing areas to survey for the natural enemies of that species for biological control. Using a ddRADseq approach to analyze SNP variation across selected native and invaded range populations of C. crystallinum, the present study found that North American populations clustered most closely with samples from the Canary Islands and Morocco in the Mediterranean Basin. These Mediterranean samples also showed a close genetic match to populations from the Cape Town region and Arniston Village in the native South African range. Although the Mediterranean Basin sample size was relatively small, the observed patterns are consistent with the hypothesis that C. crystallinum was first introduced from the Cape Town region to the Mediterranean Basin and subsequently from the Mediterranean to North America. This follows the same invasion history presented in van Steenderen et al. (Reference van Steenderen, Sandenbergh, Brookes, Moran, Cristofaro, Hoyer and Paterson2025) for Slenderleaf iceplant, Mesembryanthemum nodiflorum L. (Aizoaceae: Mesembryanthemoideae) and aligns with the biogeographic case studies discussed in Fox (Reference Fox, Di Castri, Hansen and Debussche1990).
There are historical records of the spread of C. crystallinum from South Africa to other parts of the world, beginning in the early 1700s (Kloot Reference Kloot1983). The plant was first transported to the eastern Mediterranean and was recorded in England by 1725 (Kloot Reference Kloot1983). The Mediterranean Basin is considered a historical hub of invasive plant exchanges, notably between South Africa, Chile, California, and southern Australia, which share regions with similar Mediterranean-like climates (Brunel et al. Reference Brunel, Schrader, Brundu and Fried2010; Fox Reference Fox, Di Castri, Hansen and Debussche1990). There are historical horticultural notes from England dating to 1748, in which C. crystallinum was referred to as a “curiosity at this date, and treated as a tender species grown on hot beds” (Minay Reference Minay1976). Records of its arrival in southern Australia are dated to 1851, and it became widespread in the country by 1879 (Kloot Reference Kloot1983).
Based on a genetic match to the invasive populations, surveys for prospective biological control agents in the native South African range should prioritize coastal sites in the areas surrounding Cape Town, particularly between Kalk Bay and Paternoster, and populations in and around Arniston Village. Considering that Cape Town was a popular stopping point for ships traveling between Europe, Asia, and Australia during the mid-1600s to the late 1800s, it is not surprising that C. crystallinum plants were collected from nearby sites as ornamentals. The plant has also been reported to be edible and to possess medicinal properties (Foster and Hobbs Reference Foster and Hobbs2002). We found that the populations farther north of Cape Town (Leipoldtville, Elands Bay, and Dwarskersbos) and on the south coast (Hawston Beach, Gansbaai, and Struisbaai) formed two genetically distinct clusters. Additionally, we found evidence of gene flow between these northern and east coast (Witsand and Port Beaufort) South African populations, although the mechanisms behind this are currently unclear.
Sampling was conducted at native range field sites as far north as Hondeklip Bay (approaching the Namibian border), where some plants displayed intermediate morphological traits. The present analysis found that these intermediate forms were outliers and represented a unique genetic cluster that is geographically isolated, and, based on the identification key in Gerbaulet and Hartmann (Reference Gerbaulet, Hartmann and Hartmann2017), could only be correctly identified as C. crystallinum. Because the Hondeklip Bay populations are genetically distinct and do not match the North American or Mediterranean populations, surveys should not prioritize these areas at present. A genetic comparison of the intermediate populations to C. crystallinum and C. guerichianum, however, could be of interest in future work. While the present study prioritizes native range surveys based on host-plant population structure, population genetic studies of the candidate weevil species would be a valuable next step to determine whether their genetic structure corresponds with that of the host and to further explore source matching for classical biological control.
The present study has provided evidence of genetic matching between the invaded range C. crystallinum populations in North America to Morocco and the Canary Islands in the Mediterranean Basin, and to native range populations in the area around Cape Town in the native South African range. However, this inference should be interpreted with caution, as many sites within the Mediterranean range were represented by small sample sizes, limiting the ability to fully characterize genetic diversity and population structure in that region. The high genetic diversity and number of private alleles in South Africa nevertheless support its status as the native range, while the lower diversity observed in the Mediterranean is consistent with an introduced rather than indigenous origin, despite some sources considering the species native there (POWO 2025). While any natural enemies found in the Mediterranean (particularly Morocco and the Canary Islands) are likely to be adapted to invasive genotypes of the plant in California, specialist natural enemies must have originated in the native distribution, not the Mediterranean. The area around Cape Town in the indigenous distribution is, therefore, the most appropriate area for the collection of locally adapted natural enemies for use as biocontrol agents, while broader sampling across the Mediterranean would help to further resolve relationships among invasive and introduced populations of this plant. The candidate weevils and other potential agents are present in that area and will be prioritized for further study.
Supplementary material
To view supplementary material for this article, please visit https://doi.org/10.1017/wsc.2026.10143
Acknowledgments
The South African Institute for Aquatic Biodiversity (SAIAB) is thanked for the use of its laboratory facilities, and the Centre for High Performance Computing (CHPC) for access to its computational platform. Swathi Singarayan is thanked for her assistance in the genetics laboratory at CSIRO, Brisbane, and Caitlin Balmer and Jackey Mukhawana are thanked for field collections in South Africa.
Funding statement
The authors acknowledge funding from the U.S. Department of Agriculture (USDA), and the U.S. Department of Defense, U.S. Navy, Naval Facilities Engineering Command Southwest. Funding was also provided by the South African Research Chairs Initiative of the Department of Science and Technology and the National Research Foundation (NRF) of South Africa. Any opinions, findings, conclusions, or recommendations expressed in this material are those of the authors, and the NRF does not accept any liability in this regard. The authors also wish to thank the Centre for Biological Control (CBC) at Rhodes University for financial support.
Competing interests
The authors declare no conflicts of interest.



 Open access

