

Introduction
Universal basic income (UBI) is becoming an increasingly salient policy proposal to reform the welfare state, given the current challenges such institutions are facing. The prospects of labour automatisation, potential structural unemployment derived thereof, and socio-demographic changes like the ageing of the population and lowering birth-rates are some of these (Armingeon and Bonoli, Reference Armingeon and Bonoli2006; Colombino, Reference Colombino2015; Frey and Osborne, Reference Frey and Osborne2017). The recent Covid-19 pandemic has exacerbated such challenges in the long-run, a development which has clearly evidenced the need for a social buffer (Johnson and Roberto, Reference Johnson and Roberto2020; Prabhakar, Reference Prabhakar2020; Ståhl and MacEachen, Reference Ståhl and MacEachen2020). Although the imperative for reforming the welfare state is pressing, the feasibility of such reform hinges upon public support. Against this backdrop, the underpinnings of public backing for a UBI are receiving growing attention in recent scholarship (see Laenen et al., Reference Laenen, Van Hootegem and Rossetti2023 or Rincón, Reference Rincón and Torry2023 for reviews).
Current scholarship has mostly focused on the individual-level determinants of UBI support. A consistent finding in this work is that being low-income, unemployed, young, and left-wing predicts support for this policy proposal (e.g., Vlandas, Reference Vlandas2020; Roosma and van Oorschot, Reference Roosma and van Oorschot2020). Yet, existing research does not provide evidence that this support translates into a genuine preference for a UBI over other competing policy alternatives. Hence, a critical puzzle remains unaddressed: is this support reflective of an underlying preference for UBI over other alternatives, or is it merely showcasing a demand for more government intervention and redistribution?
In this paper, I argue and show that, even if particular population sub-groups support a UBI, these should not prefer this policy over other means-tested alternatives. This is underpinned by three key factors: firstly, UBI challenges traditional welfare principles, questioning its legitimacy; its potential benefits, like redistribution and efficiency, aren’t immediately obvious; finally, UBI clashes with deeply ingrained deservingness criteria in welfare decisions. In this paper, I test whether support for a UBI translates in an actual preference for this policy alternative through a conjoint experiment fielded in Spain in March 2019.
The findings in this paper show that support for a UBI does not translate into an actual preference for this policy alternative. This paper conveys, in line with previous work, that individual characteristics such as being left-wing, do indeed predict support for the key features of a UBI, but also uncovers that in spite of such support, these individuals actually prefer means-tested alternatives over a UBI. These findings have important implications to the study of preferences and politics of welfare state reform. They suggest that previous research on UBI may have overestimated the political backing of this proposal, urging further investigation into the factors shaping preferences for UBI over other policies.
The rest of the paper is structured as follows. The following section presents the theoretical framework where the policy features of a UBI are outlined, and where I argue that it is precisely UBI’s universality and unconditionality that generate opposition to this proposal. The third section details the methods and the relevance of the case selection. Thereafter, the results are presented, and the paper closes with the concluding remarks.
Determinants of universal basic income support
Universal basic income is a cash transfer proposal, given to everyone (universal), on an individual and regular basis, and with no strings attached (unconditional). Like many other welfare cash transfers, a UBI is a multidimensional policy proposal, composed of several features, in this case: universality, unconditionality, individuality, a determined level of generosity (or quantity), and a specified set of legal requirements (De Wispelaere and Stirton, Reference De Wispelaere and Stirton2004). Its distinctiveness in relation to other cash transfer alternatives lies on the combination of universality and unconditionality. These two features define the absence of any target group, that is, all the population is eligible (universality), and the absence of any form of behavioural conditionality or strings-attached to receive this policy (unconditionality) (De Wispelaere & Stirton, Reference De Wispelaere and Stirton2004; Torry, Reference Torry2019; more on universality: Samuelson & Zeckhauser, Reference Samuelson and Zeckhauser1988; Anttonen & Sipilä, Reference Anttonen and Sipilä2014 specifically about unconditionality: Immervoll & Knotz, Reference Immervoll and Knotz2018). These two core characteristics have been shown to compromise its political viability, albeit with differences across contexts (Rincon, Reference Rincon2023; Rincón et al., Reference Rincón, Vlandas and Hiilamo2022). Yet, in spite of such findings research has also consistently shown that particular groups of individuals tend to show more support for this policy than others (a non-exhaustive list includes Vlandas, Reference Vlandas2019; Schwander and Vlandas, Reference Schwander and Vlandas2020; Fernández-Albertos & Manzano, Reference Fernández-Albertos and Manzano2016a; Lee, Reference Lee2021; Laenen & Gugushvili, Reference Laenen and Gugushvili2023; Rincón, Reference Rincón and Torry2023). Although this remains a solid finding, this scholarship does not clearly convey that such support translates into a preference for this policy proposal. This paper claims that this should not be the case for three main reasons.
First, a UBI represents a significant departure from existing welfare systems that typically involve selective cash transfers, often subject to means-testing or behavioural conditions. Even if some welfare states may rate higher in the principle universality than others (Esping-Andersen, Reference Esping-Andersen1990; Kangas & Kvist, Reference Kangas and Kvist2018), there is yet not one welfare state that counts with a universal and unconditional cash transfer. Cash transfer implementations generally rely on selectivity, introducing conditions or means-testing. A UBI hence, departs radically from any pre-existing cash transfer. While this doesn’t necessarily imply that it should be automatically unsupported, prior research has shown that established institutional frameworks play a significant role in shaping the norms of legitimacy and acceptability for public opinion through different mechanisms (Jordan, Reference Jordan2013; Larsen, Reference Larsen2006; Kumlin & Stadelmann-Steffen, Reference Kumlin and Stadelmann-Steffen2014). Consequently, some resistance to the adoption of a UBI is reasonable, considering the influence of established institutional norms.
Aside from this macro-level explanation of resistance to UBI, opposition also emanates from individual-level variables. In this sense, status quo bias refers to the human tendency to prefer the current state of affairs or the existing set of policies over potential new alternatives (Samuelson & Zeckhauser, Reference Samuelson and Zeckhauser1988), with compelling evidence of how this phenomena influences preferences for public policy (Arceneaux & Nicholson, Reference Arceneaux and Nicholson2023).
Opposition to UBI may also arise from its divergence from the principles of deservingness ingrained in current welfare policies. Deservingness literature shows that individuals support welfare policies that are targeted to those recipients deemed more worthy in terms of need, lack of control, reciprocity, identity, and attitudes (Oorschot, Reference Oorschot2000). Research suggests that these considerations tend to take precedence when individuals make decisions about which policies to endorse. In fact, research shows that deservingness heuristics are rooted in vital survival mechanisms from hunter-gatherer societies, evolved to facilitate resource distribution, prioritising those in need or making significant contributions to the group. Over time, these have become unconscious and automatic processes shaping present-day decision-making (Petersen, Reference Petersen2012, Reference Petersen2015).
However, it is precisely the universal and unconditional that fosters opposition that also renders this policy an appealing alternative to the existing configuration of cash transfers. However, the central argument of this paper posits that the potential benefits of UBI are not entirely intuitive and may not be fully understood by public opinion. Although it is beyond the scope of this paper to review these potential merits of a UBI, they are outlined briefly to explain how these may not be entirely clear to the broader population.
A UBI is often considered as a more efficient alternative to the current welfare provision of cash transfers, given the reduction of administrative costs, its bureaucratic simplicity, and the ability to overcome the problems of non-take-up and unemployment and poverty traps, and overall having a higher redistributive impact than existing schemes. First, the existing patchwork of cash transfer programs relies heavily on a complex bureaucratic machinery responsible for the administration of these transfers. Such infrastructure consumes a significant portion of the welfare budget. Transitioning to a single, straightforward cash transfer system would reduce such administrative costs substantially (Simanainen & Kangas, Reference Simanainen, Kangas, Kangas, Jauhiainen, Simanainen and Ylikanno2021; Immervoll & Knotz, Reference Immervoll and Knotz2018). Secondly, research shows that means-tested and conditional schemes often fail to reach the entire eligible population, a phenomenon referred to as the non-take-up problem (Van Oorschot, Reference Van Oorschot1991). Poverty and unemployment traps generated by current cash transfer programs could be prevented with a UBI that remains intact even when recipients receive additional sources of income (Gilroy et al., Reference Gilroy, Heimann and Schopf2013; Calnitsky, Reference Calnitsky2016). These mechanisms partly underpin the advantages of a UBI, an account for a heightened redistributive potential compared to existing alternatives (for other additional advantages see Groot, Reference Groot1997; Standing, Reference Standing2008; Davutoğlu, Reference Davutoğlu2013; Calnitsky, Reference Calnitsky2016). Nonetheless, this paper argues that such advantages are not immediately apparent to the public, and there is a degree of debate amongst experts too. Consequently, despite the potential benefits a UBI may offer, it appears more plausible to anticipate that it will attract more public opposition than backing.
With the previous considerations in mind, I now turn to revisit the political economy literature on preferences and empirical work on UBI support, to argue that even if the low-income, left-wing, and outsiders may show higher support for a UBI than their more secure and right-wing counterparts, these will still prefer means-tested and conditional alternatives.
Material self-interest
The material self-interest account of preferences posits that individuals, as rational beings and utility-maximisers will support policies that benefit them the most (Campbell, Reference Campbell1960; Lipset, Reference Lipset1960; Curtin & Cowan, Reference Curtin, Cowan and Strumpel1975; Meltzer & Richard, Reference Meltzer and Richard1981; AuClaire, Reference AuClaire1984; Hasenfeld & Rafferty, Reference Hasenfeld and Rafferty1989; Cook & Barret, Reference Cook and Barret1992; Gilens, Reference Gilens1995; Van Kersbergen, Reference Van Kersbergen2002). In this context, income is a prominent predictor of preferences. Given that those with lower incomes tend to benefit more from redistribution, the literature posits and empirically shows that lower incomes are more favourable to UBI (Vlandas, Reference Vlandas2020; Lee, Reference Lee2021; for a review of these findings see Laenen et al., Reference Laenen, Van Hootegem and Rossetti2023). However, paradoxically, lower-incomes also prefer policies that differ substantially from a UBI, like those targeted to the poor (e.g., Fernández-Albertos & Manzano, Reference Fernández-Albertos and Manzano2016b). The fact that low-income support both a UBI and targeted schemes may be reflective of an underlying demand for more government intervention. The key question remains, which of these policy alternatives do these individuals prefer, and why? Following the argument of material self-interest, people with low incomes are more likely to favor targeted schemes because they perceive them as directly redistributive. Targeted schemes are clearer in terms of who benefits and who loses, while the broader social benefits of a UBI may not be as obvious. Hence the first hypothesis is as follows:
H1. Low-incomes will prefer means-tested (targeted and conditional policies) over universal and unconditional ones.
However, income is not the only predictor of preferences from a material self-interested rationale. Given the changing nature of labour markets, one’s employment status and risk – be it subjective, occupational, or industrial – have been increasingly identified as prominent predictors of preferences (Moene & Wallerstein, Reference Moene and Wallerstein2003; Jæger, Reference Jæger2006; Emmeneggeret al., Reference Emmenegger and Häusermann2012; Hausermann & Schwander, Reference Hausermann, Schwander and Emmenger2012). Labour market transformations are challenging the fixed, stable, and long-term and full-time employment patterns characteristic of the past century, diversifying the experiences and attachment that individuals have to the labour market (Häusermann, Reference Häuserman2010; Hausermann & Schwander, Reference Hausermann, Schwander and Emmenger2012; Schwander & Häusermann, Reference Schwander and Häusermann2013; Busemeyer & Kemmerling, Reference Busemeyer and Kemmerling2020). While some population groups still enjoy secure employment forms and protection, others are experiencing more intermittent or discontinuous employment patterns – alternating with unemployment periods – and some encounter atypical forms of employment like part-time or temporary jobs. Dualisation literature distinguishes between this core workforce of protected workers – insiders – and a periphery of vulnerable and unprotected individuals – outsiders – and has shown that these individuals ultimately have different preferences, with insiders favouring insurance-based policies and outsiders favouring more investment or redistribution (Häusermann, Reference Häuserman2010; Häusermann et al., Reference Häusermann, Kurer and Schwander2015; Marx, Reference Marx2014; Schwander, Reference Schwander2019).
While UBI may serve both as an insurance or redistributive policy, the literature on UBI preferences has picked up on the theoretical underpinnings of dualisation research and argued that outsiders should be more favourable to a UBI, a prediction which has received empirical backing (e.g., Vlandas, Reference Vlandas2019, Reference Vlandas2020; Roosma & van Oorschot, Reference Roosma and van Oorschot2020). The prediction that outsiders should support a UBI more than insiders based on material self-interest is coherent and convincing, but should outsiders prefer this policy over targeted and means-tested schemes? This paper argues even if the benefits of a cash transfer safety net for outsiders may be somewhat more evident than for the low-income, outsiders should not prefer this form of cash transfer given potential free-rider concerns and deservingness considerations that have been outlined in the previous paragraphs. Outsiders may strongly benefit from a UBI for various reasons: it provides a safety net that could enable them to reject low-standard working conditions, provide permanent security in their discontinuous working patterns, represent an extra material buffer for low-wages, and given that this quantity is not associated to previous contributions it could be more appealing than other forms of welfare. However, their potential concerns for free riding of other individuals who do not participate in the labour market, and deservingness heuristics, alongside the reasons aforementioned at the beginning of this section, may chip in to prevent a higher support from outsiders towards this policy alternative. Hence, the second hypothesis is as follows:
H2. Outsiders will prefer means-tested policies and conditional ones over universal and unconditional ones.
Other regardingness
Building on the literature of welfare preferences, research on UBI support has also drawn on other-regarding accounts of preferences to explain support for this new policy alternative. In this vein, ideology has been said to be a key driver of support for UBI (Roosma & van Oorschot, Reference Roosma and van Oorschot2019; Vlandas, Reference Vlandas2019, Reference Vlandas2020; Chrisp et al., Reference Chrisp, Pulkka and Rincón García2020). More particularly, existing research theorises and empirically shows that being left-wing is a prominent predictor of UBI support. From a theoretical standpoint, this makes sense given that those of the left tend to show more egalitarian attitudes or favour more government intervention. Despite this, the literature documents a left-wing division of UBI support (Van Parijs, Reference Van Parijs2018; Schwander & Vlandas, Reference Schwander and Vlandas2020). Schwader and Vlandas (Reference Schwander and Vlandas2020) develop a micro-level explanation of why this is the case pointing at the different left-wing concerns for capitalism as the mechanism of discrepancy in support for UBI. They show that, concerns of exploitation and inefficiencies of free markets derived from capitalism are positively associated to UBI support, but those on the left concerned with the repression – or individual dependency on labour market for material survival – do not support a UBI (Schwander & Vlandas, Reference Schwander and Vlandas2020). This is particularly surprising given that it is UBI’s potential in de-commodifying labour, providing an exit strategy from the labour market, which has been much debated and appraised by the literature (Busemeyer & Kemmerling, Reference Busemeyer and Kemmerling2020). The fact that those most concerned with the repressive impact of the labour market do not support a UBI illustrates how the emancipatory and non-economic redistributive effects of UBI are not so evident, and that other considerations, like deservingness heuristics, may contribute to hinder support for UBI. Hence, the core expectation is that left-wing individuals still prefer means-tested alternatives.
H3a. Left-wing individuals will show higher support for means-tested and conditional policies, rather than universal and unconditional ones.
However, we know that the effect of ideology is far more complex in the case of a UBI. This is because the UBI has been advocated for as a tool to bolster the welfare state in some instances, while in others, it has been positioned as a means to scale back the welfare state – a stance that has garnered support from right-wing factions (Murray, Reference Murray2016). In this scenario, it is reasonable to expect that the effect of ideology is dependent on the UBI model presented. When it comes to UBI models, the literature broadly distinguished between two overarching UBI rationales: welfare enhancing, and welfare retrenching. The former defines a UBI that enhances welfare provision by providing a safety net to the whole population, avoiding the traps and cracks of existing welfare provision. This may imply that some cash transfers are replaced by this UBI, which simplifies the administration of welfare, but does not leave anyone worse off: it has an enhancing effect over welfare and does not threaten material subsistence. The purpose is to strengthen welfare provision, while also making it more cost-effective by reducing administration costs, but not to replace it. In this sense, the funding mechanisms may range from introducing or increasing a broad range of taxes but will exclude reducing expenditure of the core pillars of welfare provision. On the other hand, from a welfare retrenching perspective, UBI is conceived as a means to replace all of the existing welfare provision, not only cash transfers but universal services and core pillars such as health and education (Murray, Reference Murray2016).
Hence, I argue that the effect of ideology on support for UBI’s most characteristic feature – universality – is conditional on the UBI model presented, and more particularly, whether UBI is presented in a welfare retrenching or a welfare enhancing perspective. Key to this are the funding mechanisms employed. While I have theorised about the preferences of both left- and right-leaning individuals without accounting for funding mechanisms, the unanswered question is whether left-wing individuals would prefer a UBI over means-tested or targeted schemes if funded through progressive mechanisms, and similarly, if right-wing individuals would prefer it if funded through welfare retrenching methods. Following from the core argument of this paper, funding a UBI through progressive financing methods should not guarantee a left-wing preference for UBI given that the challenges outlined in the previous section remain in place. Hence, the final hypothesis is:
H3b. Left-wing individuals will show higher support for means-tested policies, rather than universal and unconditional ones, even when funded through progressive funding mechanisms.
Empirical strategy
Case Selection and data
I study support for UBI in Spain. This is a particularly relevant context given the saliency of welfare reform debate and UBI more precisely. Between 2017 and 2018 a field experiment was carried out to test the potential effects of a UBI in Barcelona, known as B-Mincome, and at the time of the survey, there was no clear ideological champion of the policy in the country.Footnote 1
Spain’s welfare model has been classified as the Mediterranean or Southern welfare state (Ferrera, Reference Ferrera1996), given that it was not included in the initial categorisation of Esping-Andersen (Reference Esping-Andersen1990) (but note that it was incorporated in the 1999 version). Spain’s welfare system is marked by a middle-level de-commodification, with high insurance components. This is particularly due to the unemployment benefits, which are generous but dependent on previous contribution, bearing resemblance to the continental type of welfare states and are also characterised by institutional fragmentation (i.e., private vs public employees, agricultural vs. other self-employed). Despite this, health provision in Spain however parallels Nordic or social democrat typology in its universal character, (Esping-Andersen, Reference Esping-Andersen1999). Overall however, Spain’s welfare model is highly dualised with a generous protection of insiders, and weak subsidies to those in irregular sectors or with more discontinuous employment patterns – i.e., outsiders (Ferrera, Reference Ferrera1996).
This leaves a group of ‘hyper-protected’ beneficiaries with generous protection schemes for sickness, maternity, or unemployment, and a second under-protected and vulnerable group, exacerbating labour market dualisation cleavages (Hausermann & Schwander, Reference Hausermann, Schwander and Emmenger2012). Specifically in Spain, it has been said that there are four, rather than two, different spaces depending on the different job/income and welfare opportunities combination: (1) a protected core of the labour market, (2) temporary and irregular unemployment, (3) underground sector, and (4) ex-employed or unemployed (Ferrera, Reference Ferrera1996; Carlos & Rodríguez, Reference Carlos and Rodríguez2020).
Crucial to this contribution however, in Spain’s cash transfer support network. At the time of the survey Spain did not count with a centralised, state-wide cash transfer system or minimum income scheme – in fact, it was not until June 2020, as a response to the coronavirus pandemic, that Spain accelerated the introduction of its first state-wide minimum income scheme. Until then, this form of assistance depended on the autonomous regions, which highlights another important characteristic of this welfare state: its decentralised nature.
Methods
This paper relies on data of a conjoint experiment that was embedded in a survey launched in Spain and fielded by a commercial polling agency (Netquest) in the month of March 2019. The sample (n = 1000) consists of a convenience sampleFootnote 2 from a pool of respondents chosen by Netquest, with quotas based on gender, age, and geographical region, and are representative of the Spanish population (see Appendix A1). The survey’s duration was of 15 minutes and was fielded using Qualtrics software.
This paper draws on a conjoint experiment given its relevance and adequacy to the research question. Conjoint experiments are specifically suited to unpack the trade-offs associated to multidimensional preferences (Hainmueller et al., Reference Hainmueller, Hopkins and Yamamoto2014; Hainmueller & Hopkins, Reference Hainmueller and Hopkins2015; Bansak et al., Reference Bansak, Hainmueller, Hopkins, Druckman and Green2019; Häusermann et al., Reference Häusermann, Kurer and Schwander2015). To do so, conjoint experiments break down every decision profile into its component parts: dimensions and attributes. In this case, dimensions represent the core characteristics shared by most welfare cash transfer – i.e., unit of recipient or benefit generosity – and attributes, which represent the varying characteristic within each dimension – i.e., in the case of recipients this could be households or individuals. Respondents then choose and rate each pair of profiles, with varying attributes, which then allows for analysing the relative impact of each of these features.
Given the relevance of conjoint experiments to assess the multidimensionality of preferences, research is increasingly employing this methodology to understand public opinion towards welfare policies (Gallego & Marx, Reference Gallego and Marx2016; Häusermann et al., Reference Häusermann, Kurer and Traber2019; Hankinson, Reference Hankinson2018), including basic income (Dermont & Stadelmann-Steffen, Reference Dermont and Stadelmann-steffen2019; Rincon, Reference Rincon2023; Rincón et al., Reference Rincón, Vlandas and Hiilamo2022). In this contribution, I follow previous work in employing a cross-policy design, looking at how support towards a series of different policy alternatives rather than looking at how varying characteristics within one specific policy alter support for the proposal in question.
Conjoint design
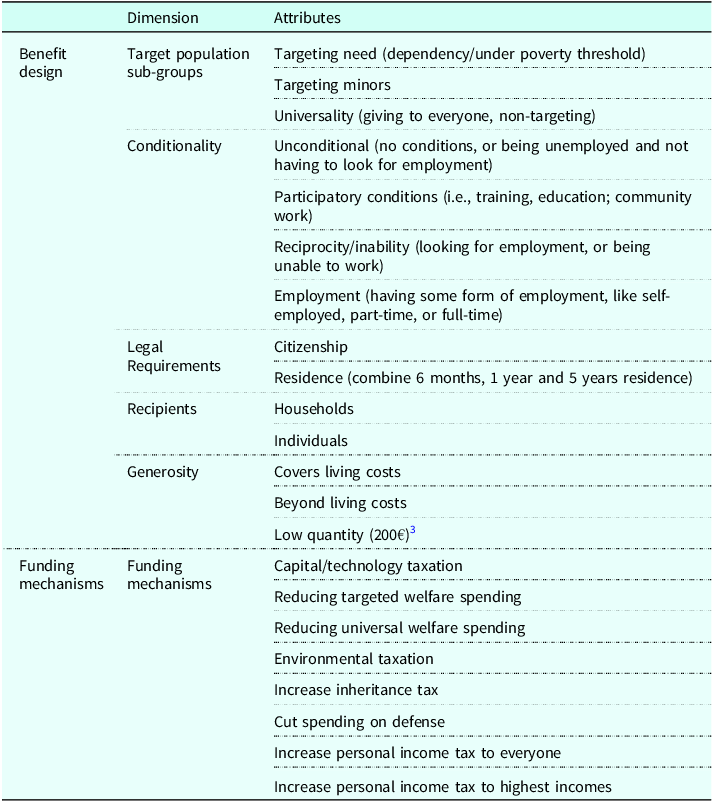
To understand how support for universal basic income compares to other policy alternatives I employ a fully randomised conjoint experiment, which varies in the attributes presented along six dimensions shared by income cash transfers, as described in Table 1, enabling the assessment of the causal impact of different cash transfer design characteristics on support for specific policy proposals. Table A2 in the appendix displays the full conjoint design with further justification. For the benefit generosity dimension, I use the quantity in euros (for more details, see Table A3 in appendix). The number of dimensions and attributes is similar to the ones used in most studies. This is the same design employed by previous work (references anonymised). However, this paper focuses on the two key dimensions which make a UBI distinctive of competing policy proposal: universality (that is, the absence of targeting) and unconditionality (that is, the lack of imposed conditions). These are two dimensions that make UBI distinctive of any other alternative. It is also the combination of these two features that come to represent the construct of a UBI Hence, support for UBI is operationalised as support given to each of these two characteristics (universality and unconditionality), compared to other alternative designs. Additionally, it is also understood as the support given to the interaction or combination of these two characteristics.
Conjoint design: dimensions and attributes as employed in the main analysis. The full conjoint design can be found in Appendix A2

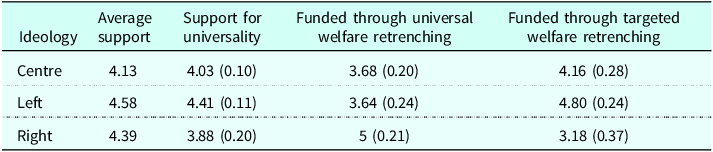
Average support levels of policies across ideology. The first column shows the average support level given to all cash transfers designs across ideology. The second column shows the main effects marginal mean for the attribute of universality. The third and fourth columns show the marginal mean of the attribute of universality interacted with two different forms of welfare retrenchment. The numbers in brackets indicate the standard errors

Respondents are shown two proposals, and they are required to select one of them and rate the two. This task is performed four times. A screenshot of the task is shown in Figure A4 in the appendix. Table A5 in the appendix details the wording of the questions included and describes the operationalisation of the two dependent variables: a forced choice (between the two policies shown to respondents in each round), and a support rate (given to each of the two policies per round). To ensure that task complexity was not an issue, the survey was pre-tested. Respondents were able to perform the conjoint tasks easily and the considerations in the experimental design resonated with respondents’ understandings of welfare.
To ensure data quality, all respondents who completed the questionnaire in less than 10 minutes were excluded from the analysis (note that the survey lasts for about 15 minutes). Observations which do not include the whole four conjoint rounds or provide inconsistent answers – i.e., that the forced choice and support rate dependent variable are incongruent – were also deleted.Footnote 4 This leaves a total of 748 observations. As robustness checks the same analysis I performed using only the two first conjoint rounds, where respondent satisficing should not be an issue (Bansak et al., Reference Bansak, Hainmueller, Hopkins and Yamamoto2018; Bansak et al., Reference Bansak, Hainmueller and Yamamoto2017). These results are available in the appendix and are consistent with the main results.
The analysis in this paper is based on the support rate dependent variable, given its relevance to the question under study. Appendix A5 shows the question wording and A6 a justification of this dependent variable. The analysis in this paper relies mainly on two quantities of interest. First, the Average Marginal Component Effect (AMCE), which is defined as the marginal effect of one attribute averaged over the joint distribution of other attributes (Hainmueller et al., Reference Hainmueller, Hopkins and Yamamoto2014; Häusermann et al., Reference Häusermann, Kurer and Schwander2015). Its interpretation is the probability of selecting one policy proposal when a particular attribute is present, in reference to a counterfactual level, which is set as the baseline category (Teele et al., Reference Teele, Lagan and Frances2018).
Marginal means, however, are increasingly seen as more appropriate for the analysis of sub-group preferences. The marginal mean, in contrast to the AMCE, does not count with a baseline or arbitrary reference category, so it is essentially representative of an attribute’s mean without taking into consideration the remaining factors (for a detailed overview of the methodological issues involved see Leeper et al., Reference Leeper, Hobolt and Tilley2018). Hence, I employ marginal means as the main quantity of interest in this paper – the AMCE is reported in the appendix. Section A7 of the appendix also details how the dataset is restructured for analysis.
Respondent characteristics
This paper is concerned with the preferences of particular sub-groups, where income, outsider/insiders status (operationalised through employment status), and ideology are key defining variables. Table A8 in the appendix summarises the survey questions where this information has been extracted from and the operationalisation of each variable.
Results
Does support for a UBI translate into an actual preference for this policy alternative? Results suggest that this is not the case overall. In line with our first hypothesis, the low-income do prefer means-tested policies over universal ones, but they do not prefer attaching behavioural conditions over unconditionality (see Figure 1). From a material self-interested perspective this seems coherent. The targeting/universality dichotomy refers to the means available to recipients. From a self-interested rationale, low-income should prioritise the targeting dimension, as it guarantees economic support for the low-income. We now turn to explore the joint effect of universality and unconditionality by interacting the dimension of target groups and conditionality (see A10 in appendix), the findings are in line with this previously detected preference for means-testing over universality. Results show that, while the universality and unconditionality combination do not seem more unpopular than several targeting and conditioning alternatives, the attribute of means-testing to low incomes and being employed attains a significantly higher rate of support than the combination of universality and unconditionality in line with a UBI. That is, means-testing and conditioning is preferred over a UBI.
Marginal mean analysis of the support rate dependent variable across different income groups. The vertical line indicates the average support rate. The dots are the marginal means, and the confidence level is set at .95. The two first attributes belong to the universality dimension (which population sub-groups are targeted) and includes universality or needs-based targeting. The second two attributes belong to the conditionality dimension and include no conditions and conditioning on need – inability to work or unemployed.

Contrary to what is suggested by previous research however, there are no significant differences in preferences across income groups in the support given to the attribute of universality and unconditionality, which contrasts with the prevailing finding in the research on UBI that shows that being low-income predicts support for this policy proposal (e.g., Roosma & van Oorschot, Reference Roosma and van Oorschot2020; Vlandas, Reference Vlandas2020). This finding is consistent and congruent with the interaction of target groups and conditionality dimensions (see Figure A10 in the appendix).
Nonetheless, an essential observation concerning preferences for conditionality worth highlighting is the divergence in preferences that arises between individuals with low and medium incomes in relation to other conditionality attributes. As it can be seen from Figure A9 in the appendix, low incomes do show significantly more support than medium incomes to other forms of conditionality, like those that require recipients to be employed in some way; while medium incomes show significantly more support to policies, which promote training, education, or volunteering. This resonates with potential demands of different income groups, like the working poor, which is a group that has been increasing in size recently (Bonoli, Reference Bonoli2005; OECD, 2009; Stier, Reference Stier and Ben-David2011; Levanon, Reference Levanon2018). In this sense, low incomes may be demanding a sort of salary complement to improve their living standards.
Moving to the hypothesis on outsider preferences, contrary to the expectations, I find mixed evidence that outsiders prefer targeted and conditional policies over universal and unconditional ones. Figure 2 shows that outsiders – the unemployed – do not give higher support to targeted and conditional policies; in fact, there are no significant differences in support rate across attributes (see Figure 2). In contrast, insiders – or the employed – do show significantly higher support to making policies selective based on need, over universal ones. In other words, the unemployed do not have a strong preference for the conventional design of welfare cash transfers. The interaction analysis of target groups and condition dimension shows no significant differences in support for the UBI model characterised by universality and unconditionality, relative to other configurations involving various conditions and means-testing (see Figure A13 in the appendix). This observation holds true not only for the unemployed but also for the employed population, where there are no statistically significant disparities in their policy preferences.
Marginal means of the support rate dependent variable across groups with different employment status. The vertical line indicates the average support rate. The dots are the marginal means, and the confidence level is set at .95. The two first attributes belong to the universality dimension (which population sub-groups are targeted) and includes universality or needs-based targeting. The second two attributes belong to the conditionality dimension and include no conditions and conditioning on need – inability to work or unemployed.

In line with the hypothesis, high-risk individuals show significantly higher levels of support for means-tested alternatives, over universal ones (see Figure 3 below). However, contrary to expectations, they show a preference for unconditional policies rather than conditional ones. Results reveal that high risk oppose making cash transfers conditional on being unemployed and looking for employment or being unable to work, which is indeed very striking as they should be the key winners of this type of policy. However, once we turn to the combined analysis of universality and unconditionality, we find that no combination of means-testing and conditionality is more popular than the UBI model of universality and unconditionality (see Figure A16 in the appendix). One reason for this is that it may be the case that the effect of the attributes within each dimension cancel out: that is, while means-testing is preferred, the (un)conditionality dimension matters less, hence, finding no effect.
A result that is particularly striking is the lack of significant differences in preferences between the employed-unemployed, and the high vs. low risk individuals,Footnote 5 especially in a highly dualised context like Spain, where welfare institutions exacerbate the inequalities derived from the labour market segmentation (Hauserman & Schwander Reference Hausermann, Schwander and Emmenger2012, in Emmenegger et al., Reference Emmenegger and Häusermann2012). However, these findings resonate with previous work on dualisation, which shows that in fact, the lack of preference gaps across these two groups (Emmenegger, Reference Emmenegger2009) may be explained by three potential mechanisms. First, individuals may be driven by their household material prospects rather than their individual status within the labour market (Becker, Reference Becker1981; Esping-Andersen, Reference Esping-Andersen1999; Pierson, Reference Pierson2001; Iversen & Rosenbluth, Reference Iversen and Rosenbluth2006, Reference Iversen and Rosenbluth2012; Emmenegger, Reference Emmenegger2010; Hausermann & Schwander, Reference Hausermann, Schwander and Emmenger2012). In Spain, the household income narrative aligns with the welfare system’s nature and heavy reliance on family support for income, making it theoretically plausible. However, the lack of significant differences across the preferences of different income groups suggests this may not be the most convincing explanation in this case.
Another possible explanation for the lack of preference divisions between insiders and outsiders is the poor working conditions experienced by insiders (Hausermann & Schwander, Reference Hausermann, Schwander and Emmenger2012), implying that while outsiders may face greater relative disadvantages in welfare institutions, insiders still lack security, aligning their preferences with outsiders. Additionally, the diverse profiles among outsiders may lead to heterogeneous preferences, further complicating the divide (Esping-Andersen, Reference Esping-Andersen1999; Kitschelt & Rehm, Reference Kitschelt and Rehm2005; Häuserman, Reference Häuserman2010).
Finally, I turn to explore how ideology shapes preferences towards UBI. Results show that left-wing individuals prefer policies that are means-tested, even if they show higher levels of support to universality and unconditionality than the centre-right individuals (see Figure 4). Unlike the targeting/universality dimension, those on the left do not prefer conditional alternatives more than unconditional ones, but they simply do not exhibit significant differences in their preferences within this dimension, also in line with the findings of different income groups. Taken together, this suggests that the conditionality dimension seems less contentious in terms of preferences, with the sole exception of the high-risk individuals – who prefer unconditionality over attaching conditions.
Marginal means of the support rate dependent variable across individuals with different levels of risk. The vertical line indicates the average support rate. The dots are the marginal means, and the confidence level is set at .95. The two first attributes belong to the universality dimension (which population sub-groups are targeted) and includes universality or needs-based targeting. The second two attributes belong to the conditionality dimension and include no conditions and conditioning on need – inability to work or unemployed.

Marginal mean analysis of the support rate dependent variable across ideology groups. The vertical line indicates the average support rate. The dots are the marginal means, and the confidence level is set at .95. The two first attributes belong to the universality dimension (which population sub-groups are targeted) and includes universality or needs-based targeting. The second two attributes belong to the conditionality dimension and include no conditions and conditioning on need – inability to work or unemployed.

A similar trend appears in the combined analysis of universality and unconditionality (Figure A19 in the appendix), where a similar trend is found: the marginal mean of the making policies means-tested and conditional on the basis of need is larger than that of universality-unconditionality for those on the left, even if, this difference is not statistically significant. Interestingly, this is not the case amongst those on the centre or right-wing, who show lower rates of support for a UBI’s universality and unconditionality combination. However, the results do not convey hardly any cleavages in preferences – or statistically significant differences in support – across ideological groups, with the exception of those on the right higher support for conditioning on need and means-testing over a UBI, more so, than those on the left (see Table 2).
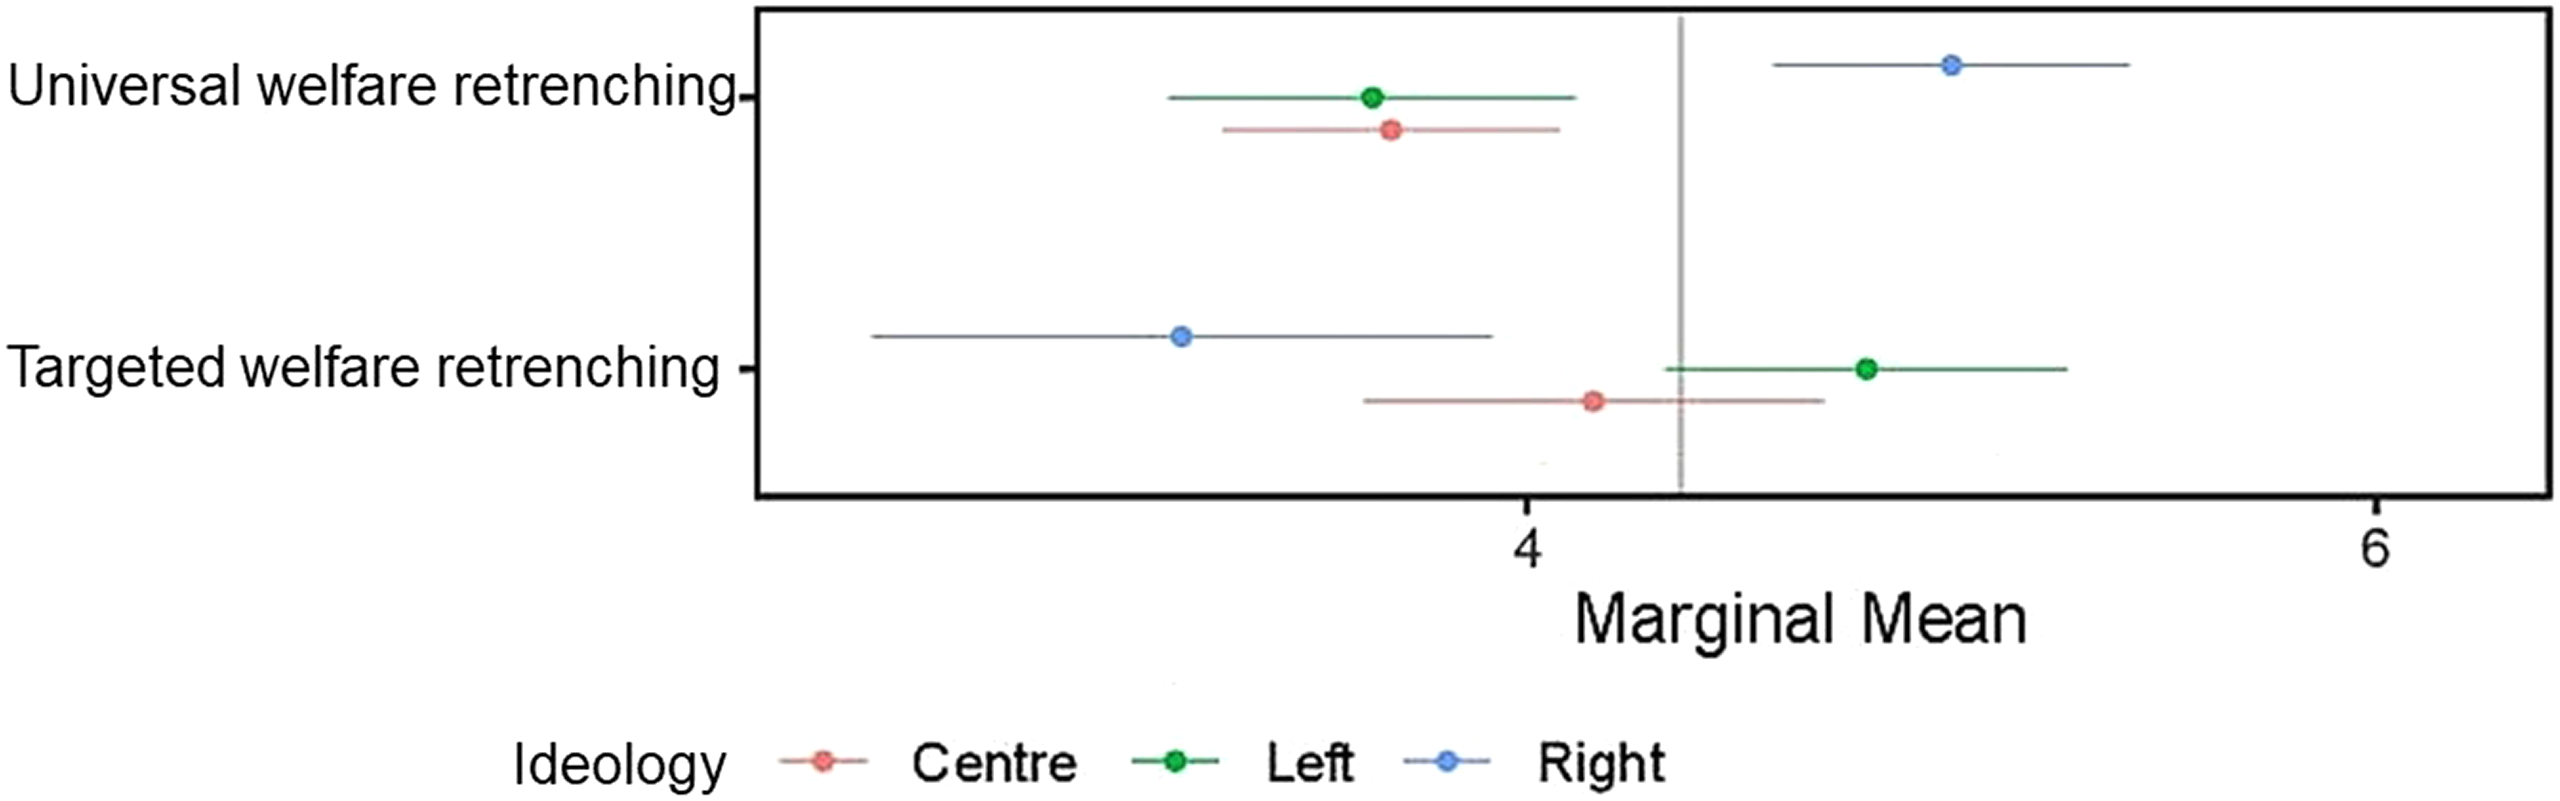
Does securing a UBI welfare-enhancing (retrenching) model ensure a preference for this type of cash transfer amongst the left-wing (right-wing)? There is no evidence that universal or unconditional policies are preferred over means-tested or conditional ones by those on the left (see Figures 5 and 6), even if funded through progressive funding mechanisms (e.g., increasing taxes to those with higher incomes or taxing corporations). Results do show however, that there are no significant differences in support for universality or means-testing once progressive funding mechanisms are secured, which is not the case for instance, when a cash transfer is funded through the retrenching of universal welfare expenditure (see Figure 5). This implies that once a cash transfer’s progressivity is ensured through funding mechanisms, its design isn’t controversial. Resistance from the left may stem more from its redistributive nature than its specific design.
Interaction between the target groups and funding mechanisms dimensions. The figure only shows the attribute levels of targeting and universality (for the targeting dimension) and two funding mechanisms for welfare retrenching – reducing targeted and universal welfare expenditure – as well as two progressive mechanisms -increasing personal income tax to highest income and increasing capital tax.

Interaction between the conditionality and funding mechanisms dimensions. The figure only shows the attribute levels of targeting and universality (for the targeting dimension) and two funding mechanisms for welfare retrenching – reducing targeted and universal welfare expenditure – as well as two progressive mechanisms – increasing personal income tax to highest income and increasing capital tax.

Do those on the right show a preference for a universal or unconditional cash transfer once it is funded through retrenching welfare state? Results suggest that this is the case. The marginal mean of universality is significantly higher than that of means-testing once the reduction of universal welfare spending is established as the funding mechanism.
An interesting finding emerges with regards to support for universality funded through the reduction of targeted welfare – i.e., pensions, housing, low-income support – those on the left show significantly higher support rates for this alternative than those on the right (see Figure 7). Although this finding may seem conspicuous it could be reflecting support for the concept of UBI as a welfare simplification tool – not retrenching – to the existing patchwork of social assistance benefits which is filled with administrative hurdles, employment and poverty traps, and stigma of conditional benefits, and the advocacy of one universal cash transfer that guarantees material existence as a universal right (McKay, Reference McKay2001; Van Parijs, Reference Van Parijs2018; Martinelli, Reference Martinelli2020). Nevertheless, an important remark here is that the statistical significance of this effect disappears in the robustness checks (see Appendix A11), so one cannot conclude that those on the left give more support than those on the right to universality funded through this mechanism.
Support for universality conditional on the funding mechanisms. The figure shows the marginal means across ideology groups for the interaction between target groups and funding mechanisms. The graph only includes the attributes which are theoretically relevant universality and welfare retrenching mechanisms. Robustness checks can be found in Figure A20.

Conclusion
Universal basic income has become a key alternative to reform the welfare state, which is facing an increasing number of challenges. Yet, who, and whether there is a key coalition of support remains an open question. Research indicates that individual traits such as low-income status, outsider identity, or left-wing ideology predict backing for this policy. However, it fails to establish whether this support reflects a true preference for the proposal over other options, which is crucial for understanding its political backing. This paper contends that despite certain groups showing greater support for UBI, it doesn’t necessarily signify a genuine preference for it. Three main reasons support this claim: firstly, UBI diverges significantly from conventional welfare norms, challenging established biases and deservingness judgements, further complicated by its non-intuitive advantages.
This paper reveals for the first time that while certain traits may forecast backing for UBI – e.g., being low-income or left-wing – individuals with these characteristics don’t necessarily favour UBI over other policies. For instance, low-income, high-risk, and left-leaning individuals still prefer means-tested schemes over universal ones.
These results have broad implications for both the research of preferences and the politics of welfare reform. The findings indicate no unified support for UBI, as even those with high backing for its key aspects prefer other policies. This highlights an overestimation of UBI’s political backing and emphasises the need to distinguish between support and preference. The support detected by previous work amongst the low-incomes, outsiders, and left-wing, seems to be rooted in a demand for government intervention rather than a true preference for UBI over other alternatives. Future work should examine why this is the case and explore other mechanisms that may explain an actual preference for a UBI.
Some conspicuous findings are worth discussing. It is particularly striking that income turns out not to be a predictor of universal and unconditional policies which contrast with previous research (Delsen & Schilpzand, Reference Delsen and Schilpzand2019; Roosma & van Oorschot, Reference Roosma and van Oorschot2019; Vlandas, Reference Vlandas2019, Reference Vlandas2020; Chrisp et al., Reference Chrisp, Pulkka and Rincón García2020). This suggests that UBI support identified by previous research might reflect a broader desire for government intervention rather than polarisation over UBI’s core traits. It aligns with studies showing distinct motivations for redistribution. In line with this research, I show that the giving to the poor side of social policy and redistribution do not prime the income-maximising motivations of individuals (Cavaillé & Trump, Reference Cavaillé and Trump2015).
A striking finding is the lack of preference cleavages across insiders and outsiders, which has been discussed in the paper. Future work could explore why this is the case, and how far this is related to perceptions about whether UBI is more effective for redistributive or insurance purposes, but also, to what extent a welfare institutional context which relies on families as key providers of welfare mitigates the effect of individual labour market indicators even in highly dualised societies.
Other important results have been reported, which unveil key dynamics of support. One of such findings is the conditional effect of ideology on support for UBI’s features and the UBI model presented. Ideology appears as a very polarising variable, albeit conditional on the policy attributes and interactions. First, important preference cleavages appear across ideology, which are not prevalent across material variables. Those on the left tend to give more support to all policy options, although their preferences follow a structure similar to the rest of their ideological counterparts: they prefer means-tested over universal alternatives. In line with previous work results here also convey the absence of an ideological cleavage in support for welfare (Fernández-Albertos & Manzano, Reference Fernández-Albertos and Manzano2016b), given that that reducing universal welfare is a funding mechanism that does not polarise the preferences of different ideological groups. Like this work, I do find ideological cleavages emerge in giving to the poor. However, a novel finding is that this logic changes when it comes to the restructuring of the welfare state. When a universal cash transfer is presented to replace existing welfare, right-wing individuals boost their support for universal welfare state retrenchment, which is penalised by those on the left. The implication of this finding is that welfare consensus in Spain is not as robust as otherwise thought, and it may likely crumble in the event of a welfare-restructuring proposition.
Another implication and key insight from this finding are that indeed, the ideological cleavages found in UBI support are not so much related to the policy design itself, as both those on the left and right hold the same preferences in terms of cash transfer design. However, accounting for the UBI model or the funding mechanisms, such preferences diverge quite more substantially: those on the left show no preference for means-testing over universality, while those on the right still demonstrate the preference for targeting.
This contribution does not come without its limitations. This paper relies on data from one country, but future research could explore in which ways these findings are transferrable to other contexts. Comparative welfare state research suggests that different welfare systems influence what aspects of welfare are important in public discourse (Larsen, Reference Larsen2008) and how individual traits impact preferences across contexts (Gingrich & Ansell, Reference Gingrich and Ansell2012). Further exploration in other settings may reveal differing roles of individual characteristics in shaping policy support or varying importance of UBI dimensions across countries. For instance, recent studies suggest that universality may not be a contentious issue in more universalistic welfare states (Rincón et al., Reference Rincón, Vlandas and Hiilamo2022).
Finally, this paper examines individual characteristics’ effects independently, overlooking their complex interactions in shaping preference schemes. Despite limitations, this study unveils for the first time whether support translates into a preference for UBI, identifying causal policy design effects, and detecting support dynamics among competing policy alternatives, essential to understand UBI politics and welfare reform.
Acknowledgements
I want to thank Heikki Hilamo for funding the data collection process. I also want to thank the attendees of the Political Behaviour workshop, held in Humboldt University May 2022, for their feedback and comments regarding this manuscript and its presentation. I also thank the EPSA 2022 attendees for their feedback during the presentation of this work.
Funding
Academy of Helsinki.
Competing interests
The author declares none.
Appendix A: General
A1. Respondent quotas. The table includes the final number and proportion of respondents per quota category, and the target or objective number and proportion.Footnote 6

A2. Full conjoint design, as respondents saw the options. Column 3 shows how the different categories were collapsed.

Each dimension presented in this table corresponds to distinct design characteristics of cash transfer programs. Every cash transfer program includes predefined elements such as a specified target population, a set of conditions (or lack thereof), a designated unit of recipients, and established legal requirements, as well as funding mechanisms. In the case of a UBI, the dimensions that align with its design are highlighted in bold. Conversely, dimensions lacking bold attribute levels signify that, according to the UBI definition, these specific attributes remain unspecified.
A3. Construction of the quantity dimension

A4. Screenshot of the one conjoint experiment task. Respondents saw the table in Spanish language.

The primary emphasis here lies in evaluating the impact of policy design and its attributes on public support for cash transfers. Consequently, we intentionally refrain from explicitly employing the term ‘universal basic income’ in our survey questions. This choice is rooted in our question set, which is tailored to explore diverse cash transfer alternatives within the framework of the welfare state. Moreover, it is noteworthy that the label ‘universal basic income’ may suffer from a lack of clarity in public comprehension due to its varied usage in different contexts, often leading to confusion with alternative cash-transfer models. For instance, the introduction of a minimum income scheme in Spain was misconstrued by many in Europe, including parliamentarians and the media, as an implementation of a UBI.
A5. Wording of the two questions and operationalisation of the dependent variables

A6. Jusitification of the dependent variable
The forced choice dependent variable has several caveats. First, it is an indication of the preferred option, but cannot grasp preference intensity. The forced choice may indicate the ‘least worst’ or ‘best of best’ option to respondents, but this quantity cannot account for the degree of support, or how much/less this alternative is liked/disliked than the competing alternative. The support rate, on the contrary, gives us both an indication of which policy is preferred and the degree of support towards it. Hence, it is a much more accurate and comprehensive measure than the forced choice. For this reason, the main analysis relies on the support rate dependent variable, although the forced choice is included in the appendix.
A7. Data reshaping process, dependent variables, and analysis
To perform the relevant analysis, I reshape current data so that each observation (data row) is a policy proposal k of a task j, presented to a respondent i. This means that for the total 748 respondents, leaving a total of 4,948 observations, where each observation is a policy package or profile, shown to one respondent, in one specific round, which was either selected or not. Each respondent observes two profiles at one time, completes four of each of these rounds, meaning that he/she observes a total of eight policy profiles. Each respondent is required to select one policy proposal from each pair and rate the two of them, which leaves us with two dependent variables – forced choice, and support rate. I code the first dependent variable Y1 – forced choice – as 1 if the policy proposal is selected, and 0 if it is the unselected policy proposal. The second dependent variable Y2, the support rate, is a number ranging from 0 to 10, depending on the support given to the policy proposal – both to the unselected and selected one. Each observation includes a vector of the attributes presented in that observation. Dependent variables Y1 and Y2 are modelled as a function of X, which a vector is containing the attributes that the respondents were exposed to. This can be analysed with a simple Ordinary Least Squares linear regression (Hainmueller et al., Reference Hainmueller, Hopkins and Yamamoto2014).
A8. Survey questions of key respondent characteristics and their operationalisation

Appendix B: Heterogeneous effects
B1. Income: Marginal means of the support rate dependent variable across income groups (full conjoint design)

B2. Robustness: Marginal means of the support rate dependent variable across income groups (full conjoint design) – including only the two first rounds

B3. Interaction between target groups and conditions, across income

B4. Dualisation: Marginal means of support rate across insiders and outsiders (employment status)

B5. Robustness checks. Dualisation: Marginal means of support rate across insiders and outsiders (employment status)

B6. Interaction between target groups and conditions, across employment status

B7. Dualisation: Marginal means of support rate across insiders and outsiders (Risk)

B8. Robustness. Dualisation: Marginal means of support rate across insiders and outsiders (Risk)

B9. Interaction between target groups and conditions, across risk

B10. Ideology: Marginal means of the support rate dependent variable across ideology groups (full conjoint design)

B11. Robustness: Marginal means of the support rate dependent variable across ideology groups (full conjoint design) – including only the two first conjoint rounds

B12. Interaction between target groups and conditions, across ideology

B13. Robustness checks: Marginal means across ideology groups within the interaction between target population sub-groups and funding mechanisms (full results), only including the two first conjoint round

B14. Scope conditions
In this section I discuss the validity and reliability of the findings. A first concern for the validity of the findings has to do with the complexity of conjoint choices and relevance of the task to respondents. To ensure that the conjoint tasks were not overwhelming to respondents, several survey pre-testing rounds were carried out. Individuals engaged with the task in a straightforward manner and the attributes resonated well with respondents’ notions and understandings of cash transfers.
Another related concern to the conjoint design could be whether these combinations are unlikely to appear in the real world, and to what extent this could compromise the validity of the findings. For instance, a respondent could observe a cash transfer proposal given to everyone, unconditional, of very generous quantity (above the poverty threshold level), financed by a reform of personal income tax by everyone; a combination which might not be feasible and therefore affects support levels. In all the pre-testing sessions, this concern did not arise among respondents. The economic feasibility of a UBI through different funding mechanism remains untested so there is no conclusive evidence of which combinations should be more or less realistic. Moreover, the specific quantities of taxation and the exclusivity of reliance on one funding mechanisms are not mentioned, increasing the potential feasibility of all combinations. Finally, it is key to allow room for testing the broad range of options that are currently discussed as funding mechanisms for welfare state reform, even if there is variance on how feasible these are. Enabling this broader set of combinations to be shown to respondents is relevant in research terms to be able to test how these combinations work.
A third concern related to the conjoint tasks is respondent satisficing. The pre-testing indicated that four rounds are an optimal number for respondent engagement. The number of tasks and dimensions is also very similar to the number found in previous work. Nevertheless, to eliminate concerns of respondent satisficing, I perform robustness checks, only with the two first rounds of responses, in order to ensure that findings are consistent throughout rounds. As outlined in the appendix, findings are generally robust and strengthen the case of the results here presented.