


One of the most important questions in political science is whether or how interest groups can gain political influence with campaign contributions. Because it is difficult to assess the causal effects of contributions on policy outcomes,Footnote 1 many instead look for clues revealed by interest group strategies. A striking observation is that interest group PACs spend much less on campaign contributions than legally allowed. For instance, an interest group PAC can give up to $5,000 per candidate per election. In the 2016 election cycle, the average PAC sponsored by a publicly traded company in the U.S. gave $5,000 or more to only seven federal candidates, and the median number is one.Footnote 2 Since PACs rarely reach these contribution limits, influential work in campaign finance argues that PAC contributions must generate minimal returns, or else there would be much more PAC money in politics than observed (Tullock Reference Tullock1972; Milyo, Primo, and Groseclose Reference Milyo, Primo and Groseclose2000; Ansolabehere, de Figueiredo, and Snyder Reference Ansolabehere, de Figueiredo and Snyder2003).
This argument, however, assumes interest group PACs could always give more to campaigns had they wanted to (except for the legal caps on contributions). Few scholars have examined internal factors that could constrain PAC contributions,Footnote 3 and, in particular, no research has explored the fundraising constraints on PACs’ ability to finance these contributions. The presence of fundraising and other constraints may not only shed new light on why there is little interest group money in elections, but also provide valuable insights into a wide range of questions about interest group strategy and power.
In this paper, I identify one such constraint: an interest group’s need to seek access by contributing across party lines could conflict with the heterogeneous partisan preferences of individual group members, whose voluntary donations are critical for PAC fundraising. On one hand, many PACs focus on gaining access or influence and, as a result, give predominantly to members of the majority party (Cox and Magar Reference Cox and Magar1999; Rudolph Reference Rudolph1999). On the other hand, contributions made by sponsored PACs, such as those representing corporations, must by law be financed solely with voluntary contributions from a restricted class of individuals, such as managers, shareholders, and employees. These restrictions continue to hold in the post-Citizens United era. While individual donors share an interest in their organization’s economic success, many also have strong and stable partisan preferences. Moreover, these preferences are often diverse even within the same organization, which could conflict with an interest group’s need to seek access no matter which party dominates Congress. Hence, insofar as donors withhold donations to access-seeking PACs when the latter support out-partisan politicians, access-seeking PAC contributions will inevitably undermine PAC fundraising and, by extension, its ability to gain policy access. While I focus on partisanship in this paper, my theory is agnostic to either partisanship or ideology as the salient donor preference insofar as they are strongly correlated (Bonica Reference Bonica2014; Barber, Canes-Wrone, and Thrower Reference Barber, Canes-Wrone and Thrower2017).
The existing literature has mostly black-boxed PAC fundraising. In particular, because access-seeking PACs are often analyzed as unitary and purely strategic actors, there has been no systematic examination of how donors’ partisan or ideological preferences affect the fundraising of these PACs. To this end, I conducted two studies: difference-in-differences analysis of campaign finance records as well as an original survey of PAC donors.
First, my difference-in-differences analysis of campaign finance records not only reveals that donors are less likely to give to access-seeking PACs when a greater share of PAC contributions go to out-partisan (rather than copartisan) candidates, but also demonstrates the rising trend as well as persistence in such effect on donor behavior. Using panel data (1990–2016) of contributions made by access-seeking PACs as well as donations made by individual donors matched to these PACs, I estimate a difference-in-differences model of donors’ decisions to give itemized donations to access-seeking PACs on the extent to which PAC contributions favor each donor’s preferred party. I identify this effect by comparing changes in the rates of giving by donors of different partisan leanings within the same PAC. Using this design, I show that, as access-seeking PACs increase the share of their contributions to one party, they lose donors who support the opposite party. Additionally, such an effect on donor behavior appears to have grown over time, coinciding with a rise in polarization (McCarty, Poole, and Rosenthal Reference McCarty, Poole and Rosenthal2016; Pew Research Center 2017). Moreover, as the proportion of PAC contributions to one party increases, eligible but inactive donors who prefer this party are more likely to start donating, while active donors who support the opposite party are more likely to permanently stop giving.
Next, I conducted my original survey of PAC donors to unpack the causal mechanism underlying my observational findings discussed above. First, the survey shows that individuals who donate to access-seeking PACs are highly knowledgeable of how their PACs allocate contributions across parties, and they often acquire such information through the same processes that employers use to politically mobilize employees (Hertel-Fernandez Reference Hertel-Fernandez2016), thereby suggesting that donors possess the information necessary to reward or punish PACs depending on how well PAC contributions align with their partisan preferences. Second, I replicate the key finding from my difference-in-differences analysis in an experiment in the survey on PAC donors. When shown hypothetical PAC solicitation letters in which a corporate PAC declares support for fictitious candidates, respondents report substantially lower willingness to give to the PAC when a greater share of those candidates are randomly assigned to be out-partisans rather than copartisans.
Both studies reveal a clear constraint on the fundraising of access-seeking PACs: these PACs alienate donors with a partisan preference when contributing to politicians of the opposite party. I thus provide a new perspective on why many interest groups give so little in PAC contributions: donors’ partisan or ideological preferences limit the fundraising of access-seeking PACs, thereby preventing interest groups from reaping the full benefits of PAC contributions, including such contributions’ important role in facilitating lobbying efforts (Langbein Reference Langbein1986; Hall and Wayman Reference Hall and Wayman1990; Powell Reference Powell2012; Kalla and Broockman Reference Kalla and Broockman2016). If polarization continues to rise, the constraints that individual donors impose upon interest groups may become increasingly binding, with uncertain normative implications on access-seeking interest groups’ impact on democratic representation and accountability.
Constraints imposed on interest groups by members’ partisan or ideological preferences may also provide valuable insights on other important interest group activities. These constraints may help to explain not only the surprising lack of corporate independent expenditures after Citizens United v. FEC (Bonica Reference Bonica2016a), but also the rise in donations to intermediary organizations that allow interest groups to subsidize major parties with little transparency (Grumbach and Pierson Reference Grumbach and Pierson2017).
Finally, I shed new light on why there is little interest group money in elections by examining how the partisan or ideological preferences of PAC donors limit PACs’ ability to fundraise and seek access. This paper thus opens a promising research agenda: advancing our understanding of enduring questions on interest group strategy and power by exploring new sources of constraints on groups (Hacker and Pierson Reference Hacker2002), especially those internal to organizations (Dahl Reference Dahl1959; Cyert and March Reference Cyert and March1963; Hart Reference Hart2004). Any theory of interest groups is incomplete without considering the constraints—partisan or otherwise—imposed by group members on whom interest groups critically depend.
HOW INTEREST GROUPS USE PAC CONTRIBUTIONS TO SEEK ACCESS
In this section, I outline why many interest groups adopt an access-oriented strategy in campaign giving, and how this could lead their PACs’ support for one party over the other to fluctuate over time. Many interest groups use PAC contributions to gain access to influential legislators (Denzau and Munger Reference Denzau and Munger1986; Romer and Snyder Reference Romer and Snyder1994; Powell and Grimmer Reference Powell and Grimmer2016). These contributions facilitate lobbying activities by purchasing precious face-to-face time with legislators and incentivizing policymakers to exert effort (Langbein Reference Langbein1986; Hall and Wayman Reference Hall and Wayman1990; Powell Reference Powell2012; Kalla and Broockman Reference Kalla and Broockman2016). By contributing to legislators who preside over the relevant bureaucratic agencies, interest groups could also obtain favorable regulatory outcomes (Gordon and Hafer Reference Gordon and Hafer2005; de Figueiredo and Edwards Reference de Figueiredo and Edwards2007). In short, access-seeking PACs may be able to shape the policymaking process to their advantage by investing in those with the most legislative clout.
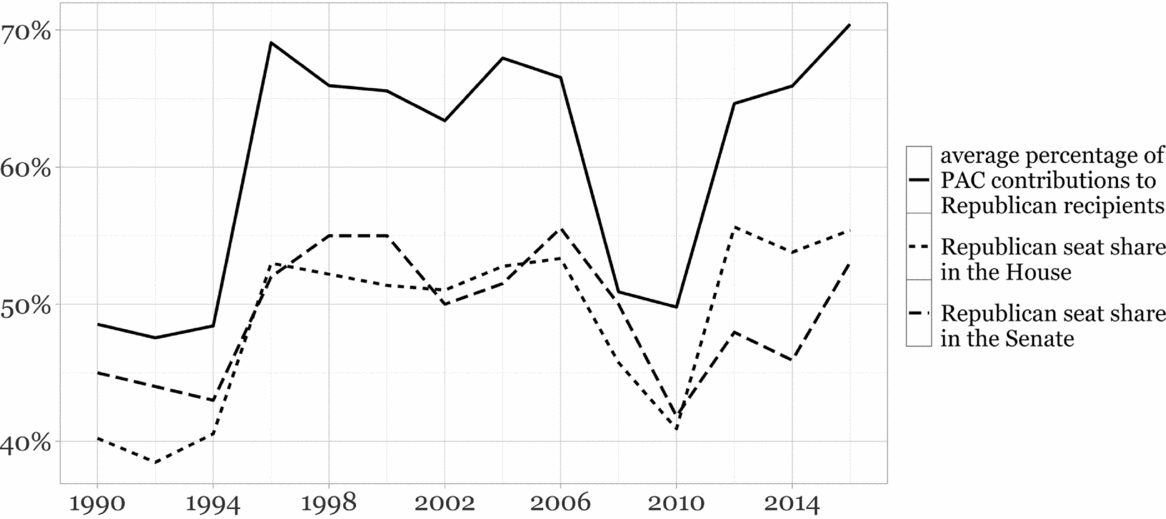
The process of access seeking often requires PACs to prioritize giving to members of the majority no matter which party dominates Congress. To target influential legislators, access-seeking PACs focus on candidate traits such as incumbency (Fouirnaies and Hall Reference Fouirnaies and Hall2014), seat safety (Bonica Reference Bonica2013), majority party status (Cox and Magar Reference Cox and Magar1999; Rudolph Reference Rudolph1999), committee membership and position (Grier, Munger, and Roberts Reference Grier, Munger and Roberts1994; Romer and Snyder Reference Romer and Snyder1994; Kroszner and Stratmann Reference Kroszner and Stratmann1998; Esterling Reference Esterling2007), party leadership (Heberlig, Hetherington, and Larson Reference Heberlig, Hetherington and Larson2006; Ban, Moskowitz, and Snyder Reference Ban, Moskowitz and Snyder2016), and procedural power (Fouirnaies and Hall Reference Fouirnaies and Hall2018). Given changes in majority control of Congress over time, the legislators most sought after by access-seeking PACs will not always come from the same party. As a result, contributions from access-seeking PACs are very much attuned to partisan swings in Congress. Figure 1 shows that for all PACs that OpenSecrets code as business PACs (Center for Responsive Politics 2018), the average share of PAC contributions to Republican candidates and party committees closely tracks Republicans’ seat shares in both chambers of Congress.
Contributions from Access-Seeking PACs Track Seat Shares in House and Senate

HOW INTEREST GROUP PACS RAISE FUNDS
Before access-seeking PACs contribute to influential legislators, they must first raise funds through a process that is prone to collective action problems. These PACs cannot draw on their parent organizations’ treasury funds. For example, Walmart is prohibited from writing a check to the PAC it sponsors. Instead, PACs connected to parent organizations can only solicit, with restrictions, individuals affiliated with the parent organizations.Footnote 4 For example, a corporate PAC can ask for donations at any time from only the firm’s executive and administrative personnel, stockholders, and families of the first two. In addition, it may fundraise up to twice a year from other employees and their families who do not fit into the previous categories.
Because of legal restrictions on donations to access-seeking PACs, mobilizing a wide range of eligible donors is critical to their fundraising success. The parent organizations sponsoring PACs must not coerce or bribe individuals into donating to the PACs. Moreover, each eligible donor can give no more than $5,000 to their PAC per calendar year,Footnote 5 and a typical donor gives less than one-twentieth of this threshold.Footnote 6 To put this in perspective, the contribution limits faced by an access-seeking PAC to candidates and party committees are between $5,000 and $45,000 per election depending on recipient type. So, to be able to contribute to a wide range of recipients, access-seeking PACs will have to rely on more than their top personnel for funding.
However, persuading most prospective donors to give need not be easy. Even though strategic PAC contributions may advance the bottom line of the parent organizations (Jayachandran Reference Jayachandran2006; Akey Reference Akey2015; though see Ansolabehere, Snyder, and Ueda Reference Ansolabehere, Snyder and Ueda2004; Fowler, Garro, and Spenkuch Reference Fowler, Garro and Spenkuch2017), such benefit accrues to organizational members regardless of whether they have donated to the PAC, thus producing a collective action problem. While the top personnel might have a sufficiently large stake in the economic success of the organization to find donating worthwhile, each of them can give no more than $5,000 per year to their PAC. For other eligible donors, the marginal benefit to their donations might not justify the cost (Olson Reference Olson1965).
To tackle this collective action problem, organizations sponsoring access-seeking PACs provide various benefits to induce giving, though it is unclear how well these tactics work. Many encourage employees to authorize payroll deductions to maintain a steady stream of incoming donations, although the Federal Election Commission (hereafter the FEC) requires such programs to be opt-in rather than opt-out (Sabato Reference Sabato1985). Additionally, the parent organizations sponsoring these PACs offer various selective benefits to donors, from casino nights to golf tournaments to “high-donor clubs” (Sabato Reference Sabato1985). However, these selective benefits not only constitute a costly means to sustain donations (Wilson Reference Wilson1973; Moe Reference Moe1980), but also risk violating campaign finance regulations (Berman Reference Berman2014).
Furthermore, even though coercion is expressly forbidden, the parent organizations of access-seeking PACs often try to cultivate a norm of giving (Sorauf Reference Sorauf1984). Again, however, its effectiveness on boosting PAC fundraising has not been empirically evaluated and might, in fact, be limited. Social pressure, especially when coupled with monitoring, could help access-seeking organizations overcome collective action problems in many realms of political mobilization (Hertel-Fernandez Reference Hertel-Fernandez2017). But the general pressure to conform might not be sufficient to mobilize many prospective PAC donors, since giving to one’s PAC entails a greater personal cost than other forms of political participation that need not conflict with one’s partisan or ideological preferences. An employer could, for instance, arrange for Democratic-leaning workers to contact influential legislators on the Democratic side, and Republican-leaning workers to Republican legislators. In contrast, since each organization is allowed to sponsor only one PAC, prospective donors cannot give to access-seeking PACs without compromising their partisanship or ideology at some point. The institutional structure of access-seeking PACs could thereby undercut the effectiveness of using social pressure to solicit donations.
THEORY: DONORS’ PARTISAN PREFERENCES CONSTRAIN PACS’ ABILITY TO RAISE FUNDS AND GAIN ACCESS
When payroll deductions, selective benefits, and social pressure are insufficient to induce donations to access-seeking PACs, other motivations, particularly purposive benefits (Clark and Wilson Reference Clark and Wilson1961),Footnote 7 could become pivotal in individual donors’ decisionmaking (Wilson Reference Wilson1973; Moe Reference Moe1980). In the context of PAC fundraising, I argue that one particularly salient purposive incentive is donors’ partisan or ideological preference.
Stated formally, my main hypothesis is that donors with partisan preference should be less likely to donate to their affiliated access-seeking PACs when a greater share of PAC contributions go to out-partisan (rather than copartisan) politicians. Note that while I focus on partisanship in this paper, it could also be a proxy for individuals’ ideological preferences (Bonica Reference Bonica2014; Barber, Canes-Wrone, and Thrower Reference Barber, Canes-Wrone and Thrower2017). In the remainder of this section, I argue that this hypothesis, if true, implies that partisan preferences of donors can significantly constrain PACs’ ability to raise funds and thereby obtain access. Additionally, I provide three reasons for why this hypothesis could be true.
To see why donors’ partisanships could affect the strategic success of access-seeking PACs, it is worth emphasizing that the share of PAC contributions to one party versus the other may influence not only the rate of returns to PAC contributions, which motivates much of the existing literature on PACs’ contribution patterns, but also the amount of fundraising. These components jointly determine the total returns to PAC contributions (in the simplest case, total returns would be the product of the two). If PAC donors behave as I hypothesize, access-seeking PACs may have to strike a compromise between increasing the per-dollar rate of return to PAC contributions, and raising more donations from eligible PAC donors.Footnote 8 Consider the case of Google whose PAC appears to have a predominantly liberal donor base.Footnote 9 Under the current government, if Google’s PAC prioritizes giving to members of the majority (Republican) party, it might get more bang for the buck for its PAC contributions at the expense of fundraising. If Google’s PAC instead tries to raise more donations by focusing on giving to Democratic legislators, it might reduce the effectiveness of its PAC contributions in gaining valuable access and influencing policymaking.
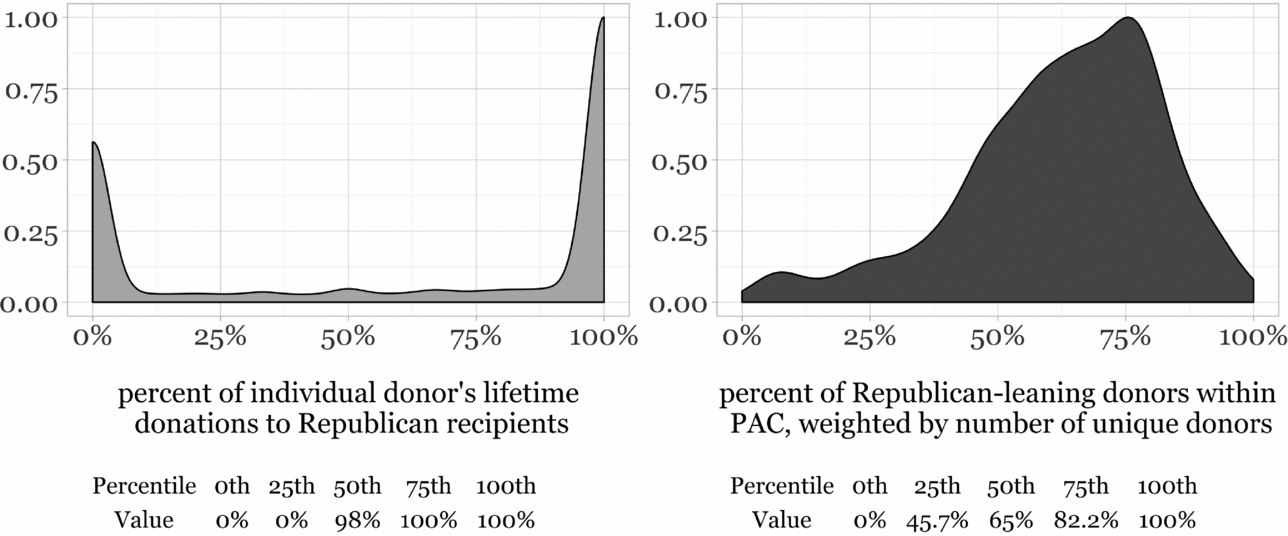
Having discussed why PAC donors’ partisan preferences might limit a PAC’s ability to obtain access and gain influence, I now turn to three factors that lend support for my hypothesis that PAC donors’ willingness to give decreases in the share of PAC contribution to out-partisan politicians. First, many PAC donors have strong and stable partisan preferences. For example, among PAC donors who have given directly to candidates or party committees, 77% have only given to one party in their lifetime. This is evident in the left panel of Figure 2, which shows the full distribution of the proportion of individual PAC donors’ lifetime donations to Republican recipients, calculated using OpenSecrets data (Center for Responsive Politics 2018). Interestingly, there is considerable diversity in donors’ partisan preferences even within the same PAC. As the right panel of Figure 2 shows, when weighted by the number of unique donors in each PAC, the share of Republican-leaning donors within a PAC follows a unimodal distribution. In other words, no matter which party dominates Congress, there will almost always be many prospective donors to access-seeking PACs who find their PACs’ support for the majority party at odds with their own partisan or ideological preference.
Scaled Density Plots of Donors’ Inferred Partisan Preferences

The second condition that may make donors’ partisan preferences salient for fundraising is that PAC contributions are one of the most divisive and visible forms of interest group participation in politics. Campaign contributions directly help to finance the elections of office seekers, who not only bear partisan labels but also push for a broad range of policies that can be polarizing if not controversial (Halper Reference Halper2014). Moreover, donors can learn about where PAC contributions are going in a timely manner. PAC contributions are disclosed each quarter, and such information is easily obtainable on both the FEC’s web site and www.opensecrets.org. Additionally, my original survey of corporate PAC donors shows that they have access to numerous other information channels and, as a result, are highly knowledgeable of how their PACs allocate contributions across parties. In short, by directly and publicly inserting themselves into electoral politics, access-seeking PACs are particularly prone to upsetting prospective donors on partisan grounds.
The third reason why donors’ partisan preferences may matter for the fundraising of access-seeking PACs is that the exclusive governance structures of these PACs leave little choice but exit for donors who dislike the politicians that their PACs support. For many access-seeking PACs, the top personnel of the parent organization, such as the chief executive officer or the director of government affairs, not only appoint members of the PAC boards but also direct their day-to-day activities (Sabato Reference Sabato1985; Hart Reference Hart2001). The rest of the board typically consists of representatives from different departments or regional branches (Sorauf Reference Sorauf1984; Sabato Reference Sabato1985). The board decides whom the PAC should contribute to as well as how to fundraise. The rank-and-file members, in contrast, have little say in where their donations to their PAC would ultimately end up (Sabato Reference Sabato1985; Hart Reference Hart2004). When prospective donors disapprove of their PACs’ choice of candidates or parties, the only effective means of protestation is to withhold donations.
THE ROLE OF DONORS’ PARTISAN PREFERENCE: WHAT WE KNOW
While the existing literature has not examined whether the partisan preferences of donors affect the fundraising outcomes for access-seeking PACs, it generally supports this plausibility. Grossman and Helpman (Reference Grossman and Helpman1996, p. 270) speculate that individual donors might object to interest group PAC contributions on ideological grounds in spite of shared material interest, but there has been no formal-theoretical prediction of how donors’ partisan or ideological preferences affect PAC fundraising. Descriptive work by Sorauf (Reference Sorauf1984) and Sabato (Reference Sabato1985) on access-seeking PACs includes anecdotes of PACs’ choice of candidates offending donors, but says nothing about whether such emotions translate into donor actions.
Among recent work, Lowry (Reference Lowry2013) finds that donations to access-seeking PACs (and other sponsored PACs), when aggregated at the congressional district level, are not sensitive to factors such as electoral competition or presidential cycles that would typically affect electorally motivated donations. This suggests donors might not be taking their partisan or ideological preferences into account when giving to access-seeking PACs, although Lowry (Reference Lowry2013) recognizes the limits to causal inference from ecological analyses.
Min and You (Reference Min and You2015) find that activist shareholders (e.g., public pension fund and union investors) target corporations whose political activities conflict with the partisan or ideological preferences of these shareholders (e.g., corporations that predominantly donate to Republican politicians). This lends support to the conjecture that shareholders and other eligible PAC donors might also constrain the fundraising of access-seeking PACs due to partisan or ideological disagreements.
Bonica (Reference Bonica2016a) shows that corporate executives, unlike the PACs they preside over, behave like ideologues rather than investors when donating to candidates on their own. Moreover, there is a remarkable degree of heterogeneity in political ideologies even on the same corporate board. The prevalence of bipartisan boardrooms, Bonica (Reference Bonica2016a) argues, could account for why corporate PACs appear moderate in their contribution patterns, for otherwise a clear partisan or ideological bias in PAC giving could antagonize elite donors. That being said, we do not know this for sure without a systematic examination of how donor behavior depends on the degree to which access-seeking PACs support politicians that share the donors’ partisan preferences.
STUDY 1: DIFFERENCES-IN-DIFFERENCES ANALYSIS OF CAMPAIGN FINANCE DATA
Using difference-in-differences analysis of campaign finance records, I first verify that patterns of real giving are consistent with my main hypothesis: access-seeking PACs lose donors with a partisan preference when giving to politicians of the opposite party. In particular, such impact on donor behavior appears to have grown in time, coinciding with a rise in polarization (McCarty, Poole, and Rosenthal Reference McCarty, Poole and Rosenthal2016; Pew Research Center 2017). Moreover, these effects also appear to be long-lasting: eligible but inactive donors are more likely to start giving when the share of PAC contributions to their preferred party increases, and active donors are more likely to permanently stop giving when changes in PAC contributions benefit the party they oppose.
I examine PACs that are coded as business PACs by OpenSecrets (Center for Responsive Politics 2018).Footnote 10 I then construct a panel of individual-to-PAC as well as PAC-to-candidate/party committee contributions for cycles 1990–2016 using OpenSecrets data (Center for Responsive Politics 2018). Section A.2.2 of the appendix contains descriptive summaries of the data.
Empirical Strategy
I employ the following difference-in-differences design:Footnote 11
 $$\begin{equation}
Give_{ijt} = \alpha _{ij}+\tau _{jt}+\beta (Indiv\_R_{i} \times PAC\_R_{jt}) + \epsilon _{ijt},
\end{equation}$$
where i denotes an individual donor, j represents a PAC, and t indicates a 2-year federal election cycle. The outcome variable, Give ijt, is an indicator that equals 1 if and only if donor i gave any itemized donation to PAC j during cycle t.Footnote 12 On the right-hand side of Equation (1) are two fixed effects, one for each donor-PAC dyad (αij) and another at the PAC-cycle level (τjt). In addition, the main independent variable of interest is the product of two variables:  $Indiv\_R_{i} \in [-1/2, 1/2]$, the net share of donor i’s lifetime donations to Republican (as opposed to Democratic) candidates and party committees, and
 $PAC\_R_{jt} \in [-1/2, 1/2]$, the net share of PAC j’s contributions to Republican (as opposed to Democratic) candidates and party committees during cycle t.
 $Indiv\_R_{i}$ is a reliable measure of individual donors’ partisan leanings because, as the left panel of Figure 2 shows, 77% of all donors in my sample have given to only one party in their entire donation histories (so
 $Indiv\_R_{i}$ mostly clusters at either −1/2 or 1/2). Barber, Canes-Wrone, and Thrower (Reference Barber, Canes-Wrone and Thrower2017) also independently validate my method of classifying donors’ partisanship. As usual, I do not preclude the possibility that my measure of partisanship is a proxy for ideology. Note that I do not separately control for
 $Indiv\_R_{i}$ or
 $PAC\_R_{jt}$ because the donor-PAC fixed effect (αij) absorbs the former while the PAC-cycle fixed effect (τjt) absorbs the latter. I cluster all standard errors at the PAC level.
Since  $Indiv\_R_{i}$ represents donor i’s time-invariant relative preference for the Republican Party, and
 $PAC\_R_{jt}$ measures PAC j’s relative support for the Republican Party in cycle t, their product captures the degree of alignment between PAC j’s contributions during cycle t and donor i’s partisan preference. Therefore, my hypothesis is that β > 0 in Specification 1.
I identify β by comparing within-person changes in rates of giving by donors of different partisan leanings belonging to the same PAC. This becomes clear once the donor-PAC fixed effect αij and the PAC-cycle fixed effect τjt are differenced out of Specification 1, resulting in
 $$\begin{eqnarray}
\Delta _{t}Give_{ijt} - \Delta _{t}Give_{i^{\prime }jt} &=& \beta (Indiv\_R_{i}-Indiv\_R_{i^{\prime }})\nonumber\\
&& \times \Delta _{t}PAC\_R_{jt} + \xi _{ii^{\prime }jt},
\end{eqnarray}$$
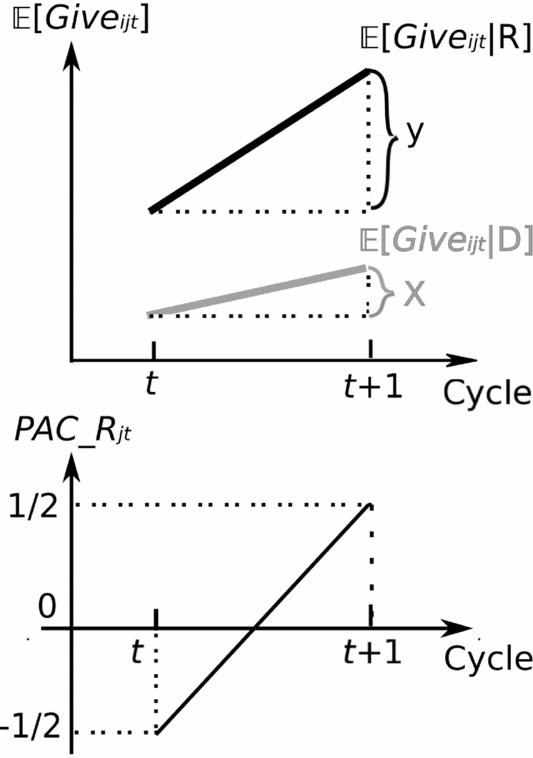
where donor i and i′ both belong to PAC j, and ξii′jt = Δtεijt − Δtεi′jt. For a visual representation of the identification strategy for β in Equation (2), consider a hypothetical PAC j where, for simplicity, I assume that every PAC donor is either a pure Republican (i.e.,  $Indiv\_R_{i}=1/2$) or a pure Democrat (i.e.,
 $Indiv\_R_{i^{\prime }}=-1/2$). Suppose PAC j gave only to Democratic recipients during cycle t (i.e.,
 $PAC\_R_{jt}=-1/2$) and exclusively to Republican recipients in the next cycle (
 $PAC\_R_{j,t+1}=1/2$), as shown in the bottom half of Figure 3. If the average rate of Republican donors giving to PAC j changed by y between the two cycles, and the same average rate for Democratic donors changed by x, then β = y − x is the causal effect of the degree of alignment between PAC contributions and donors’ partisan preferences on rates of itemized donations, as shown in the top half of Figure 3. Suppose β = 0.10, the interpretation would be that as a result of a full-unit increase in the share of PAC contributions to one party across consecutive cycles, the change in the absolute probability that donors who prefer said party will donate to the PAC will be 10 percentage points higher than that for donors who prefer the opposite party.
Visual Representation of the Difference-in-Differences Design

The two fixed effects in Specification 1, αij and τjt, control for all time-invariant donor attributesFootnote 13 as well as PAC-specific time trendsFootnote 14 that could confound the estimate of β. Therefore, causal identification of the treatment effect β in Specification 1 relies on a parallel-trends assumption: that within a given PAC over time, observed rates of itemized giving across donors of different partisan leanings would have the same counterfactual trends if the allocation of PAC contributions across parties in each election cycle were held constant. In Section A.2.5 of the online appendix, I show that estimates obtained from a modified Granger causality test are indeed consistent with the null hypothesis of no differential trends. Moreover, in the online appendix, I show that estimates obtained from Specification 1 are robust to (1) regressing on lagged rather than same-cycle PAC contribution patterns (Section A.2.6), (2) using a plausible instrument for PAC contribution patterns (Section A.2.7), and (3) controlling additionally for a proxy of potential confounding trends (Section A.2.8). In all three cases, I obtain estimates that are qualitative identical and quantitatively similar to those from Specification 1.
Because OpenSecrets' data spans 14 election cycles (Center for Responsive Politics 2018), I also explore two types of dynamic patterns. First, I examine whether the treatment effect, β, has changed over time by allowing it to have a linear time trend. Second, I test for persistence in the treatment effect on donor behavior. One such persistent effect is entry: eligible but inactive donors might be more likely to start donating to access-seeking PACs when a greater share of PAC contributions support their preferred party. I construct Entry ijt which equals 1 if donor i’s first itemized donation to PAC j occurred in cycle t; equals 0 for all cycles prior to t; and is coded as NA for all cycles after t. When substituting the outcome variable in Specification 1 with this indicator for donor entries, I expect the estimated coefficient on  $Indiv\_R_{i} \times PAC\_R_{jt}$ to be positive.
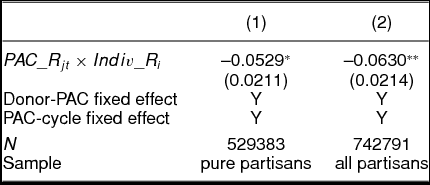
At the same time, active donors might be more likely to permanently stop donating following a decline in the share of PAC contributions to copartisan candidates. To capture such exit effect, I construct Exit ijt such that it equals 0 if donor i gave an itemized donation to PAC j in cycle t; equals 1 if donor i permanently stopped making such donations to PAC j since cycle t; and is coded as NA for all other cycles. Since exits should be inversely related to donors’ willingness to give, I expect  $Indiv\_R_{i} \times PAC\_R_{jt}$ to have a negative estimated coefficient when I substitute the outcome variable in Specification 1 with this indicator for donor exits.
Results
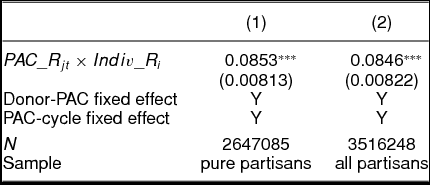
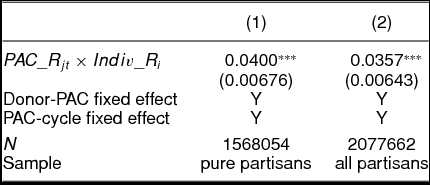
Consistent with my hypothesis, donors are less likely to give itemized donations to access-seeking PACs when the share of PAC contributions to copartisan recipients declines. Table 1 presents the coefficient estimates for two versions of Specification 1, where the outcome variable is Give ijt, an indicator for whether donor i gave any itemized donation to PAC j during cycle t. The first column shows estimate treatment effect on the subset of PAC donors who are “pure partisans,” i.e., they each have only given to recipients of one party throughout their donation histories. In comparison, the second column use “all partisans,” i.e., all donors that have given direct donations to recipients of either party.
Differences-in-differences Estimates for Give ijt

Standard errors are clustered at the PAC level and reported in parentheses.
* p < 0.05, ** p < 0.01, *** p < 0.001
In both cases, the estimated treatment effect  $\hat{\beta }$ is statistically significant and positive. Consider this baseline: pure partisan donors give itemized donations to access-seeking PACs at an average rate of 0.122 per cycle. Using column 1 of Table 1 as reference, the absolute rate of giving for pure partisan donors aligned with one party declines by 0.00839, or a 6.89% reduction from the baseline, for a one-standard deviation decrease in the residualized share of PAC contributions to the same party (19.7 percentage points).Footnote 15 And the opposite effect holds for pure partisan donors who support the opposite party.
One should note that limitations of campaign finance records may considerably attenuate the estimates shown in Table 1. Recall that the outcome variable, Give ijt, equals 0 whenever donor i did not make any itemized donation to PAC j during cycle t. This could occur either because donor i chose not to donate, or because donor i was simply ineligible to give (e.g., donor i had not joined the parent organization of PAC j in cycle t or had already left the organization by then). Because the two scenarios are indistinguishable in campaign finance records, the coefficient estimates for the interaction term  $PAC\_R_{jt} \times Indiv\_R_{i}$ reported in Table 1 may be biased towards zero by the inclusion of donor-cycles during which donors were ineligible to give and hence were not “treated” by changes in the allocations of PAC contributions across parties.
There is suggestive evidence that the treatment effects shown in Table 1 have risen over time. When I allow for a linear time trend in the treatment effect β in Specification 1, the relationship between donors’ rates of itemized giving and the share of PAC contributions to donors’ copartisan recipients appears to have strengthened over time (statistically significant at the 10% level). As shown in Section A.2.12 of the online appendix, the estimated treatment effects on donors’ rates of giving have nearly doubled between 1990 and 2016. This may have resulted from a concurrent rise in polarization at both elite and mass levels (McCarty, Poole, and Rosenthal Reference McCarty, Poole and Rosenthal2016; Pew Research Center 2017).
The impact on donor behavior due to changes in access-seeking PACs’ support for donors’ preferred parties is not only immediate, but also persistent. By substituting the outcome variable in Specification 1 with Entry ijt, an indicator for donor entries, I can detect whether donors who had not started giving (itemized donations) to access-seeking PACs would be more likely to do so when the share of PAC contributions to copartisan recipients rose. As Table 2 shows, this prediction is true regardless of whether I restrict to pure partisan donors or not. Similarly, replacing the outcome variable in Specification 1 with Exit ijt, an indicator for donor exits, allows me to examine whether donors who had been giving to access-seeking PACs were less likely to permanently stop doing so when the PAC’s support for copartisan candidates grew. As expected, coefficient estimates from both models in Table 3 are statistically significant and negative.
Differences-in-Differences Estimates for Entry ijt

Standard errors are clustered at the PAC level and reported in parentheses.
* p < 0.05, ** p < 0.01, *** p < 0.001
Differences-in-Differences Estimates for Exit ijt

Standard errors are clustered at the PAC level and reported in parentheses.
* p < 0.05, ** p < 0.01, *** p < 0.001
The presence of entry and exit effects suggests that donors’ partisan preferences may have long-lasting impact on the fundraising of access-seeking PACs. When these PACs give a greater share of their contributions to one party, they gain new donors who support the party, but they also permanently lose active donors who prefer the opposite party. As a result, access-seeking PACs might be wise not to overreact to changing partisan power in Congress, since complications to long-term fundraising could outweigh the benefits of short-term access. Nonetheless, because donor entries and exits may be mismeasured due to limitations in campaign finance records discussed earlier, the estimated treatment effects shown in Tables 2 and 3 should be taken as suggestive evidence rather than conclusive findings.Footnote 16
STUDY 2: ORIGINAL SURVEY OF RECENT PAC DONORS
Having verified that donors are less likely to give to access-seeking PACs when a greater share of PAC contributions goes to out-partisan (rather than copartisan) politicians in my difference-in-differences analysis of campaign finance records, I now turn to my original survey of corporate PAC donors to unpack the underlying causal mechanism. First, I show that respondents who have recently given to PACs sponsored by publicly traded companies are well-informed about how their PACs allocate contributions across parties. Second, I replicate my observational finding in a preregistered experiment in the survey: when learning about a hypothetical corporate PAC’s (randomly assigned) allocation of contributions across parties, donors in my survey report much lower willingness to donate to said PAC if it supports a greater proportion of out-partisan candidates.
Sampling Method and Respondent Characteristics
In this subsection, I describe my sampling method and demonstrate that my respondents are highly relevant for the purpose of this paper. Each donor targeted for recruitment received a letter sent to the address listed in their most recent itemized donation recorded in the Database on Ideology, Money in Politics, and Elections (Bonica Reference Bonica2016b), updated through the 2016 election cycle. The letters provide a link to an online survey, which I describe in detail in Section A.3.2 of the online appendix. These donors were selected from one of two sampling frames.
First, I recruited 413 respondents out of 3,500 individual donors (response rate 11.8%) in what I call the Compustat sampling frame. These are individual donors randomly selected on two conditions: (1) since the 2010 federal election cycle, each of them has given at least one itemized donation to a PAC sponsored by one of the publicly traded companies in the Compustat North America database (Compustat North America 2017), and (2) each has donated exclusively to candidates from one of the two major parties.Footnote 17
Additionally, for a different study, I also recruited 1,347 respondents out of 16,391 individual donors (response rate 8.22%) in what I call the other sampling frame. These are randomly selected individual donors who also give exclusively to candidates from one of the two major parties, though not all of them have experiences with corporate or other access-oriented PACs.
Among the 1,347 donors from the other sampling frame, 198 of them self-reported having had an employer that sponsors a PAC in a screening question. These 198 individuals, together with the 413 respondents from the Compustat sampling frame, form the subset of respondents that I hereafter refer to as the known PAC donors. The remaining respondents are collectively called other donors.
Section A.3.1 of the online appendix describes the demographic and political characteristics of the respondents. Here I highlight three features. First, the known PAC donors are comparable to the population of donors to access-seeking PACs. For example, among respondents from the Compustat sampling frame, the average itemized donation per cycle since the 2008 election cycle is $548 while the median is $217. In comparison, the corresponding average for all donors who gave to access-seeking PACs since the 2008 election cycle is $1,231, and the corresponding median is $500. The known PAC donors thus appear representative of the rank-and-file donors to access-seeking PACs.
Second, the known PAC donors come from at least ten sectors (according to OpenSecret’s employment sector classification) that are responsible for the overwhelming portion of PAC contributions from access-seeking interest groups. In descending order, they are (1) communications/electronics, (2) finance, insurance, and real estate, (3) miscellaneous business, (4) health, (5) defense, (6) energy and natural resources, (7) agribusiness, (8) transportation, (9) construction, and (10) other. In the 2016 election cycle, these ten sectors collectively accounted for 71.5% of all PAC contributions (not just access-seeking PACs).
Third, both parties are represented in the survey samples. Among known PAC donors, 40.2% give exclusively to Republican candidates while the rest donate only to Democrats. For the other donors, 25.1% are loyal Republican donors while the rest give solely to Democrats.
Donor Knowledge of PAC Contributions
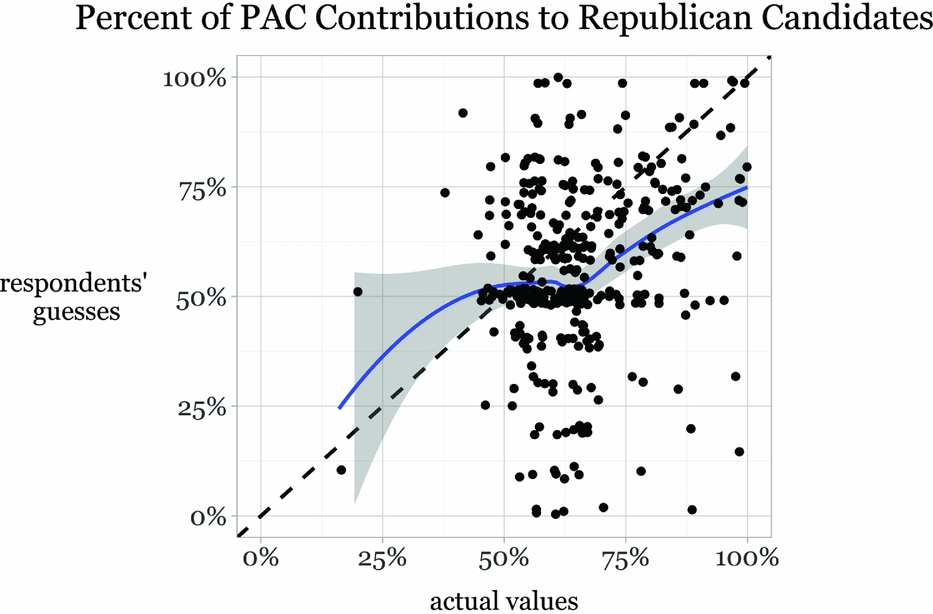
My survey suggests that donors to access-seeking PACs are highly informed about how their PACs allocate contributions across parties. To assess donors’ knowledge of such information, I asked each of the 413 respondents from the Compustat sampling frame to guess the percentage of their PAC’s contributions that went to Republican (as opposed to Democratic) candidates in the 2016 federal election cycle. Figure 4 is a jittered scatter plot of the average respondent’s guess against the actual percentage of PAC contributions to Republican candidates, along with a fitted Loess curve and a dashed 45-degree line for reference.Footnote 18 As evident from Figure 4, while respondents need not know exactly what percentage of their respective PAC’s contributions went to candidates of each party—a high bar for rank-and-file PAC donors—75% of the respondents know at least which party’s candidates received more money from respondents’ corresponding PACs. Moreover, Table 4 shows the distribution of the absolute differences between the guessed versus actual percentages, which are fairly small except for some outliers. The Pearson correlation between the guesses versus the corresponding actual values is 0.297.
Jittered Scatter Plot of Guessed versus Actual Percentage of PAC Contributions to Republican Candidates

Distribution of Absolute Distances between Guessed versus Actual Percentages

To my best knowledge, Figure 4 and Table 4 represent the first set of evidence that donors are informed about how their corporate PACs allocate contributions across parties. Section A.3.3 of the online appendix provides detailed arguments for the external validity of this finding. I therefore verify one important precondition for donors’ partisan preferences to affect their willingness to donate to access-seeking PACs. Moreover, my finding contrasts with existing research on other corporate stakeholders such as consumers. For example, when presented with multiple-choice questions on basic facts about PAC contributions made by household brands, consumers’ answers were no better than random chance (Panagopoulos et al. Reference Panagopoulos, Green, Krasno, Schwam-Baird, Moore and Endres2016). In contrast, among the 413 respondents from the Compustat sampling frame, a majority of their guesses on the percentage of their PAC’s contributions to Republican candidates were within 14.1 percentage points of the actual values, about only two thirds of a standard deviation of within-PAC changes in the percentage of PAC contributions to Republican recipients in actual campaign finance data (19.7 percentage points). That most survey respondents are well informed about how their PACs allocate contributions across parties is even more impressive considering that 90.3% of known PAC donors in the survey claim to not participate in the management or oversight of their PACs in any official capacity.
How do PAC donors know where PAC contributions are going? In an open-response question where I asked whether access-seeking PACs incorporate the opinions of rank-and-file members on candidate selection, about 20% of all respondents who answered the question spontaneously mentioned that they learn about their PAC’s choice of candidates in one or more of the following ways: regular (e.g., quarterly or annual) newsletters from one’s employer providing updates on PAC activities, including to whom the PAC has contributed or plans to contribute; meet-the-candidate events organized by one’s employer; regular conferences or presentations to educate employees on legislators’ positions on key policy issues; updates on PAC contributions through www.opensecrets.org; and occasional pledges by employers to contribute evenly across parties. These findings echo Hertel-Fernandez (Reference Hertel-Fernandez2016), who documents many similar tactics that businesses use to recruit employees into politics.
Experiment in Survey
Experimental Design
In addition to providing evidence that donors to access-seeking PACs are highly knowledgeable of how their PACs allocate contributions across parties, I also show via an experiment in the survey that such information has considerable impact on donors’ willingness to donate to their PACs, consistent with my observational findings. Here I describe the experimental design.
For every respondent who consented to the survey, regardless of which sampling frame she belonged to, I randomly assigned a pair of donation solicitation letters. Respondents who are known PAC donors were told to imagine that these hypothetical letters had come from the corporate PACs that their employers sponsor. The other donors were asked to imagine that their employers had PACs, which in turn had sent out these solicitation letters. The first letter represents an attempt by a corporate PAC to solicit donations in some unspecified federal election cycle t = 1. And the second letter represents such an effort in the next cycle, t = 2. Each treatment is thus a random permutation of two letters.
With suggestions from a corporate PAC donor, I have designed the solicitation letters to be as ecologically valid as possible subject to a few practical constraints.Footnote 19 Every letter begins with the same text, emphasizing the value of employees’ donations in helping their PAC advance the parent company’s policy objectives. The only difference—where the treatment enters—is at the end of the letter where the PAC provides a list of nine fictitious candidates, along with the party labels D or R, that it claims as allies and thus plans to support. These candidates’ party labels were assigned depending on which treatment a respondent received. The candidate list in each letter contains two, five, or eight Republicans; this is true for letters designated for both t = 1 and t = 2. Moreover, the random permutation of letters is programmed such that the number of Republicans in the first letter never equals that in the second letter. Hence, there are in total six possible treatments: (2, 5), (2, 8), (5, 2), (5, 8), (8, 2), and (8, 5). After reading each of the two letters, respondents were asked how much they would be willing to donate (from $0 to $5, 000) to their respective corporate PAC had the PAC sent them the letter they just saw.
Hypothesis
My hypothesis is that respondents’ self-reported willingness to give will be higher the greater the number of copartisan candidates in the solicitation letters. Formally, this implies β2 > 0 in the following preregistered fixed-effects model:
 $$\begin{eqnarray}
\hspace*{-8pt}O(Amount_{it}) &=& \beta _{i}+\tau _{t}+\beta _{1}PAC\_R_{it}\nonumber\\
\hspace*{-8pt}&&+\,\beta _{2}(PAC\_R_{it}\times Indiv\_R_{i}) + \zeta _{it}.
\end{eqnarray}$$
Other preregistered specifications, including random effects and pooled regressions, can be found in Section A.3.6 of the online appendix.
The outcome variable in Equation (3), Amount it ∈ [0, 5000], is the dollar amount that respondent i is willing to donate after seeing her letter t ∈ {1, 2}. The function O( · ) maps this dollar amount into one of four different outcome measures: (1) Amount it; (2) log(Amount it + 1), since Amount it include zeros and are right-skewed; (3) I(Amount it ≥ 200), indicating that Amount it exceeds the itemization threshold; and(4) I(Amount it > 0), a binary measure of willingness to donate. I will report results for each of these measures.
On the right-hand side of Equation (3), βi is a respondent fixed effect. τt is a fixed effect for each letter t ∈ {1, 2}.  $PAC\_R_{it} \in [-1/2, 1/2]$ denotes the net share of candidates in respondent i’s letter t that are Republican. For example, if five out of the nine candidates are Republicans in letter t, then
 $PAC\_R_{it}=5/9-1/2=1/18$. Additionally,
 $Indiv\_R_{i}$ measures respondent i’s partisanship: it equals −1/2 if the respondent gives exclusively to Democratic candidates, and 1/2 if the respondent gives exclusively to Republican candidates (recall that respondents were sampled such that each has only donated to recipients of one party). This is a reliable measure of respondents’ partisan leaning because individual donors, when giving directly to candidates, are primarily motivated by partisanship or ideology rather than access-seeking considerations (Bonica Reference Bonica2014; Barber, Canes-Wrone, and Thrower Reference Barber, Canes-Wrone and Thrower2017). Note that I do not independently control for
 $Indiv\_R_{i}$ because it is absorbed by the respondent fixed effect βi.
I present summary statistics in Section A.3.4 of the online appendix. Additionally, Section A.3.5 of the online appendix shows that attrition is orthogonal to treatment assignment.
Results
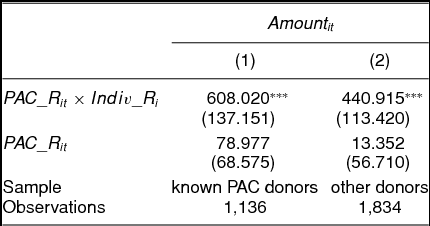
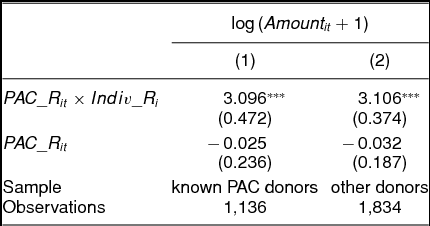
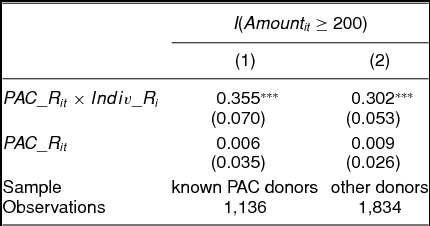
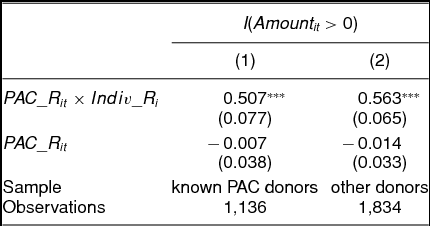
Tables 5–8 display the coefficient estimates with robust standard errors from Specification 3, all of which are consistent with my hypothesis that donors’ willingness to give to access-seeking PACs increases in the share of copartisan candidates that these PACs support. Each table uses one of the four measures of donors’ willingness to give as the dependent variable. In addition, the first column displays estimates from the known PAC donors, while the second column shows results from the other donors. As expected, the interaction term between  $PAC\_R_{it}$ and
 $Indiv\_R_{i}$ is positive and statistically significant in every column of every table, regardless of how willingness to donate is measured or whether I subset to respondents who are known PAC donors. Estimates from other preregistered specifications, shown in Section A.3.6 of the online appendix, are qualitatively identical and similar in magnitude to the ones shown here.
Fixed-Effects Estimates for Dollar Amount of Donation

Note: *p < 0.05; **p < 0.01; ***p < 0.001
Robust standard errors in parentheses
Fixed-Effects Estimates for Log of Dollar Amount of Donation

Note: *p < 0.05; **p < 0.01; ***p < 0.001
Robust standard errors in parentheses
Fixed-Effects Estimates for Indicator for Itemized Donation

Note: *p < 0.05; **p < 0.01; ***p < 0.001
Robust standard errors in parentheses
Fixed-Effects Estimates for Indicator for Positive Donation

Note: *p < 0.05; **p < 0.01; ***p < 0.001
Robust standard errors in parentheses
These results suggest that donors’ partisan preferences are substantively important for the fundraising of access-seeking PACs. Consider a one-standard deviation decrease in the residualized share of PAC contributions to one party (19.7 percentage points) as observed in actual campaign finance data. This would lead the average known PAC donor aligned with said party to donate $60 less to her PAC, which represents a 15.6% reduction from the baseline of $383 in the survey. If we instead assume a log-linear relationship between the amounts of donations and the share of PAC contributions to donors’ copartisan recipients, the known PAC donors would donate 26.3% less in dollar amount on average. Alternatively, focusing on the rate at which known PAC donors are willing to give itemized donations, we would expect this rate to decline by 0.0349 for the average known PAC donor, representing a 11% reduction from the baseline rate of 0.319 in the survey. Finally, focusing on the binary measure of willingness to give, we would expect said rate to fall by 0.0499 for the average known PAC donor, which is a 10.4% reduction from the baseline of 0.478 in the survey.
There are at least two sets of evidence suggesting that these results are not merely driven by “cheap talk” by survey respondents. First, the relative effect sizes discussed above are similar to what I obtain from difference-in-differences analysis. Recall that column 1 of Table 1 suggests that for a one-standard deviation decrease in the residualized share of PAC contributions to one party (19.7 percentage points) (Mummolo and Peterson Reference Mummolo and Peterson2018), rates of itemized giving declines by 6.89% from the baseline rate in campaign finance records (which likely suffer from attenuation bias). This is comparable to the relative effect size of 11% from the survey experiment. Second, respondents actually understate rather than exaggerate how much they would be willing to give to their PACs in the survey (relative to what they actually give on record). Respondents from the Compustat sampling frame gave on average $548 in itemized donations to their corresponding corporate PAC per cycle since 2010, and the median amount is $217. In contrast, the known PAC donors report $383 on average in the survey, and the corresponding median is in fact $0. Hence, the real impact of donors’ partisan preferences on the fundraising of access-seeking PACs may be comparable to, and perhaps even stronger than, the magnitudes suggested by the survey experiment.
I also corroborate my experimental findings by directly asking respondents with what likelihood (self-reported as a probability) they would stop donating to their employers’ PAC if said PAC had contributed to a candidate they oppose. The mean response is 60.3% while the median is 80%. A large majority would withhold donations to their PACs if such donations require them to support, even by proxy, any political candidate they dislike.
To summarize, my original survey of PAC donors fulfills two purposes. First, it shows that donors are well informed about how their access-seeking PACs allocate contributions across parties, and thereby possess the information necessary to base their decision to give on how well PAC activities align with their own partisan preferences. Second, in an experiment in the survey, I find that PAC donors are significantly less willing to donate when a greater share of PAC contributions go to out-partisan candidates, thereby replicating my difference-in-differences analysis.
DISCUSSION
One of the most influential claims in campaign finance and interest group politics is that low levels of interest group PAC contributions imply minimal investment returns from these contributions. In this paper, I provide a new perspective on why there is so little money in elections: interest groups face internal constraints on their ability to engage in political activities such as PAC contributions. I do so by illuminating one such constraint: access-seeking PACs alienate donors with partisan preferences when giving to politicians of the opposite party.
To support this finding, I first demonstrate that donors to access-seeking PACs withhold their donations as PACs’ support for donors’ copartisan politicians declines, using a difference-in-differences analysis of patterns of real giving. In particular, how access-seeking PACs allocate contributions across parties not only increasingly affects donors’ willingness to give over the last three decades, but also results in persistent changes in donor behavior in the form of entries and exits. Next, in an original survey experiment of corporate PAC donors, I show that they are highly informed about how their PACs allocate contributions across parties, thereby possessing the knowledge necessary for rewarding or punishing their PACs based on their partisan preferences. I also replicate my key observational finding in an experiment in the survey, where donors report lower willingness to donate to a hypothetical corporate PAC when said PAC is randomly assigned to support a higher proportion of out-partisan candidates.
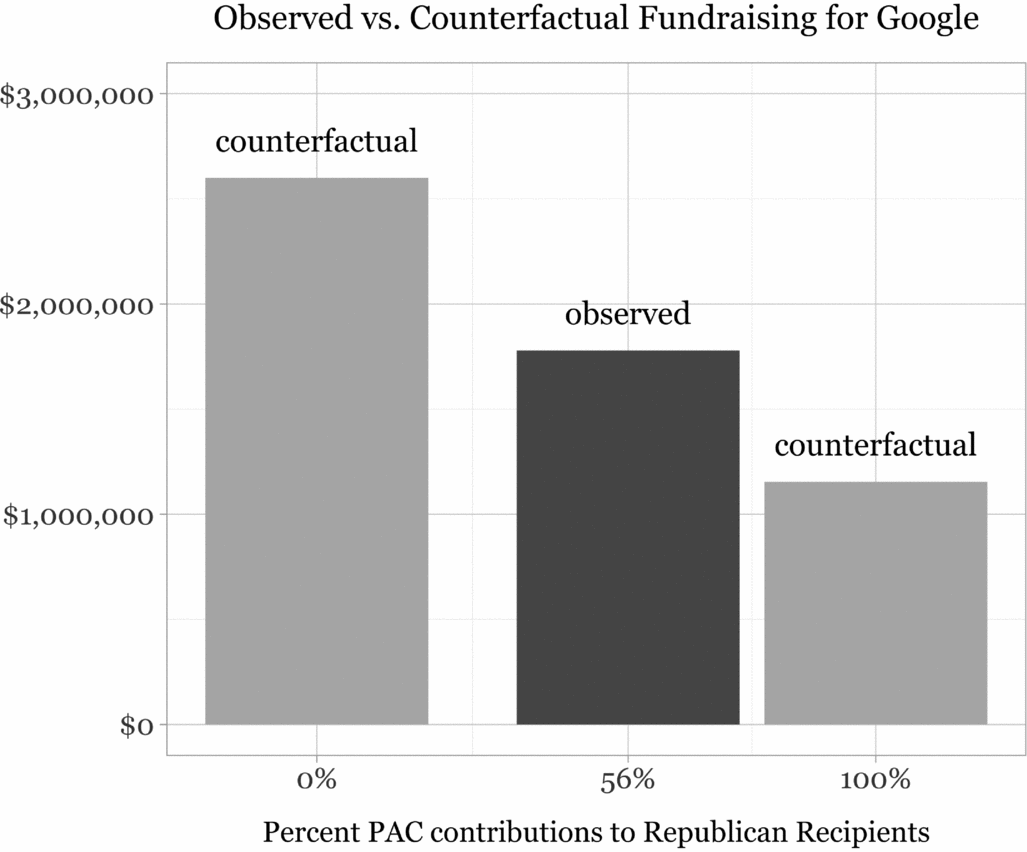
A back-of-the-envelope calculation of counterfactual fundraising outcomes for Google in the 2016 federal election cycle (see Section A.3.9 of the online appendix for methodology) suggests that donors’ partisan preferences may have a considerable impact on the fundraising of access-seeking PACs. As shown in Figure 5, between 2015 and 2016, approximately 55.7% of Google’s PAC contributions went to Republican (as opposed to Democratic) candidates and party committees. At the same time, Google’s PAC raised $1,778,775 in itemized donations. Had Google given all of its PAC contributions to Democratic recipients, it would have raised $2,594,931, representing a 45.9% increase relative to the observed fundraising outcome. Alternatively, if Google had contributed every dollar to Republican politicians, it would have raised $1,140,520, which is a 35.9% reduction from the observed fundraising outcome. Because Figure 5 does not incorporate any donor entries and exits that could result from changing Google’s PAC contribution strategy, the contrast between observed versus counterfactual fundraising outcomes may be even more pronounced in the long run.
Counterfactual Analysis of Google’s Fundraising Outcomes in the 2016 Cycle

Google’s case illustrates how donors’ partisan or ideological preferences may constrain the ability of PACs to raise funds and, by extension, seek access. On one hand, Google has much to gain from courting Republican legislators, who controlled both chambers of Congress by 2015 and were potential allies on Google’s key policy issues such anti-trust regulations (Catan and Mullins Reference Catan and Mullins2014). On the other hand, Google’s workforce is overwhelmingly liberal. More than 84.3% of Google’s partisan donors are Democratic leaning as evidenced by their personal donation records. Consequently, while Google had ample strategic interest in supporting the Republican Party, barely over a half of its PAC contributions went to Republican recipients, potentially reflecting a compromise between access seeking and appeasing Democratic or liberal-leaning Googlers.
Due to internal fundraising constraints imposed by donors’ partisan or ideological preferences, access-oriented organizations such as Google may never reap the full benefits of their PAC contributions. Moreover, as polarization, particularly affective polarization and the politicization of issues (Gimpel, Lee, and Parrott Reference Gimpel, Lee and Parrott2014; Iyengar and Westwood Reference Iyengar and Westwood2015), continues to rise, access-seeking interest groups could face increasingly tight constraints not only on PAC fundraising and contributions, but also on lobbying activities whose benefits are contingent on strategic PAC contributions (Langbein Reference Langbein1986; Hall and Wayman Reference Hall and Wayman1990; Powell Reference Powell2012; Kalla and Broockman Reference Kalla and Broockman2016). Insofar as access-seeking interest groups become less effective at achieving their policy goals via PAC contributions, the resulting normative implications are ambiguous and a worthwhile subject of future study. To the extent that access-oriented interest groups both have policy goals opposed to those of the general public and exert an out-sized influence on policymaking (Schattschneider Reference Schattschneider1960; Lindblom Reference Lindblom1977; Gilens and Page Reference Gilens and Page2014), the constraints that members’ partisan or ideological preferences impose on these groups may enhance democratic representation and accountability. At the same time, however, as the influence of access-seeking interest groups diminishes, candidates may become increasingly dependent on more ideological sources of campaign funding (Bonica Reference Bonica2013; McCarty, Poole, and Rosenthal Reference McCarty, Poole and Rosenthal2016), which may in turn accelerate trends in polarization and extremism (La Raja and Schaffner Reference La Raja and Schaffner2015).
The insight that even access-seeking, ostensibly nonpartisan interest groups must adapt their strategies to the partisan or ideological preferences of group members may account for other important phenomena in interest group activities as well. One example is independent political spending in the wake of Citizens United. Despite widespread fear of corporate money flooding the electoral system following this landmark ruling (Eggen Reference Eggen2010), corporate treasuries collectively funded less than 1% of all independent expenditures during the 2012 election cycle (Bonica Reference Bonica2016a). Why did corporate interests show such surprising restraint in the post-Citizens United era? One possibility is that, even though independent expenditures are not funded by voluntary donations from affiliated individuals, any political spending on elections that goes against the partisan or ideological preferences of organizational members—such as board members, managers, shareholders, and employees—could provoke intense backlash within corporations and other access-seeking interest groups (Bonica Reference Bonica2016a). In particular, interest groups that wish to take advantage of independent expenditures may have to pay a significant economic cost as a result of such internal backlash (Min and You Reference Min and You2015; Panagopoulos et al. Reference Panagopoulos, Green, Krasno, Schwam-Baird, Moore and Endres2016; McConnell et al. Reference McConnell, Margalit, Malhotra and Levendusky2018). Hence, internal constraints due to the partisan or ideological preferences of individual stakeholders may help to explain why the amount of corporate independent expenditures has been much more modest than many predicted in the aftermath of Citizens United.
Such internal pressure may also account for why access-seeking interest groups increasingly shift to alternative avenues of influence besides PAC contributions. One example of such alternatives is contributing to political intermediaries, such as the Chamber of Commerce or the Center for American Progress, that are in lockstep with major parties but do not technically qualify as party committees. Among the 111 Fortune 300 companies that Grumbach and Pierson (Reference Grumbach and Pierson2017) study, a majority gave more to these intermediary organizations than to all candidates combined in the 2012 election cycle. Unlike PAC contributions to candidates and parties, which publicly insert interest groups into electoral battles, contributions to political intermediaries are much less transparent (Grumbach and Pierson Reference Grumbach and Pierson2017). Obscurity is valuable not so much for evading public scrutiny: companies that are not vulnerable to consumer boycotts behave similarly as those that are vulnerable (Bonica Reference Bonica2016a); and consumers are ignorant of basic facts about the PAC contribution records of even household brands (Panagopoulos et al. Reference Panagopoulos, Green, Krasno, Schwam-Baird, Moore and Endres2016). Rather, internal backlash is a much more salient concern for corporations and other access-seeking PACs, as my survey shows that donors are well informed about their PACs’ activities. Contributing to political intermediaries thus offers an attractive alternative for access-seeking organizations that fear conflicts with their stakeholders on partisan or ideological grounds. Nonetheless, as activists increasingly expose such opaque forms of political spending (Halper Reference Halper2014), their relative advantage over PAC contributions might be vanishing. A possibility for future research is to study whether this is true and, if so, what new avenues of influence interest groups will adopt in response to internal pressure due to partisan or ideological disagreements.
Finally, in shedding new light on why there is little interest group money in politics, my paper is the first to examine the limits on PAC fundraising imposed by PAC donors’ partisan preferences. Understanding when and how interest groups are constrained is critical for the accurate assessments of group power because, as Hacker and Pierson (Reference Hacker2002) caution, “a group’s actions often will not reveal its preferences but rather its strategic calculations of what is the best that can be accomplished given existing circumstances.” This paper thus begins a research agenda on finding new sources of constraints, especially those internal to organizations, that could provide valuable insights on enduring questions of interest group politics. In particular, research on business power in politics could benefit from understanding “business” not as a monolith, but as individual organizations whose political activities are shaped at least partly by the autonomous individuals within (Dahl Reference Dahl1959; Cyert and March Reference Cyert and March1963; Hart Reference Hart2004). In addition to examining the partisan or ideological preferences of members of interest groups, future research may benefit from exploring how other internal factors—for example, internal economic backlash from interest group activities (Min and You Reference Min and You2015; Panagopoulos et al. Reference Panagopoulos, Green, Krasno, Schwam-Baird, Moore and Endres2016; McConnell et al. Reference McConnell, Margalit, Malhotra and Levendusky2018), political learning curves of managers and other group entrepreneurs (Hart Reference Hart2001; Drutman Reference Drutman2015), and principal-agent problems within organizations (Aggarwal, Meschke, and Wang Reference Aggarwal, Meschke and Wang2012; Coates Reference Coates2012; Werner and Coleman Reference Werner and Coleman2015)—could shape if not constrain interest group strategy and power.
SUPPLEMENTARY MATERIAL
To view supplementary material for this article, please visit https://doi.org/10.1017/S0003055418000382.
Replication materials can be found on Dataverse at: https://doi.org/10.7910/DVN/T1TELH.






Comments
No Comments have been published for this article.