Implications
Highly pathogenic avian influenza (HPAI) outbreaks have a devastating impact on the poultry industry, with high mortality, reduced egg production and mandated euthanization of infected flocks. Within the last four years, two HPAI outbreaks have affected egg production flocks in the American continent; a H7N3 outbreak in Mexico in 2012 that caused 70% to 85% mortality and a H5N2 outbreak in the United States in 2015 with over 99% mortality. Identification of genetic regions and candidate genes associated with HPAI survival could increase our understanding of HPAI viral pathogenesis and may aid drug and/or vaccine development in the future.
Introduction
Highly pathogenic avian influenza infections lead to rapid onset of severe, contagious systemic disease with nearly 100% mortality. In contrast, low pathogenic avian influenza virus (LPAI) usually produces subclinical infections in chickens, with decreases in production but minimal mortality. So far, significant pathogenicity differences observed between HPAI and LPAI were related to specific characteristics of virus strains, tissue tropism and host response (Post et al., Reference Post, Burt, Cornelissen, Broks, van Zoelen and Peeters2012). Host responses to avian influenza (AI) vary between different avian species. For example, ducks frequently show no signs of disease due to low pro-inflammatory response, in contrast to hypercytokinemia in chickens (Burggraaf et al., Reference Burggraaf, Karpala, Bingham, Lowther, Selleck, Kimpton and Bean2014). One of the genes responsible for these differences is RIG-I, whose absence in chickens has been connected to high susceptibility to HPAI (Karpala et al., Reference Karpala, Steward, McKay, Lowenthal and Bean2011). The IFITM123 protein family was also implicated, as low expression during HPAI infection has been observed in Galliform birds (Smith et al., Reference Smith, Smith, Yu, Paton, Gutowska, Forrest, Danner, Seiler, Digard, Webster and Burt2015). Infection of chickens with HPAI H5N1 virus triggers expression of genes related to inflammatory and innate immune responses. Intense host antiviral response is, however, unsuccessful in controlling this rapidly progressing infection, which subsequently results in high mortality in chickens. In contrast, following LPAI infection, the expression level of most of these genes remains unchanged in the lung tissue of infected chickens (Post et al., Reference Post, Burt, Cornelissen, Broks, van Zoelen and Peeters2012).
Comparison of two inbred chicken lines for viral shedding levels following experimental LPAI (H7N7) infection revealed clear differences in host-genetic control (Ruiz-Hernandez et al., Reference Ruiz-Hernandez, Mwangi, Peroval, Sadeyen, Ascough, Balkissoon, Staines, Boyd, McCauley, Smith and Butter2016). Absence of cloacal shedding and a restricted time course of oropharyngeal shedding were observed in the more resistant line. However, the genetic mechanisms behind these differences were not examined. Sironi et al. (Reference Sironi, Williams, Stella, Minozzi, Moreno, Ramelli, Han, Weigend, Wan, Lombardi, Cordioli and Mariani2011) determined that response of chickens to the HPAI H7N1 virus was significantly different between lines but failed to find a significant association between major histocompatibility complex (MHC) haplotype and HPAI resistance. The influence of genetics on survival following HPAI infection was also examined in indigenous Thai breeds but no significant association between sensitivity to HPAI infection and variation in either the BF1 locus of the MHC or the Mx gene was found (Matsuu et al., Reference Matsuu, Kobayashi, Patchimasiri, Shiina, Suzuki, Chaichoune, Ratanakom, Hiromoto, Abe, Parchariyanon and Saito2016).
The aim of this study was to identify genetic variation associated with HPAI survival in the Mexico/H7N3 and Iowa/H5N2 outbreaks. The second goal was to determine whether the genomic regions that are associated with survival after infection are the same for different HPAI strains (H7N3 and H5N2).
Material and methods
Material
Samples were obtained following two different HPAI outbreaks in multiple commercial layer facilities in two different countries. All blood samples were from the Hy-Line W-36 White Leghorn layer variety (a commercial multiple line hybrid) and were collected on FTA Elute Microcards (GE Healthcare, Piscataway, NJ, USA). In Mexico, HPAI H7N3 infections resulted in 70% to 85% mortality of hens. Blood samples (n=273) were collected on survivors in 2012, 4 to 8 weeks following cessation of non-routine mortality. Flocks were re-sampled 10 months later in 2013 (n=187), following repeated vaccinations with killed AI vaccines. A total of 12 flocks were sampled in Mexico, with 48 samples per flock, giving 460 challenge-surviving birds in total. The HPAI outbreak in Iowa, US, was a different strain (H5N2) and was far more virulent, with >99% mortality occurring within 5 days of infection. The rare survivors sampled had survived in the production houses for 4 weeks post infection. A total of 104 samples were obtained from survivors from three flocks in two locations in Iowa. Age matched non-affected controls were also sampled for both the Mexico (n=95) and Iowa (n=186) samples. These were identified from hatchery records as hatching within 1 week of the affected flocks and being sourced from the same parent flock (Iowa, USA) or being the same age (within 3 months) and from the same fertile egg sources (Mexico). In total samples of 555 (460 survivors) and 290 (104 survivors) birds were available from the Mexico and Iowa outbreaks respectively.
Genotyping
DNA was extracted from the FTA cards using manufacturer standard procedures. Genotypes were determined using the commercially available 600 k Axiom chicken single nucleotide polymorphism (SNP) chip from Affymetrix (Santa Clara, CA, USA) (Kranis et al., Reference Kranis, Gheyas, Boschiero, Turner, Yu, Smith, Talbot, Pirani, Brew, Kaiser, Hocking, Fife, Salmon, Fulton, Strom, Habrer, Weigend, Preisinger, Gholami, Quanbari, Simianer, Watson, Woolliams and Burt2013). Genotype calling and quality control was performed on all samples using the Axiom Analysis Suite, resulting in data on 420458 segregating SNPs. Genotyping data were analyzed in PLINK ver 1.0.7 (Purcell et al., Reference Purcell, Neale, Todd-Brown, Thomas, Ferreira, Bender, Maller, Sklar, de Bakker, Daly and Sham2007). During this quality control process, the data was filtered based on call rate (<0.90) and minor allele frequency (MAF<0.01 for Mexico’s samples and MAF<0.02 for Iowa’s samples, reflecting differences in sample size) leaving a total of 348161 SNPs for Mexico samples and 340791 SNPs for Iowa samples.
Statistical analysis
A variety of approaches were used to identify SNPs and genomic regions associated with AI survival, including logistic regression using (1) PLINK and (2) a Bayesian variable selection GWAS approach using the GenSel software (Fernando and Garrick, Reference Fernando and Garrick2008). Regions significant according to at least one of the approaches were marked as candidate regions. In each region, statistical significance of the SNP with the estimated highest effect on survival was tested with ASReml 4.0 (Gilmour et al., Reference Gilmour, Gogel, Cullis, Welham and Thompson2015) using a logit model. A basic SNP allele frequency test between cases and control was also performed in PLINK, with results provided as supplementary information (Supplementary Material Table S1 and Supplementary Material Figure S1).
Linkage-disequilibrium pruning was performed using PLINK with an r 2 threshold of 0.2 to obtain a subset of approximately independently segregating SNPs. After removing SNPs from chromosome Z (n=206), 12724 approximately independent autosomal SNPs were identified and used in multidimensional scaling (MDS) analysis to correct for population stratification. The genome-wide significance level was set using Bonferroni correction based on the total number of approximately independently segregating SNPs as 0.05 divided by 12930, which is equal to 3.87E-06. This was used for all models beside BayesB where windows that explained over 0.8% of variance were considered in the further analysis.
The software PLINK was used to run a basic case–control allele frequency test and logistic regression analysis, which included location and the first three MDS components as covariates. Both these analyses were performed separately for the Iowa/H5N2 and the Mexico/H7N3 outbreaks. The 10000 SNPs with the largest effects in PLINK logistic regression analyses were verified using the ASReml software with a logit model that included the genomic relationship matrix to correct for population structure and polygenic effects.
Bayesian variable selection method BayesB (Meuwissen et al., Reference Meuwissen, Hayes and Goddard2001) was used to analyze survival as a binary trait using all SNPs simultaneously, following Kizilkaya et al. (Reference Kizilkaya, Tait, Garrick, Fernando and Reecy2013). Parameter π was set equal to 0.9995 so as to fit ~200 markers (0.0005×420 k) per iteration of the Markov chain in a mixture model for estimation of individual SNP allele substitution effects. The chain length was 41 000 iterations, with the first 1000 iterations discarded as burn in. Markers were grouped into 1016 non-overlapping 1 Mb windows across the chicken genome and results were summarized as the proportion of genetic variance explained by SNPs in each 1 Mb window. The mean number of markers in a 1 Mb window was equal to 409.8±160.7 (mean±SD).
To utilize haplotype information for identifying genes underlying AI survival, BayesB analysis was also carried out with a haplotype model. To perform this analysis, genotypes for each individual were phased (based on the Galgal 4.0 assembly) using the BEAGLE v4.1 software (Browning and Browning, Reference Browning and Browning2007). Haplotype files were prepared based on phased Variant Call Format files with an in-house Python script. Fixed window sizes of either 40 or 100 kb were used. Only haplotypes with a frequency ~0.8% were considered for further analysis and fitted using the same BayesB approach as used for the SNP allele model but with π set to 0.999.
Linkage disequilibrium in regions of interest was visualized with Haploview 4.2 (Barrett et al., Reference Barrett, Fry, Maller and Daly2005). Genes that overlap regions of interest were identified with the Ensembl BioMart webtool (http://www.ensembl.org/biomart/) based on the Galgal4 assembly and the Ensembl Genes 86 database. Analysis of overrepresented gene ontology (GO) terms and pathways was performed using the PANTHER Classification System (http://www.pantherdb.org/). Identification of quantitative trait loci (QTL) that overlap the regions of interest was based on release 30 of ChickenQTLdb (http://www.animalgenome.org/).
Results
Population stratification
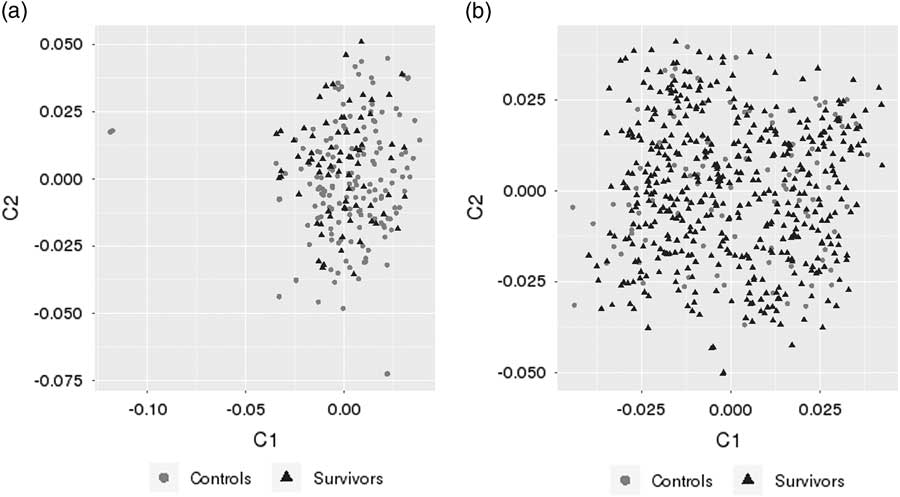
Population stratification was analyzed by the identity-by-state and MDS clustering methods available in the PLINK software. The first two principal components (Figure 1) showed no separation between survivor and control samples. To correct for population stratification, the first three MDS components were used as a covariates in further analyses.
Population structure based on the first two multidimensional scaling (MDS) components of the single nucleotide polymorphism (SNP) genotypes for the Iowa/H5N2 (a) and the Mexico/H7N3 outbreaks (b).

Regions associated with survival in the Mexico/H7N3and Iowa/H5N2 outbreak
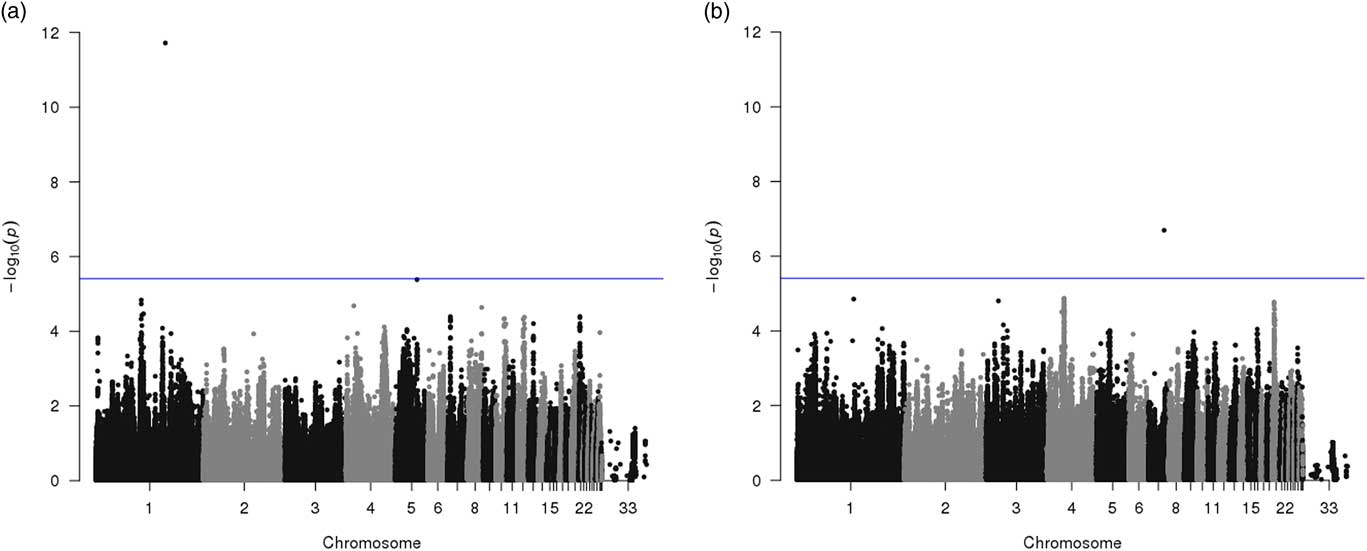
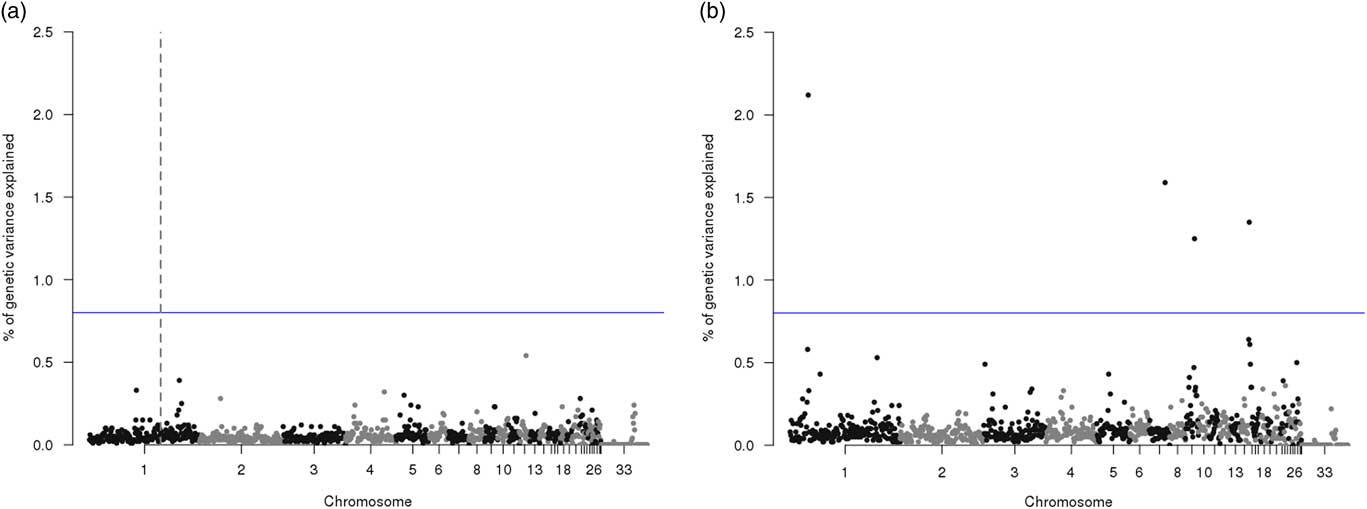
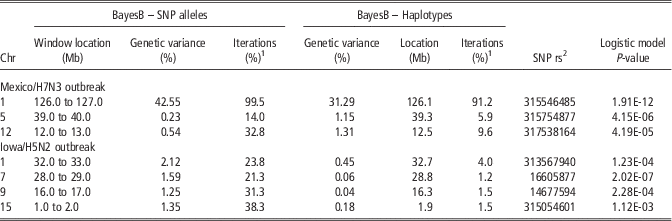
Regions associated with AI resistance in the Mexico/H7N3 and Iowa/H5N2 outbreak are summarized in Tables 1 and 2 for the logistic model and Bayesian GWAS, respectively. Manhattan plots for the logistic and Bayes B model are in Figures 2 and 3. Results across methods are summarized in Tables 3 and 4. Results based on the frequency model are in Supplementary data. The estimate of heritability for HPAI survival based on the BayesB threshold model, was equal to 0.24±0.07 and 0.18±0.08, for the Mexico/H7N3 and Iowa/H5N2 outbreak, respectively. The main regions identified for each model are described in the following section.
Manhattan plot for genome-wide association analysis results with avian influenza (AI) survival based on the logistic model for the (a) Mexico/H7N3 and (b) Iowa/H5N2 outbreaks. The blue line represents the 5% significance threshold after Bonferroni correction.

Manhattan plot for genome-wide association analysis results with AI survival based on the Bayesian model. Percentage of genetic variance explained by 1 Mb windows in the (a) Mexico/H7N3 and (b) Iowa/H5N2 outbreaks is shown on the y-axis. The blue line represents the 0.8% of genetic variance explained threshold. For the Mexico/H7N3 outbreak, the window that explained over 40%of genetic variance on chromosome 1 at 126 Mb is marked with dashed vertical line.

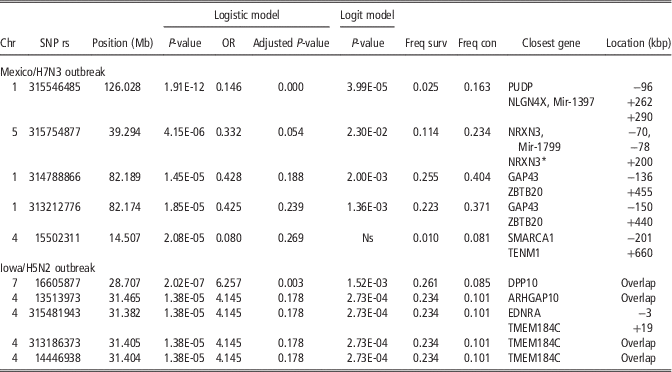
The five most significant single nucleotide polymorphisms (SNPs) according to the logistic model for the Mexico/H7N3 and Iowa/H5N2 outbreaks

Chr=chromosome; SNP=reference SNP ID (rs); Position in Mb according to build 4; OR=estimated odds ratio from logistic model; Adjusted P-value=P-value adjusted for multiple testing with Bonferroni correction; Logit model=P-value from logit model with relationship matrix; Freq surv=frequency in survivors; Freq con=frequency in controls; Location=location of the closest gene=+SNP is located X kbp upstream, –SNP is located X kbp downstream; NRXN3*=neurexin 3 isoform c precursor.
Summary of genomic regions associated with avian influenza survival in the Mexico/H7N3 outbreak based on the BayesB model, fitting SNP alleles or haplotypes

Regions were selected based on explaining high percent of variance (>0.8%) in BayesB model (windowed SNPs or haplotypes).
1 % of windows with non-zero effect.
2 SNP rs number with lowest P-value (logistic model) within the window.
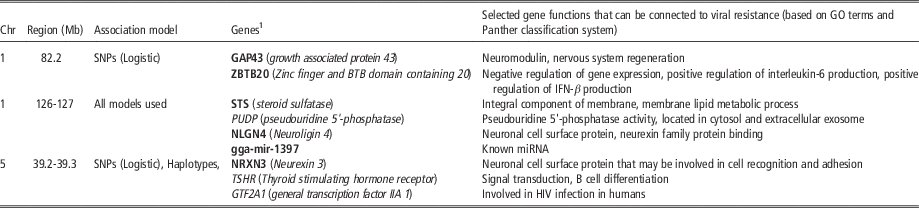
Genes located within regions associated with survival in the Mexico/H7N3 outbreak

Chr=chromosome.
1 Only genes located within±0.5 Mb range were included.
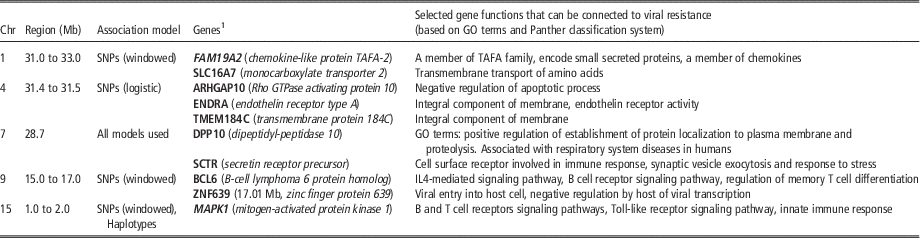
Genes located within regions associated with survival in the Iowa/H5N2 outbreak

Chr=chromosome.
1 Only genes located within±0.5 Mb range were included.
Logistic model
The strongest association with survival for the Mexico/H7N3 outbreak was found on chromosome 1 (126.0 Mb) for SNP rs315546485 (Table 1 and Figure 2). Relatively low r 2 values with neighboring SNPs were observed, so the location of SNP rs315546485 was also confirmed on genome build GalGal5. Two regions approaching significance were also found on chromosome 5 (39.2 Mb) and chromosome 1 (82.3 Mb). The two significant regions on chromosome 1 were also significant in the basic case–control frequency association test (Supplementary Material Table S1 and Figure S1). The most significant SNP from the logistic model for the Iowa/H5N2 outbreak was located on chromosome 7 (28.7 Mb) (Table 1 and Figure 2). The other region that approached significance in the logistic model was located on chromosome 4. Both these signals were also significant in the basic case–control association test (Supplementary Material Table S1 and Figure S1).
BayesB model
The highest percentage of variance for the Mexico/H7N3 outbreak was explained by 1 Mb window located on chromosome 1 (126.0 to 127.0 Mb) (Table 2 and Figure 3). This region on chromosome 1 also explained a high percentage of variance in the haplotype model. In the haplotype model, a high percentage of variance was also explained by haplotypes on chromosome 5 and 12 (Table 2). The regions explaining highest percentage of variance based on the BayesB analysis for the Iowa/H5N2 outbreak were identified on chromosomes 1, 7, 9 and 15 (Table 2 and Figure 3), however none had a large effect in terms of % variance explained. The highest proportion of genetic variance (2.12%) was explained by a 1 Mb window on chromosome 1 between 32 and 33 Mb, but no significant SNP was identified within this region in logistic model (Table 1). The position of the window that explained the largest percentage of genetic variance on chromosome 7 in BayesB was consistent with results from the single SNP logistic model in PLINK, where SNP rs16605877 was the variant with lowest P-value and significant after Bonferroni correction (Table 1). The significant window on chromosome 15 (1.0 to 2.0 Mb) is also located near the SNP that was significant in the case–control association model (Supplementary Material Table S1).
Candidate genes within identified regions for survival in the Mexico/H7N3 outbreak
Three regions with highest significance were located on chromosomes 1 and 5, out of which two (Chr 1 at 126 Mb and Chr 5 at 39 Mb) gave consistent signals for both SNP and haplotype analyses (Tables 1 and 2). Only the region on chromosome 1 (at 126 Mb) approached significance also for the logit model, which is, therefore, the most promising candidate.
Positional candidate genes that are located in close proximity (within 1 Mb) to the regions mentioned above are shown in Table 3. The overrepresentation test in Panther was performed for these genes but found no significant terms after Bonferroni correction with P<0.05. Two out of three regions identified in Table 3 overlapped with QTL that were previously identified for disease-related traits, including antibody response to sheep red blood cells antigen (SRBC) (Chr 1, 82.2 Mb;Chr 5, 39.3 Mb), antibody titer to LTA antigen (lipoteichoic acid) (Chr 5, 39.3 Mb), cloacal bacterial burden after challenge with Salmonella (Chr 5, 39.2 Mb), oocyst shedding (Chr 1, 82.2 Mb) and plasma coloration (Chr 1, 82.2 Mb).
Candidate genes within identified regions for survival in the Iowa/H5N2 outbreak
Regions with highest significance were located on chromosomes 1, 4, 7, 9 and 15. One region on chromosome 7 (28.7 Mb) gave consistent signal for both SNP and haplotype analyses and was, therefore, considered as the most promising candidate.
Positional candidate genes that are located in close proximity (within 1 Mb) to the regions mentioned above are shown in Table 4. The overrepresentation test in Panther was performed for these genes, but found no significant terms after Bonferroni correction with P<0.05. However, one biological process had P-value below 0.01, ion transport.
Three of five regions that were identified overlapped with QTL identified for disease susceptibility, including antibody response to SRBC antigen (Chr 1, 31.0 to 33.0), cloacal bacterial burden after challenge with Salmonella (Chr 1, 31.0 to 33.0), and Marek’s disease-related traits (Chr 4, 31.4 Mb; Chr 7, 28.7 Mb). Although the region on chromosome 15 did not directly overlap with disease susceptibility QTL, a number of QTL for Marek’s disease-related traits, antibody response to SRBC antigen, and antibody titer to LPS antigen, were located within 1.5 Mb from this region.
Discussion
This is to our knowledge the first study on identification of genetic regions related to survival following natural infection of chickens with HPAI. A genome-wide association study using a 600 K SNP chip and survivors and controls from two distinct HPAI outbreaks (H7N3 and H5N2) was performed. We did not identify any single SNP or region that distinguished survivors from controls for either virus strain, which suggests complex genetic influences on survival following HPAI infection. Several regions that are worth further research were, however, identified: four for the Iowa/H5N2 outbreak and five for the Mexico/H7N3 outbreak. Positional candidate genes that overlapped these regions and/or SNPs were identified.
As the Mexico and United States outbreaks were caused by different strains of the virus, with different levels of mortality, the analysis was performed separately for each outbreak data set. Different genomic regions were identified in these two outbreak data sets, probably due to differences in the pathogenesis for the two analyzed HPAI virus strains. It has been shown that even closely related AI virus strains can have quite different virulence. For example Matsuu et al. (Reference Matsuu, Kobayashi, Patchimasiri, Shiina, Suzuki, Chaichoune, Ratanakom, Hiromoto, Abe, Parchariyanon and Saito2016) found that host responses, especially cytokine response during the early phase of infection, differed between different H5N1 virus strains. Also, Post et al. (Reference Post, Burt, Cornelissen, Broks, van Zoelen and Peeters2012) found clear differences in gene expression of the host between AI strains (H7N1 HPAIV and LPAIV), especially in the brain tissue.
A number of statistical approaches were applied to identify genomic regions associated with survival. The logistic model was used over simple case–control frequency analysis to allow correction for population stratification. We decided to include MDS components as covariates in the analysis, as results from the Iowa/H5N2 outbreak confirmed that including MDS components led to different results, and the majority of regions identified in the basic case–control association test were not significant in the logistic model. On the other hand, incorporating genomic relationships in the logit model did lead to the same associations (although weak) as the logistic model. The most probable explanation for the weak associations that were identified was the small sample size and lack of SNPs with large effects in the Iowa H5N2 outbreak.
The Bayesian GWAS yields a posterior probability of association rather than P-values for the null hypothesis and, thus this approach can be more confidently applied with relatively small sample size (Zhao et al., Reference Zhao, Onteru, Saatchi, Garrick and Rothschild2013). The BayesB method performed better than linear model for dichotomous phenotypes for simulation data (Villanueva et al., Reference Villanueva, Fernández, Garcia-Cortês, Varona, Daetwyler and Toro2011) and for real case–control data (Kizilkaya et al., Reference Kizilkaya, Tait, Garrick, Fernando and Reecy2013). On this basis, we assumed that the BayesB method is a suitable approach for this type of study. In addition, McCarthy et al. (Reference McCarthy, Abecasis, Cardon, Goldstein, Little, Ioannidis and Hirschhorn2008) determined that multiple locus inference is a better strategy to identify weak associations than a single marker analysis, as small allele effects and low minor allele frequencies can affect the detection rate of associations. Thus, on assumption that a genomic region has a higher association with survival than individual SNPs, we fitted SNPs simultaneously and summarized results from neighboring SNPs using 1 Mb windows and in the haplotype model.
Little is known about why some birds survive HPAI outbreaks, while resulting in rapid death for the majority of individuals. Some studies have associated lack of HPAI survival in chickens with lack of the RIG-I gene, which plays a critical role in the outcome of RNA virus infections in mammals and ducks (Karpala et al., Reference Karpala, Steward, McKay, Lowenthal and Bean2011). Lower cytokine response followed by activation of major pattern recognition receptors (TLR7, RIG-I, MDA-5) and a persistent cellular response were responsible for fighting HPAI infection in ducks with a high level of success (Cornelissen et al., Reference Cornelissen, Vervelde, Post and Rebel2013). In chickens, 1 day post infection, lung, brain and spleen responded with a high, but delayed, pro-inflammatory response of IL-6 and IL-1b, including upregulation of IFN-β, IFN-γ, TLR3 and MDA-5. These responses were however unsuccessful and four out of six chickens died by the 3rd day post infection. The other main gene hypothesized to play a critical role in resistance to RNA virus infections in chickens is MDA-5, although knockdown of the expression of this gene had little impact on influenza proliferation (Karpala et al., Reference Karpala, Steward, McKay, Lowenthal and Bean2011). The Mx gene has also been proposed as a major candidate gene associated with AI resistance, where substitution of asparagine for serine at amino acid 631 of the Mx protein led to higher antiviral activity against H5N1 (Ko et al., Reference Ko, Jin, Asano, Takada, Ninomiya, Kida, Hokiyama, Ohara, Tsuzuki, Nishibori, Mizutani and Watanabe2002). However, Sironi et al. (Reference Sironi, Williams, Moreno-Martin, Ramelli, Stella, Jianlin, Weigend, Lombardi, Cordioli and Mariani2008) failed to confirm this association. Also, results obtained from a number of RNA expression studies (Zou et al., Reference Zou, Ke, Zhang, Zhou, Liao, Zhu, Zhou, Tu, Chen and Jin2010; Smith et al., Reference Smith, Smith, Yu, Paton, Gutowska, Forrest, Danner, Seiler, Digard, Webster and Burt2015; Ranaware et al., Reference Ranaware, Mishra, Vijayakumar, Gandhale, Kumar, Kulkarni and Raut2016), have not identified a mechanism of resistance to AI. It is understood that expression of some genes is intensely triggered during infection. However, as this response is often not effective, the key factors underlying HPAI survival are still not known.
The study herein suggests that the gene NLGN4, located on chromosome 1 between 126.29 and126.41 Mb, can be a positional candidate for resistance to H7N3 infection. This gene codes a neuronal cell surface protein, neuroligin 4, that is expressed mostly in brain tissue, and has been associated with autism in humans (Jamain et al., Reference Jamain, Quach, Betancur, Råstam, Colineaux, Gillberg, Soderstrom, Giros, Leboyer, Gillberg and Bourgeron2003). Neurovirulence of some Influenza strains has been observed in a number of studies. It is worth mentioning that some strains of AI show high affinity to brain tissue and neurological symptoms can be very severe (Balasubramaniam et al., Reference Balasubramaniam, Wai, Omar, Othman and Hassan2012). According to Zou et al. (Reference Zou, Ke, Zhang, Zhou, Liao, Zhu, Zhou, Tu, Chen and Jin2010), the most significant changes in gene expression as a result of HPAI infection were found in cytoskeleton proteins, proteins associated with the ubiquitin-proteasome pathway, and neural signal transduction proteins. Another signal in our analysis pointed to the NRXN3 gene, located on chromosome 5 at 39.2 Mb, which also codes a neuronal surface protein. In addition, NLGN4 belongs to the family of neurexin binding proteins, which suggests a functional relationship between the products of two genes. According to Cornelissen et al. (Reference Cornelissen, Vervelde, Post and Rebel2013), the influx of replicating virus in the brain and its induced immune process, may be critical for the high mortality in chickens to HPAI infection.
It is important to mention that both variants located on chromosomes 1 (126.028 Mb) and 5 (39.2 Mb) were located in close proximity to micro RNAs (miRNAs) coding regions. The role of miRNAs in host pathogen interactions has been confirmed in a number of studies, although it is not yet fully understood. In the work of Wang et al. (Reference Wang, Brahmakshatriya, Lupiani, Reddy, Soibam, Benham, Gunaratne, Liu, Trakooljul, Ing, Okimoto and Zhou2012), differential expression of 73 miRNAs in lungs and 36 miRNAs in tracheae was observed between AI infected and noninfected chickens. None of the two miRNAs included in Table 4 were reported in the study of Wang et al. (Reference Wang, Brahmakshatriya, Lupiani, Reddy, Soibam, Benham, Gunaratne, Liu, Trakooljul, Ing, Okimoto and Zhou2012) nevertheless as that study was performed on broilers it is possible that not all associations of miRNAs with HPAI resistance will overlap within different layers lines. Thus, the role of miRNAs close to identified regions in HPAI survival requires further research.
A region that approached significance in the logistic model was located at 82.2 Mb on chromosome 1. The SNPs underlying the signal in this region are located between GAP43 (neuromodilin) and zinc finger and BTB domain containing 20 (ZBTB20) genes. The first of these two genes plays a major role in effective regeneration of the nervous system, while the other gene, ZBTB20, is a transcription factor involved in immune response, such as regulation of IL-6 production and IFN-β (Table 4). A number of other genes important for nervous system functioning such as Limbic system-associated membrane protein (LSAMP) or dopamine receptor D3 (DRD3) were also located in close proximity to the identified region.
The region identified at 28 Mb on chromosome 7 is spanned by the gene dipeptidyl-peptidase 10 (DPP10), which encodes a protein that is an integral component of the plasma membrane. Biological process GO terms associated with DPP10 include cell communication, immune system process, and cellular defense response. In humans, the DPP10 gene is primarily expressed in brain but expression was also present in lung and it has been implicated as a disease factor for asthma (Malerba and Pignatti, Reference Malerba and Pignatti2005). In addition, several other interesting genes are located in close proximity to the rs16605877 SNP, such as secretic receptor (SCTR) (at 27.85 Mb), which is a cell surface receptor involved in immune response, synaptic vesicle exocytosis, and response to stress based on Panther GO terms.
A number of regions that were identified by the BayesB analysis of the Iowa/H5N2 outbreak data were located on chromosomes 9 and 15. The region on chromosome 9 overlaps the BCL6 gene (B-cell CLL/lymphoma 6) and the ZNF639gene (zinc finger protein 639), which are potential candidate genes due to their role in immune response during virus infection. The BCL6 gene has a number of functions related to cell growth and proliferation. Its expression in human is regulated by interleukin-6 and interleukin-21 and the gene is required for BCL6 for programming of T follicular helper cell generation (Nurieva et al., Reference Nurieva, Chung, Martinez, Yang, Tanaka, Matskevitch, Wang and Dong2009). The region on chromosome 15 is also rich in genes with immune system function, for example the MAPK1 gene, which is a member of the apoptosis signaling pathway. Programmed cell death has been suggested to contribute to mortality of the host following virus infection (Post et al., Reference Post, Burt, Cornelissen, Broks, van Zoelen and Peeters2012). It is also known that delayed apoptosis of infected cells is an important mechanism for prolonged virus replication (Hui et al., Reference Hui, Li, Cheung, Chan, Yuen, Mok, Nicholls, Peiris and Chan2016).
Four genomic regions associated with survival during HPAI challenge were associated with survival in the Iowa/H5N2 outbreak and three with survival in the Mexico/H7N3 outbreak but these regions did not overlap. The presence of different genomic regions associated with survival to different virus strains can be challenging for the poultry industry, as it requires more diversified strategies to be developed for fighting AI. Our identification of genetic regions and candidate genes associated with HPAI survival is a step forward to better characterization of the genetic basis for AI resistance in chicken. Follow-up molecular studies on the identified regions are needed to increase our understanding of HPAI viral pathogenesis. Specifically, some of the identified candidate genes may be further investigated for targeted use of genomic methods, such as gene editing, or for targeting vaccines to block the products of these genes as entry route for the virus. No single gene with large effect on HPAI survival was identified, which suggests a complex nature of survival to HPAI challenge but with a significant genetic component.
Acknowledgments
The authors would like to thank Hy-Line International, Lohmann Tierzucht and the Iowa Egg Industry Center for funding, Juan Carlos Casillas from Hy-Line de Mexico for sample collection, and numerous commercial egg production facilities within Iowa for enabling sample collection.
Supplementary material
To view supplementary material for this article, please visit https://doi.org/10.1017/S1751731117002889