



%20--%3e%3c!DOCTYPE%20svg%20PUBLIC%20'-//W3C//DTD%20SVG%201.0//EN'%20'http://www.w3.org/TR/2001/REC-SVG-20010904/DTD/svg10.dtd'%3e%3csvg%20version='1.0'%20id='Layer_1'%20xmlns='http://www.w3.org/2000/svg'%20xmlns:xlink='http://www.w3.org/1999/xlink'%20x='0px'%20y='0px'%20width='64px'%20height='64px'%20viewBox='5.5%20-3.5%2064%2064'%20enable-background='new%205.5%20-3.5%2064%2064'%20xml:space='preserve'%3e%3cg%3e%3ccircle%20fill='%23FFFFFF'%20fill-opacity='0'%20cx='37.785'%20cy='28.501'%20r='28.836'/%3e%3cpath%20fill='%23595959'%20d='M37.441-3.5c8.951,0,16.572,3.125,22.857,9.372c3.008,3.009,5.295,6.448,6.857,10.314%20c1.561,3.867,2.344,7.971,2.344,12.314c0,4.381-0.773,8.486-2.314,12.313c-1.543,3.828-3.82,7.21-6.828,10.143%20c-3.123,3.085-6.666,5.448-10.629,7.086c-3.961,1.638-8.057,2.457-12.285,2.457s-8.276-0.808-12.143-2.429%20c-3.866-1.618-7.333-3.961-10.4-7.027c-3.067-3.066-5.4-6.524-7-10.372S5.5,32.767,5.5,28.5c0-4.229,0.809-8.295,2.428-12.2%20c1.619-3.905,3.972-7.4,7.057-10.486C21.08-0.394,28.565-3.5,37.441-3.5z%20M37.557,2.272c-7.314,0-13.467,2.553-18.458,7.657%20c-2.515,2.553-4.448,5.419-5.8,8.6c-1.354,3.181-2.029,6.505-2.029,9.972c0,3.429,0.675,6.734,2.029,9.913%20c1.353,3.183,3.285,6.021,5.8,8.516c2.514,2.496,5.351,4.399,8.515,5.715c3.161,1.314,6.476,1.971,9.943,1.971%20c3.428,0,6.75-0.665,9.973-1.999c3.219-1.335,6.121-3.257,8.713-5.771c4.99-4.876,7.484-10.99,7.484-18.344%20c0-3.543-0.648-6.895-1.943-10.057c-1.293-3.162-3.18-5.98-5.654-8.458C50.984,4.844,44.795,2.272,37.557,2.272z%20M37.156,23.187%20l-4.287,2.229c-0.458-0.951-1.019-1.619-1.685-2c-0.667-0.38-1.286-0.571-1.858-0.571c-2.856,0-4.286,1.885-4.286,5.657%20c0,1.714,0.362,3.084,1.085,4.113c0.724,1.029,1.791,1.544,3.201,1.544c1.867,0,3.181-0.915,3.944-2.743l3.942,2%20c-0.838,1.563-2,2.791-3.486,3.686c-1.484,0.896-3.123,1.343-4.914,1.343c-2.857,0-5.163-0.875-6.915-2.629%20c-1.752-1.752-2.628-4.19-2.628-7.313c0-3.048,0.886-5.466,2.657-7.257c1.771-1.79,4.009-2.686,6.715-2.686%20C32.604,18.558,35.441,20.101,37.156,23.187z%20M55.613,23.187l-4.229,2.229c-0.457-0.951-1.02-1.619-1.686-2%20c-0.668-0.38-1.307-0.571-1.914-0.571c-2.857,0-4.287,1.885-4.287,5.657c0,1.714,0.363,3.084,1.086,4.113%20c0.723,1.029,1.789,1.544,3.201,1.544c1.865,0,3.18-0.915,3.941-2.743l4,2c-0.875,1.563-2.057,2.791-3.541,3.686%20c-1.486,0.896-3.105,1.343-4.857,1.343c-2.896,0-5.209-0.875-6.941-2.629c-1.736-1.752-2.602-4.19-2.602-7.313%20c0-3.048,0.885-5.466,2.658-7.257c1.77-1.79,4.008-2.686,6.713-2.686C51.117,18.558,53.938,20.101,55.613,23.187z'/%3e%3c/g%3e%3c/svg%3e)
%20--%3e%3c!DOCTYPE%20svg%20PUBLIC%20'-//W3C//DTD%20SVG%201.0//EN'%20'http://www.w3.org/TR/2001/REC-SVG-20010904/DTD/svg10.dtd'%3e%3csvg%20version='1.0'%20id='Layer_1'%20xmlns='http://www.w3.org/2000/svg'%20xmlns:xlink='http://www.w3.org/1999/xlink'%20x='0px'%20y='0px'%20width='64px'%20height='64px'%20viewBox='5.5%20-3.5%2064%2064'%20enable-background='new%205.5%20-3.5%2064%2064'%20xml:space='preserve'%3e%3cg%3e%3ccircle%20fill='%23FFFFFF'%20fill-opacity='0'%20cx='37.637'%20cy='28.806'%20r='28.276'/%3e%3cg%3e%3cpath%20fill='%23595959'%20d='M37.443-3.5c8.988,0,16.57,3.085,22.742,9.257C66.393,11.967,69.5,19.548,69.5,28.5c0,8.991-3.049,16.476-9.145,22.456%20C53.879,57.319,46.242,60.5,37.443,60.5c-8.649,0-16.153-3.144-22.514-9.43C8.644,44.784,5.5,37.262,5.5,28.5%20c0-8.761,3.144-16.342,9.429-22.742C21.101-0.415,28.604-3.5,37.443-3.5z%20M37.557,2.272c-7.276,0-13.428,2.553-18.457,7.657%20c-5.22,5.334-7.829,11.525-7.829,18.572c0,7.086,2.59,13.22,7.77,18.398c5.181,5.182,11.352,7.771,18.514,7.771%20c7.123,0,13.334-2.607,18.629-7.828c5.029-4.838,7.543-10.952,7.543-18.343c0-7.276-2.553-13.465-7.656-18.571%20C50.967,4.824,44.795,2.272,37.557,2.272z%20M46.129,20.557v13.085h-3.656v15.542h-9.944V33.643h-3.656V20.557%20c0-0.572,0.2-1.057,0.599-1.457c0.401-0.399,0.887-0.6,1.457-0.6h13.144c0.533,0,1.01,0.2,1.428,0.6%20C45.918,19.5,46.129,19.986,46.129,20.557z%20M33.042,12.329c0-3.008,1.485-4.514,4.458-4.514s4.457,1.504,4.457,4.514%20c0,2.971-1.486,4.457-4.457,4.457S33.042,15.3,33.042,12.329z'/%3e%3c/g%3e%3c/g%3e%3c/svg%3e)
1. Introduction
Stellar mergers are a common outcome of binary evolution. At least 16% to 38% of binaries with initial primary masses between 5 and  $20\,\mathrm{M}_{\odot}$ (depending on the efficiency of mass transfer) result in such mergers, which leave behind a merger product (Henneco et al. Reference Henneco, Schneider and Laplace2024b, Henneco et al. in prep.). As a result, stellar merger products are predicted to be common as well, and they have been linked to various peculiar properties observed in stars. These properties include strong surface magnetic fields (e.g. Ferrario et al. Reference Ferrario, Pringle, Tout and Wickramasinghe2009; Wickramasinghe et al. Reference Wickramasinghe, Tout and Ferrario2014; Schneider et al. Reference Schneider, Ohlmann and Podsiadlowski2019; Ryu et al. Reference Ryu, Sills, Pakmor, de Mink and Mathieu2025), slow rotation (e.g. Schneider et al. Reference Schneider, Ohlmann and Podsiadlowski2019; Schneider et al. Reference Schneider, Ohlmann and Podsiadlowski2020; Wang et al. Reference Wang, Langer and Schootemeijer2022), and chemically peculiar stellar surfaces (e.g. Chiappini et al. Reference Chiappini, Anders and Rodrigues2015; Martig et al. Reference Martig, Rix and Silva Aguirre2015; Izzard et al. Reference Izzard, Preece and Jofre2018; Hekker & Johnson Reference Hekker and Johnson2019; Menon et al. Reference Menon, Ercolino and Urbaneja2024). Nevertheless, definite proof for the link between many of these peculiar properties and a star’s merger origin is still lacking. Combined with the fact that despite these supposed peculiarities, merger products can lead relatively normal lives and, hence, hide in stellar populations, there is a vital need for a way to unambiguously identify them.
Detailed 3D simulations of stellar mergers and collisions (not driven by binary evolution but by dynamical interactions in dense stellar environments), for example by Lombardi et al. (Reference Lombardi, Rasio, F and Shapiro1996), Sandquist et al. (Reference Sandquist, Bolte and Hernquist1997), Sills et al. (Reference Sills, Faber, Lombardi, Rasio, F. and Warren2001), Freitag & Benz (Reference Freitag and Benz2005), Dale & Davies (Reference Dale and Davies2006), Glebbeek et al. (Reference Glebbeek, Gaburov, Portegies Zwart and Pols2013) Schneider et al. (Reference Schneider, Ohlmann and Podsiadlowski2019), Ballone et al. (Reference Ballone, Costa and Mapelli2023), and Ryu et al. (Reference Ryu, Sills, Pakmor, de Mink and Mathieu2025), show that the interior structures of merger products deviate from those of genuine single stars, and that there is a large variety in this deviance. Because of this, merger products lend themselves as ideal objects to be studied with asteroseismology – the study of stellar interiors through stellar pulsations (see, e.g. Bowman Reference Bowman2020, Aerts Reference Aerts2021, and Kurtz Reference Kurtz2022 for recent reviews). The idea is namely that any features in the interiors of merger products, especially those not present in genuine single stars, might be able to help us identify them in case they have a measurable effect on the stellar pulsations.
We summarise the proof-of-concept ‘merger seismology’ studies by Henneco et al. (Reference Henneco, Schneider, Hekker and Aerts2024a) and Henneco et al. (Reference Henneco, Schneider, Heller, Hekker and Aerts2025) focussed on asteroseismology of massive merger products. Henneco et al. (Reference Henneco, Schneider, Hekker and Aerts2024a) makes predictions for the asteroseismic properties of the products of mergers that occurred after the primary star reached the end of the main sequence (MS). Depending on the properties of the binary progenitors of these mergers, their product can remain in the blue part of the Hertzsprung-Russell diagram (HRD) for millions of years, making them observable as blue supergiants (BSGs) and potentially solving the blue supergiant problem (Bellinger et al. Reference Bellinger, de Mink, van Rossem and Justham2024). Henneco et al. (Reference Henneco, Schneider, Heller, Hekker and Aerts2025) focussed on the product of a merger between two massive MS stars. Such MS merger products have been found to rejuvenate because fresh hydrogen is mixed into their core. They are of particular interest for merger seismology given that they seem to unsuspiciously live MS lives after this rejuvenation, or, on the contrary, stick out as blue and red stragglers (e.g. Schneider et al. Reference Schneider, Izzard, Langer and de Mink2015; Britavskiy et al. Reference Britavskiy, Lennon and Patrick2019).
2. Methods
We give a brief overview of the codes and tools used to create 1D merger product models and predict their asteroseismic properties. We also cover the main asteroseismic diagnostics used in Henneco et al. (Reference Henneco, Schneider, Hekker and Aerts2024a) and Henneco et al. (Reference Henneco, Schneider, Heller, Hekker and Aerts2025).
2.1. BSG merger products via fast accretion
In Henneco et al. (Reference Henneco, Schneider, Hekker and Aerts2024a), we used an approximate 1D method to emulate a merger between a post-MS star and its companion. This method, commonly referred to as ‘fast accretion’, consists of accreting a certain amount of mass onto a 1D single-star model at a given time during its evolution, in this case right after the MS. Since mergers are dynamical processes, the aim is to make the accretion timescale as short as possible, while still safeguarding the numerical convergence of the model. To this end, a timescale of 10% of the star’s global thermal timescale was chosen. The resulting stellar model is then further evolved until the end of core helium burning. These evolutionary calculations and the fast accretion method were all conducted using the <momospace>MESA</momospace> stellar evolution code (Paxton et al. Reference Paxton, Smolec and Schwab2019, and references therein). For more details, we refer to Sect. 3 of Henneco et al. (Reference Henneco, Schneider, Hekker and Aerts2024a).
2.2. MS merger product from a 3D MHD simulation
As detailed in Henneco et al. (Reference Henneco, Schneider, Heller, Hekker and Aerts2025), we used the outcome of the 3D magnetohydrodynamic (MHD) stellar merger simulation from Schneider et al. (Reference Schneider, Ohlmann and Podsiadlowski2019) as a starting point for our stellar evolution calculations with <momospace>MESA</momospace>. Following the methodology of Schneider et al. (Reference Schneider, Ohlmann and Podsiadlowski2020), the 3D merger product structure was mapped to 1D and relaxed in <momospace>MESA</momospace>. After this relaxation, we modelled the MS evolution of the 1D merger product model until the terminal-age main sequence (TAMS). For more details on the setup of these calculations, we refer the reader to Sect. 3 of Henneco et al. (Reference Henneco, Schneider, Heller, Hekker and Aerts2025).
Since the goal of both works was to compare the asteroseismic properties of merger products with those of genuine single stars, we computed suites of genuine single-star evolution models with <momospace>MESA</momospace> and selected those models that crossed (in the case of the BSG merger product) or overlapped with (in the case of the MS merger product) the HRD evolution tracks of the merger products. This was done with the following question in mind: If a genuine single star and a merger product have exactly the same surface properties, will their asteroseismic properties allow us to distinguish them?
2.3. Stellar pulsation predictions
One of the main asteroseismic diagnostics for the type of stars under consideration, is the spacing between the periods of their gravity-mode (g-mode) pulsations. These g modes have the buoyancy force as their restoring force and, as a result, become evanescent in regions where the stellar matter is unstable against convection. The power of this spacing is that, in the simplest, non-rotating, non-magnetic, chemically homogeneous case, for modes with a large number of radial nodes (asymptotic regime), it is constant and related to the size, shape and chemical composition inside of the mode cavity, which roughly corresponds to the radiative region(s) in the star (Aerts et al. Reference Aerts, Christensen-Dalsgaard and Kurtz2010). The asymptotic period spacing  $\Pi_{\ell}$ can be computed directly from the stellar structure models through (Tassoul Reference Tassoul1980)
 \begin{equation} \Pi_{\ell} = \frac{\Pi_{0}}{\sqrt{\ell(\ell+1)}}\,,\quad \text{with} \quad \Pi_{0} = \pi\left(\int_{r_{\mathrm{i}}}^{r_{\mathrm{o}}}\frac{\tilde{N}}{r}\mathrm{d}r\right)^{-1} \, .\end{equation}
Here,  $\tilde{N}$ is the Brunt-Väisälä (BV) or buoyancy frequency,
 $\ell$ the spherical degree of the modes in question, r the radial coordinate, and
 $r_{\mathrm{i}}$ and
 $r_{\mathrm{o}}$ are the inner and outer boundaries of the g-mode cavity, respectively.
What makes the period spacing even more powerful, is that any deviations from the conditions posed above, such as chemical gradients, internal magnetic fields and rotation, cause deviations from its constant behaviour. These deviations become apparent in so-called ‘period spacing patterns’, which show the spacings between the periods of modes of the same degree but of consecutive radial orders in terms of the radial order or mode period, and can be used to constrain the interiors of stars (see, e.g. Miglio et al. Reference Miglio, Montalbán, Noels and Eggenberger2008, Bouabid et al. Reference Bouabid, Dupret and Salmon2013, Van Reeth et al. Reference Van Reeth, Tkachenko and Aerts2016, Pápics et al. Reference Pápics, Tkachenko and Van Reeth2017, Cunha et al. Reference Cunha, Avelino and Christensen-Dalsgaard2019, Li et al. Reference Li, Van Reeth and Bedding2020, and Pedersen et al. Reference Pedersen, Aerts and Pápics2021). To construct theoretical period spacing patterns, we require predictions for the individual pulsation modes, which we computed using the stellar pulsation code <momospace>GYRE</momospace> (Townsend & Teitler Reference Townsend and Teitler2013; Townsend et al. Reference Townsend, Goldstein and Zweibel2018). This code takes the stellar structure profiles from <momospace>MESA</momospace> (and other stellar evolution codes) as input.
3. Results
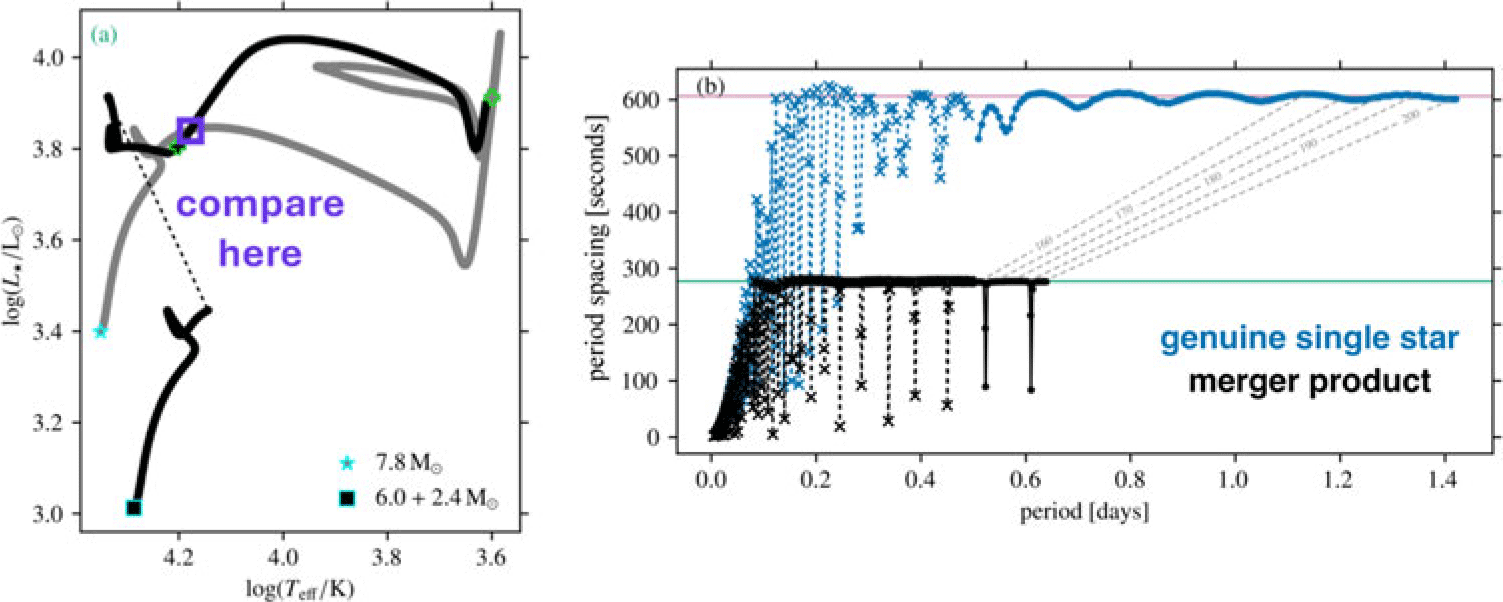
We show the HRD evolution of a  $6.0+2.4\,\mathrm{M}_{\odot}$ BSG merger product and a
 $7.8\,\mathrm{M}_{\odot}$ genuine single stars whose evolutionary tracks cross in the Hertzsprung gap (HG) in the left panel of Fig. 1. From the ‘plus symbol’, which shows the merger product’s position 1 Myr after the merger, we see that the merger product is a long-lived BSG. The genuine single star – on the other hand – crosses the HG quickly and can be found as a red supergiant (RSG) 1 Myr after the TAMS. On the right panel of Fig. 1, we show predicted period spacing patterns for the two stars at the moment they cross in the HRD. Because of their different internal structures – the merger product has a convective helium-burning core and a convective hydrogen burning shell, while the genuine single star is almost fully radiative – the mean values of the two period spacing patterns differ by a factor of roughly 2. The deep dips in the period spacing pattern of the merger product are caused by interactions between g modes in the star’s two mode cavities, separated by the convective hydrogen-burning shell.
HRD evolution tracks (left) and predicted period spacing patterns (right) for a  $6.0+2.4\,\mathrm{M}_{\odot}$ BSG merger product and
 $7.8\,\mathrm{M}_{\odot}$ genuine single star. The period spacing patterns are computed at the time the HRD tracks cross (purple box in the left panel). Figures adapted from Henneco et al. (Reference Henneco, Schneider, Hekker and Aerts2024a).

Figure 1 Long description
Panel A: A line graph shows the Hertzsprung-Russell Diagram (HRD) evolution tracks for a 6.0 + 2.4 solar mass (M☉) blue supergiant (BSG) merger product and a 7.8 M☉ genuine single star. The x-axis represents the logarithm of effective temperature (log(Teff)) in Kelvin (K), ranging from 3.6 to 4.2. The y-axis represents the logarithm of luminosity (log(L/L☉)), ranging from 3.0 to 4.0. The tracks are color-coded, with the merger product in black and the single star in gray. A purple box highlights the point of comparison. Panel B: A scatter plot displays the predicted period spacing patterns for the same stars at the time the HRD tracks cross. The x-axis represents the period in days, ranging from 0.0 to 1.4. The y-axis represents the period spacing in seconds, ranging from 0 to 600. The merger product is shown in blue, and the single star is shown in black. The patterns show distinct differences in period spacing.
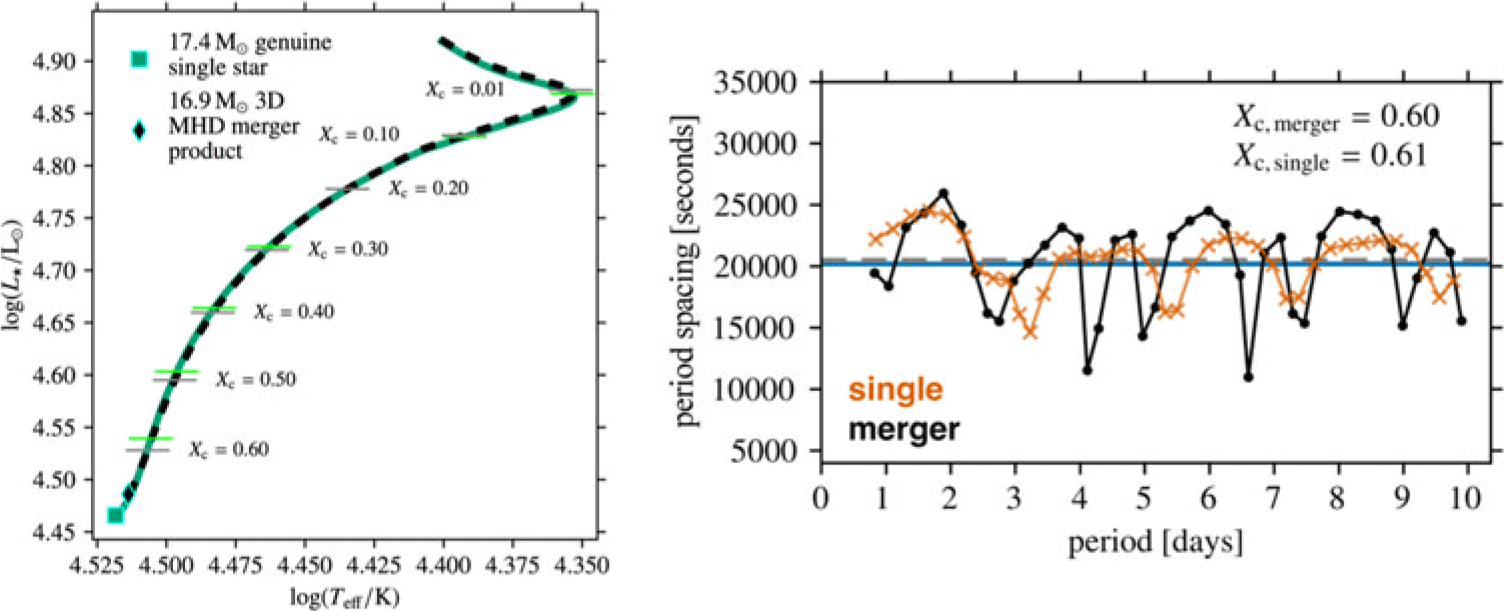
The left panel of Fig. 2 shows the HRD evolution of a  $16.9\,\mathrm{M}_{\odot}$ MS merger product and
 $17.4\,\mathrm{M}_{\odot}$ genuine single star. These tracks overlap, meaning that despite their different central hydrogen mass fractions and masses, the stars have the same surface properties. The period spacing patterns on the right panel of Fig. 2 show that the mean period spacing values of the two stars are closer in relative value than for the BSGs. Yet, their differences are larger than the current best uncertainties on period spacing values. These differences are caused by the different interior structures of both stars; the more helium-rich core of the primary star has formed a layer around the new core of the merger product, leading to an increased helium abundance in the g-mode cavity. Other differences in the size and shape of the g-mode cavity also contribute to this difference. Another noticeable difference in the two patterns is the presence of additional dips in the merger product’s pattern. In general, such quasi-periodic dips are the result of chemical gradients. The additional dips stem from a chemical glitch left behind by a transient convective core, which itself is a result of the star’s merger origin.
HRD evolution tracks (left) and predicted period spacing patterns (right) for a  $16.9\,\mathrm{M}_{\odot}$ MS merger product and
 $17.4\,\mathrm{M}_{\odot}$ genuine single star. Figures adapted from Henneco et al. (Reference Henneco, Schneider, Heller, Hekker and Aerts2025).

Lastly, we also compared several 1D prescriptions (fast accretion, entropy sorting and Make Me A Massive Star) to emulate the merger of two MS stars and compared them to the structural and seismic properties of the 3D MHD merger product. We show that none of these prescriptions accurately reproduces the results found for the 3D MHD merger product.
4. Summary
We gave an overview of our two recent proof-of-concept studies, Henneco et al. (Reference Henneco, Schneider, Hekker and Aerts2024a) and Henneco et al. (Reference Henneco, Schneider, Heller, Hekker and Aerts2025), on merger seismology, which aims to answer the question if and how we can use asteroseismology to identify stellar merger products. These studies show that merger products pulsate measurably differently from genuine single stars, showing great promise for future studies in this direction. However, they also show that there are still many uncertainties and caveats, such as missing physics and the need for calibrated 1D merger prescriptions, that need to be accounted for to take this field to a state in which it can be applied in practice.
 6.0+2.4M⊙
 7.8M⊙
 16.9M⊙
 17.4M⊙

 Open access

